With the revival of trade war tensions, global equities experienced their largest drawdown of the year last week. After an impressive rally year-to-date, exceptional in terms of both amplitude (one of the strongest starts to the year since 1970) and path (one of highest hit ratios in history), global equities fell by 2.5%. Does this signal the end of the beta party that was triggered by the US Federal Reserve’s accommodative turn last December or will the market continue to dance? And against this backdrop, has diversification and hedging proved effective? As is usual during market stress events, contagion to other risky assets has been large with rising implied volatility, widening credit spreads and falling cyclical commodities. Within this market environment, classic defensive assets have failed to protect diversified portfolios. Global sovereign bonds were slightly positive, while precious metals declined slightly and systematic hedge fund defensive strategies, such as CTA, posted negative returns over the period. Although the period under review was too short and the trigger too noisy to create a large ’flight to quality’, it does challenge the benefits of using these kinds of defensive assets in a multi asset portfolio.“LET’S DANCE” – DAVID BOWIE, 1983
What’s next?
Classic diversifiers have not delivered expected protection
Firstly, the drawdown follows a very poor year for diversification. Indeed, a distinctive feature of 2018 was the lack of benefits from diversification, which is one of the key pillars of multi asset strategies to deliver smoother returns over time. Most of the ’usual’ defensive assets posted poor returns over the year and were significantly lower compared to previous equity market corrections. We have analysed the performance of these classic hedges (global sovereign bonds, defensive hedge fund strategies, commodities) in the years when the MSCI World AC index posted a negative annual return. Our findings show that diversification did not play its role in 2018, with an average hedge performance of -3.9% versus an annual average of +4.4% for the period 2000 to 2017. Some usual defensive strategies helped to smooth the return last year such as low volatility equities but, overall, with a higher frequency of large moves, 2018 delivered one of the largest correlation shocks in many years.
Secondly, if correlation across assets and correlation between defensive assets and macro regimes are changing, we need to adapt our dynamic risk management. It is crucial at this stage of the economic cycle to dissociate 1) diversifiers, such as sovereign bonds or gold, which provide positive carry but uncertain protection due to changing correlations, and 2) hedges, such as long volatility or optional strategies, which are more certain but have a negative carry. We believe in both diversifiers and hedges, which would allow us to dance until the very last song.
Quantitative easing (QE) has modified the impact of central bank action on both asset returns and asset behaviour. Before the great financial crisis, central bank easing had an impact on long-term rates through the forward curve and on risky assets via discount rates. The correlation between sovereign bonds and equities turned from positive to negative in the 1990s for Japanese assets and from 2000 for US ones. In the US, this was referred to as the ’Fed put’ – the Fed’s willingness and ability to adjust monetary policy in a way that was supportive for stock markets.The new central bank put: from rates channel to volatility channel
Since the financial crisis, the role of central banks is no longer to ease financial conditions but to suppress volatility shocks. Liquidity injections and low rates for longer periods pushed investors to take on more risk via longer duration, higher leverage or lower credit ratings. The rising ratio of central bank balance sheets to GDP has lowered realised and implied volatility for financial assets and macro data. Whatever the news, that is good for risk because central banks are and will be there.
In the past, central banks would surprise markets to prove their independency and increase their credibility, but in 2013 we had the famous ’taper tantrum’ episode. Since then, we have guidance and dot projections and this has helped reduce any element of surprise. But what does this mean for diversifiers and for hedges?
Firstly, it is counterintuitive. It increases the cost of hedging because selling volatility becomes more and more profitable, while carry costs of being hedged become more and more expensive. Secondly, if the probability of or if the amplitude of shocks become lower, the need for hedges declines. We then enter a vicious cycle where lower implied volatility creates higher risk taking, leading to bigger drawdowns when there are unexpected shocks, which in turn leads to closer central bank monitoring to avoid financial instability, triggering lower realised volatility.
That last implication of QE is the low level of interest rates. If we consider that there is a floor for negative rates, the cushion provided by bonds with negative rates becomes lower.

Against this new backdrop, we believe that strategically encompassing new sources of return in order to diversify protection is key to delivering smooth returns. Using FX strategies is one way because they react to macro risks and central bank actions, they are liquid enough to be flexible and they are not as constrained as bonds with negative yield. We have developed two defensive strategies to expand the universe of diversifiers beyond traditional ones, such as sovereign bonds and low volatility equities. Our FX value strategy, which is long undervalued FX versus overvalued FX, has delivered positive absolute returns over the last five years but, importantly, it has posted positive returns during periods of market stress. We have also developed a defensive FX strategy to increase our equity protection. Mixing different criteria such as correlation to equities, high hit ratios when equities decline or constraints on the cost of carry, the strategy aims to deliver positive returns with higher asymmetry than sovereign bonds when risk assets suffer. These FX strategies worked very well in 2018 and also posted positive returns last week. We like going to the dancefloor and listening to the ‘new’ music of central banks. However, we prefer to dance with a large spectrum of diversifiers and intensify our dynamic hedging through optional strategies because when the music stops, correlations and asset returns shift to the negative, leading to lower realised protection compared to expectations.Diversifying the protection

Let’s Dance

Our medium-term views are fairly neutral, with selective overweights in risky assets including investment grade and emerging credit. We continue to protect the downside from an equity sell-off via options as we see challenging conditions for global equities. Month-to-date, the Uni-Global – Cross Asset Navigator fund is down 1.0% versus a fall of 2.5% for the MSCI AC World index and a rise of 0.2% for the Barclays Global Aggregate (USD hedged). Year-to-date, the Uni-Global – Cross Asset Navigator has returned 4.4% versus 13% for the MSCI AC World index, while the Barclays Global Aggregate (USD hedged) index is up 3.3%.Strategy behaviour
Performance review
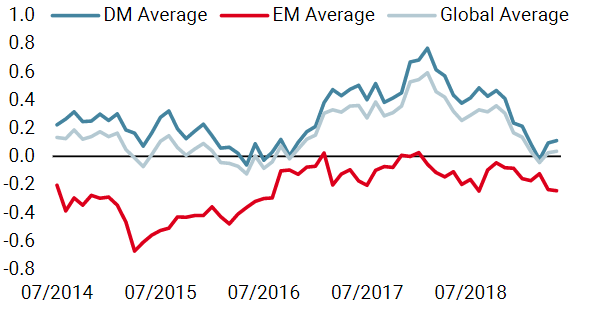
Unigestion nowcasting
World Growth Nowcaster
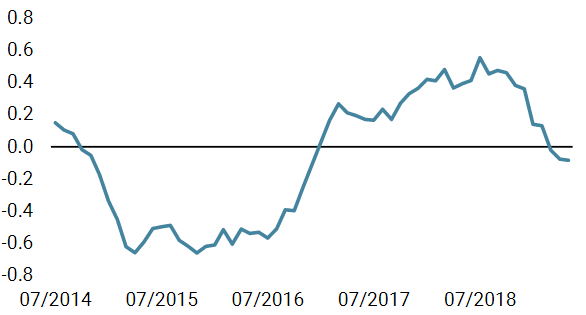
World Inflation Nowcaster
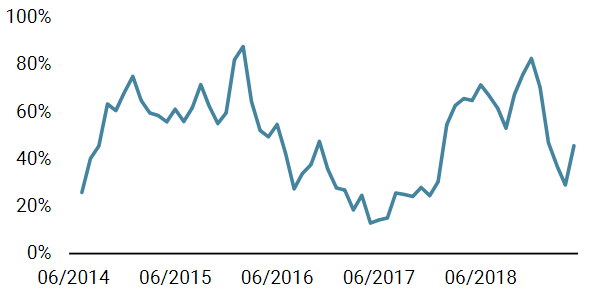
Market Stress Nowcaster
Weekly Change
- Our world Growth Nowcaster remained unchanged last week, giving another confirmation of the pause in the slowdown.
- Similarly, our world Inflation Nowcaster remained stable at sub-zero levels, implying inflation risk is low for now.
- Market stress increased significantly over the course of the week, with volatility and spreads moving higher.
Sources: Unigestion. Bloomberg, as of 13 May 2019.
Navigator fund performance
| Performance, net of fees | 2018 | 2017 | 2016 | 2015 |
| Navigator (inception 15 December 2014) | -3.6% | 10.6% | 4.4% | -2.2% |
Past performance is no guide to the future, the value of investments can fall as well as rise, there is no guarantee that your initial investment will be returned.
Important Information
Past performance is no guide to the future, the value of investments can fall as well as rise, there is no guarantee that your initial investment will be returned. This document has been prepared for your information only and must not be distributed, published, reproduced or disclosed by recipients to any other person. This is a promotional statement of our investment philosophy and services only in relation to the subject matter of this presentation. It constitutes neither investment advice nor recommendation. This document represents no offer, solicitation or suggestion of suitability to subscribe in the investment vehicles it refers to.
Please contact your professional adviser/consultant before making an investment decision. Where possible we aim to disclose the material risks pertinent to this document, and as such, these should be noted on the individual document pages. A complete list of all the applicable risks can be found in the Fund prospectus. Some of the investment strategies described or alluded to herein may be construed as high risk and not readily realisable investments, which may experience substantial and sudden losses including total loss of investment.
These are not suitable for all types of investors. To the extent that this report contains statements about the future, such statements are forward-looking and subject to a number of risks and uncertainties, including, but not limited to, the impact of competitive products, market acceptance risks and other risks. As such, forward looking statements should not be relied upon for future returns. Data and graphical information herein are for information only and may have been derived from third party sources. Unigestion takes reasonable steps to verify, but does not guarantee, the accuracy and completeness of this information. As a result, no representation or warranty, expressed or implied, is or will be made by Unigestion in this respect and no responsibility or liability is or will be accepted. All information provided here is subject to change without notice.
It should only be considered current as of the date of publication without regard to the date on which you may access the information. Rates of exchange may cause the value of investments to go up or down. An investment with Unigestion, like all investments, contains risks, including total loss for the investor.
Uni-Global – Cross Asset Navigator is a compartment of the Luxembourg Uni-Global SICAV Part I, UCITS IV compliant. This compartment is currently authorised for distribution in Austria, Belgium, Denmark, Finland, France, Germany, Ireland, Italy, Luxembourg, Netherlands, Norway, Spain, UK, Sweden, and Switzerland. In Italy, this compartment can be offered only to qualified investors within the meaning of art.100 D. Leg. 58/1998. Its shares may not be offered or distributed in any country where such offer or distribution would be prohibited by law.
All investors must obtain and carefully read the prospectus which contains additional information needed to evaluate the potential investment and provides important disclosures regarding risks, fees and expenses. Unless otherwise stated performance is shown net of fees in USD and does not include the commission and fees charged at the time of subscribing for or redeeming shares.
Unigestion UK, which is authorised and regulated by the UK Financial Conduct Authority, has issued this document. Unigestion SA authorised and regulated by the Swiss FINMA. Unigestion Asset Management (France) S.A. authorised and regulated by the French Autorité des Marchés Financiers. Unigestion Asia Pte Limited authorised and regulated by the Monetary Authority of Singapore. Performance source: Unigestion, Bloomberg, Morningstar. Performance is shown on an annualised basis unless otherwise stated and is based on Uni Global – Cross Asset Navigator RA-USD net of fees with data from 15.12.2014 to 13.05.2019.