Last week, despite global equities rallying 3.5%, sovereign bond yields continued to decline. Several factors explain this trend, including a “flight to quality” on the back of rising trade war tensions, lower inflation premiums generated by a declining oil price and the European authorities placing Italian debt under review. However, the most important driver remains the U-turn in the stance of central banks within just six months. For example, the RBA cut its main rates last week, following on from a cut by the New Zealand central bank in May. Importantly, both the Fed and the ECB have confirmed that the next move could be a cut and not a hike, as expected six months ago. Once again, central banks are the price makers. Should we be prepared to dance and twist again? Traditionally, portfolio managers have to track macro data, inflation expectations, the earnings outlook and the geopolitical equilibrium to allocate risk within their respective investment universes. Macro risk, market sentiment and valuation have historically been the main risk factors that drive asset returns over the short and medium term. However, since the financial crisis and the implementation of unconventional monetary policy, central bank press conferences have become key to assessing to what extent liquidity injections and lower short-term rates would continue to support risk premia. Following Trump’s election, there is now a new element that needs to be considered – the US President’s tweets. His messages affect both market sentiment and macro risks because any change in global trade will determine the global economic outlook. As for policy mix, where monetary and fiscal policy aims to find a balance in the cyclicality of implemented measures, there is now a new challenge for investors – interpreting the ping-pong between Trump’s tweets and Powell’s speeches. The most recent Trump announcements have nearly all been negative for equity markets because they focused on higher tariffs and rising protectionism measures, while Powell’s interventions have been markedly supportive for both bonds and equities. We have analysed the speeches, press conferences and testimonies that the Fed president has given since 2018. The turn is clear. Average daily performance of the S&P 500 index on the day of the communication was negative (-0.23%) in 2018 when the Fed was focused on inflation pressures and normalisation. In 2019, when its tone shifted toward easier financial conditions to avoid policy mistakes, the average daily performance has been positive (+0.16%) on communication days. The change is similar for US 2-year interest rates. In 2018, the average change in yield was up 1bp following the communication, while in 2019 this has reversed to a fall of 3bps. The message delivered last week by Fed members has highlighted how much things have changed. While core inflation is currently well below the Fed target and uncertainty about trade war consequences are rising, the potential for a rate cut has been alluded to by different Fed members. As a result, the 2-year bond yield reached a new low at 1.84%, having stood at 3% one year ago. This fall reflects aggressive market expectations of two US rate cuts this year, in September and December, and at least two more next year. Following this dovish communication, most of the US bond yield curve (versus 3-month Treasury bill rates) is now inversed. This means that all bond yields for maturity up to 15 years are below the 3-month Treasury bill rate. Therefore, the real 3-month Treasury bill yield is now above real long-term rates (+0.7% vs +0.5% when we use the core PCE to deflate rates). This situation rarely occurs rarely and has historically been a clear signal of upcoming recession. However, with the Fed dot communication in March still pointing to interest rate hikes, is the current pricing too aggressive? Although the divergence is large, the trend is narrowing and the Fed is converging toward market pricing, in terms of both dot changes and communication. After communicating about patience, is time for action gone? We believe that the odds of a pre-emptive cut have risen. However, the market is currently pricing in an easing cycle, which is very different from a pre-emptive cut. Such an easing cycle only happens during recessions. While our proprietary US Nowcasters for both inflation and growth do not point to any recession risk for the time being, we think that expecting a cycle of easing soon is too optimistic. We believe that Fed could repeat the 1995 episode when it had temporarily lowered its main rates before pursuing the 1994 initiated cycle of tightening with a hike in 1997.“Let’s Twist Again” – CHUBBY CHECKER, 1961
What’s Next?
Managing tweets and speeches
From patience to action?

Although monetary policy expectations are already high, we tend to be less cautious than previously about growth-oriented assets. Macro elements with low but stable growth and without inflation risk are still supportive. And while market sentiment is mixed, it could reverse soon if there is no escalation in trade war talk. Moreover, high risk aversion is currently offset by a lighter positioning toward equities and lower earnings expectations than historically for most equity indices. Valuation is neutral while most growth-oriented assets have already rallied.Beta party one more time?
Our main argument remains the 1995 example. Then, 2-year interest rates had declined sharply, from 7.7% to 5.5%, ahead of the Fed cut in June. And, as with today, developed equities had posted large returns in the first five months of the year. Also similar to today, emerging assets and commodities were lagging. The one difference was the trend of the trade-weighted US dollar, which was much weaker than today.
So, what happened when the Fed did cut? Developed market equities and credit spreads resumed their rally. Equities returned 15% within six months, while long-term bond yields declined further and commodities rallied. One more time, let’s twist again?

Let’s Twist Again

Our medium-term view remains cautious but less defensive than previous months. We have neutralised our underweight in emerging assets because risk aversion has declined. Regarding the growth-oriented asset exposure, we are still complementing our equity position with options to protect the portfolio in the case of equity drawdowns. Over the last week, the Uni-Global – Cross Asset Navigator fund was up 1.4% versus a rise of 3.5% for the MSCI AC World index and 0.6% for the Barclays Global Aggregate (USD hedged) index. Year-to-date, the Uni-Global – Cross Asset Navigator has returned 4.9% versus 13.0% for the MSCI AC World index and 5.1% for the Barclays Global Aggregate (USD hedged) index.Strategy Behaviour
Performance Review
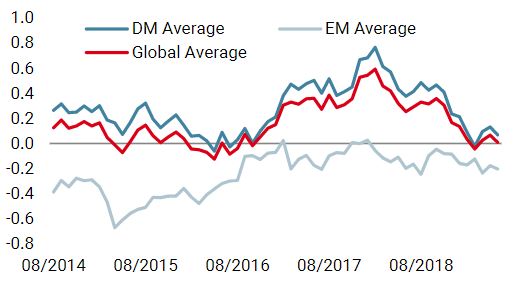
Unigestion Nowcasting
World Growth Nowcaster
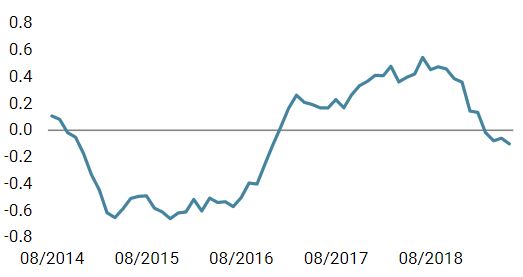
World Inflation Nowcaster
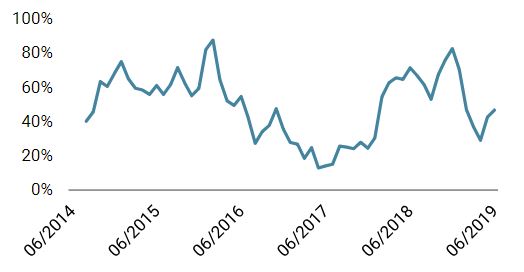
Market Stress Nowcaster
Weekly Change
- Our world Growth Nowcaster marginally increased last week, with economic data showing stronger readings in the US and Canada.
- Our world Inflation Nowcaster kept on rising last week, especially in the US and Japan.
- Market stress declined over the past week following the equity rally.
Sources: Unigestion. Bloomberg, as of 10 June 2019.
Past performance is no guide to the future, the value of investments can fall as well as rise, there is no guarantee that your initial investment will be returned. Important Information Past performance is no guide to the future, the value of investments, and the income from them change frequently, may fall as well as rise, there is no guarantee that your initial investment will be returned. This document has been prepared for your information only and must not be distributed, published, reproduced or disclosed by recipients to any other person. It is neither directed to, nor intended for distribution or use by, any person or entity who is a citizen or resident of, or domiciled or located in, any locality, state, country or jurisdiction where such distribution, publication, availability or use would be contrary to law or regulation. This is a promotional statement of our investment philosophy and services only in relation to the subject matter of this presentation. It constitutes neither investment advice nor recommendation. This document represents no offer, solicitation or suggestion of suitability to subscribe in the investment vehicles to which it refers. Any such offer to sell or solicitation of an offer to purchase shall be made only by formal offering documents, which include, among others, a confidential offering memorandum, limited partnership agreement (if applicable), investment management agreement (if applicable), operating agreement (if applicable), and related subscription documents (if applicable). Please contact your professional adviser/consultant before making an investment decision. Where possible we aim to disclose the material risks pertinent to this document, and as such these should be noted on the individual document pages. The views expressed in this document do not purport to be a complete description of the securities, markets and developments referred to in it. Reference to specific securities should not be considered a recommendation to buy or sell. Investors shall conduct their own analysis of the risks (including any legal, regulatory, tax or other consequences) associated with an investment and should seek independent professional advice. Some of the investment strategies described or alluded to herein may be construed as high risk and not readily realisable investments, which may experience substantial and sudden losses including total loss of investment. These are not suitable for all types of investors. To the extent that this report contains statements about the future, such statements are forward-looking and subject to a number of risks and uncertainties, including, but not limited to, the impact of competitive products, market acceptance risks and other risks. Actual results could differ materially from those in the forward-looking statements. As such, forward looking statements should not be relied upon for future returns. Targeted returns reflect subjective determinations by Unigestion based on a variety of factors, including, among others, internal modeling, investment strategy, prior performance of similar products (if any), volatility measures, risk tolerance and market conditions. Targeted returns are not intended to be actual performance and should not be relied upon as an indication of actual or future performance. Data and graphical information herein are for information only and may have been derived from third party sources. Unigestion takes reasonable steps to verify, but does not guarantee, the accuracy and completeness of this information. As a result, no representation or warranty, expressed or implied, is or will be made by Unigestion in this respect and no responsibility or liability is or will be accepted. All information provided here is subject to change without notice. It should only be considered current as of the date of publication without regard to the date on which you may access the information. Rates of exchange may cause the value of investments to go up or down. An investment with Unigestion, like all investments, contains risks, including total loss for the investor. Uni-Global – Cross Asset Navigator is a compartment of the Luxembourg Uni-Global SICAV Part I, UCITS IV compliant. This compartment is currently authorised for distribution in Austria, Belgium, Denmark, Finland, France, Germany, Ireland, Italy, Luxembourg, Netherlands, Norway, Spain, UK, Sweden, and Switzerland. In Italy, this compartment can be offered only to qualified investors within the meaning of art.100 D. Leg. 58/1998. Its shares may not be offered or distributed in any country where such offer or distribution would be prohibited by law. All investors must obtain and carefully read the prospectus which contains additional information needed to evaluate the potential investment and provides important disclosures regarding risks, fees and expenses. Unless otherwise stated performance is shown net of fees in USD and does not include the commission and fees charged at the time of subscribing for or redeeming shares. Unigestion UK, which is authorised and regulated by the UK Financial Conduct Authority, has issued this document. Unigestion SA authorised and regulated by the Swiss FINMA. Unigestion Asset Management (France) S.A. authorised and regulated by the French Autorité des Marchés Financiers. Unigestion Asia Pte Limited authorised and regulated by the Monetary Authority of Singapore. Performance source: Unigestion, Bloomberg, Morningstar. Performance is shown on an annualised basis unless otherwise stated and is based on Uni Global – Cross Asset Navigator RA-USD net of fees with data from 15.12.2014 to 10.06.2019.Navigator Fund Performance
Performance, net of fees
2018
2017
2016
2015
Navigator (inception 15 December 2014)
-3.6%
10.6%
4.4%
-2.2%