Liquidity Risk Eased, but the Macro Shock Will Be Profound
Paint It, Black – The Rolling Stones, 1966
March 2020 will go down in economic history in the same way as September 2008 or October 1987. It will seem like a month where each day will have felt like a year. In a situation where everything is amplified and accelerated, it is crucial to take a step back and to separate what we know and recognize from what we do not know and discover as events unfold. This two-way approach allows us to define a central scenario and to draw the so-called “tail risks”. What do we know today? At this stage of the pandemic, we know that the macroeconomic shock will be one of the largest in modern history and that financial assets will have to adjust. However, we do not know the duration or extent of the shock and thus how large this adjustment should be.

Paint It, Black

What’s Next?
March was the month of the “liquidity run”
As with every economic shock, the market correction was significant in March. Equities in developed countries (MSCI World) fell 13% over the month while those in emerging countries fell 15.6% (MSCI EM). These declines, substantial on a monthly basis, come on top of an already bearish February (between -8% and -12% depending on the country), generating one of the worst quarters in history for the equity markets. The MSCI World thus fell by 21% over the first three months of the year, the third worst quarterly return after that of the fourth quarter of 2008 (-22%) and the second quarter 1974 (-23%). Comparing March 2020 to the previous shock of this magnitude (October 2008) highlights more differences than similarities. The most distinguishing feature is the scale of the “liquidity run” witnessed in March, which could also be termed “the Great Liquidity Crisis”.
The combination of low volatility and low interest rates had led financial players to increase the leverage in their portfolios in order to maintain the same level of absolute returns as in the past, despite lower cash returns. The breakdown of S&P500 returns over the long term is a perfect illustration of the use of financial engineering since 2010. Between 1970 and 2010, total returns for US equities averaged 8.9%, quite similar to the 11.5% registered for 2010-2019. However, excess returns over cash have been substantially higher over the last decade (10.9%), compared to the previous 1970-2010 period (2.9%). This use of leverage proved to be destructive when the price of the underlying assets fell sharply, because it generated massive sales with the sole purpose of increasing liquidity within the portfolios. This in turn created a correlation shock, reducing the benefits of diversification and increasing the need to liquidate, as no defensive assets (gold, defensive FX) compensated the huge losses suffered by risky assets.
This negative feedback loop reached an unprecedented speed and scale, causing a dislocation in assets usually deemed as liquid, increasing the spread between bid and ask prices and drying up the available volumes for a given price level. Bond markets suffered a severe blow as they faced massive outflows in a very short time period. As underlined by a BIS study (https://www.bis.org/publ/bisbull02.pdf), the bond market was at the heart of this hellish chain of events. While in October 2008 the Barclays Global Treasuries gained 0.8%, that same index declined by -0.1% in March 2020. The same holds true for IG Credit bonds, with the Barclays Global Corporate index down -6% in March against -3.8% in October 2008.
Faced with the risk of a massive liquidation of all assets by all investors, central banks intervened very quickly and with much greater resources than in 2008. In the space of a few days, the Fed and the ECB increased their ability to purchase assets both in terms of balance sheet size and eligibility, thus becoming the main provider of liquidity for the government bond markets and IG credit bonds. The Fed’s balance sheet increased by more than 1500 billion dollars in only two weeks, now representing over 25% of US GDP. These measures effectively reduced liquidity risk and demonstrated that central banks would do everything to avoid adding systemic risk to an economic crisis. The stabilization of certain interbank spreads reflects a significant reduction in this risk, as does the return of our Market Stress Nowcaster indicator to less extreme levels than those observed mid-month. Having bailed out the financial markets with the so-called “Fed-put”, central banks are now the lender of last resort for the whole economy, implementing the “Helicopter Money” principle devised by M. Friedman and B. Bernanke. However, although the risk of a massive “liquidity run” seems to have abated thanks to these huge monetary interventions, the macroeconomic repercussions will be profound…
What History Tells Us about Macroeconomic Shocks
Recessions are characterised by two dimensions: their globality and their duration. Rarely in economic history has a shock paralysed the global economy at this speed and on this scale. In 2008 or 2001, some regions or sectors were only slightly affected by the financial and real estate crisis. This is not currently the case, where a majority of sectors have seen their activity fall by 50% to 90%. Historically, the shock affects a sector (petroleum in 74, technology in 2001, financial and real estate in 2007/2008) then spreads to the rest of the economy via an increase in unemployment, creating a drop in demand. These relationships take time and allow a gradual adjustment of the rest of the economy via reduced investment and production capacity. In 2007/2008, the American unemployment rate was already up by 2 points when the financial crisis hit. The peak of 10% unemployment was reached in October 2009, more than two years after the low of 4.4 % observed in April 2007. The situation is very different today as illustrated by 10 million jump in weekly jobless claims. This increase, observed in just two weeks, represents 6% of American jobs.
Historically, each recession has led to a downward adjustment in corporate profitability. On average, profit growth during recessions was between -15% and -25% depending on the period and the economic zones. Our analyses show a ratio of between 5 (during steady growth) and 7 (in a recession) between the change in GDP and the change in profits over the long term. A contraction in activity of 4 % in Europe and 3% in the United States in 2020, as indicated by our Growth Nowcasters, should lead to a significant revision in profit growth of around -25% to -30% in Europe and at least -20% in the United States. To date, analysts’ forecasts for 2020 are much more moderate, with Europe and the US expected to contract by only 8% and 5% respectively. Even if the contraction of the so-called implied earnings growth, contained in prices, shows higher figures than those of analysts, the order of magnitude is far below those observed on average during a recession.
What the markets are anticipating
One of the reasons that could explain this milder correction expected by analysts and the markets stems from the second dimension that characterises a recession: its duration. The economists’ consensus and the “current pricing” of the equity and high-yield markets anticipate a short recession, around two quarters, with a rapid return to normal (as soon as the fourth quarter of 2020). The unprecedented fiscal stimulus of around 10% of GDP for most countries involved, set up to soften the negative effects, is an important element that could support the idea of a V or U shaped recovery. This expectation of a short-term shock explains why, compared to previous contractions, the downward adjustment in equity indices and credit spreads remains much lower than for similar economic shocks. If the duration of the downturn were indeed that short, it would be unique in economic history. History shows that a “return to normal” after recession takes much longer than two quarters. For example, the ISM non-manufacturing remained more than a year below 50, the threshold designating contraction, from the end of 2008 to the end of 2009. US GDP contracted during 5 quarters between 2007 and 2009, only returning to a rate close to its potential in the last quarter of 2009. The European recession of 2011/2012 also underlines how long it can take to return to normal. European activity contracted for six consecutive quarters before rebounding in 2013.
What we think
In our view, betting on a rapid and strong recovery is a dangerous gamble. It underestimates two key elements: 1) the “spillover effects”, which are exacerbated by the increasing interdependencies between economies and sectors. If the minimum period of confinement is 6 weeks but there is an 8-week gap between the first countries to impose it and the last country affected, this significantly increases the period of inefficiency in the world economy based on trade and the mobility of goods and people. 2) Small businesses, the hidden part of the iceberg, are not represented in the global equity or credit indices. Because they do not have the same access to funding and are less diversified than large corporates, small businesses are more exposed to economic containment and shutdown.
We therefore believe that it is premature to anticipate a rapid exit from the crisis and that the economy will instantly return to its potential. Moreover, both our Nowcaster and Newscaster indicators highlight a high risk of recession. The Unigestion Growth Newscaster tracks public reporting on economic growth across the world. This indicator complements our existing Growth Nowcaster by making use of the latest technologies in alternative data. Whereas our Growth Nowcaster assesses traditional macro data, the Growth Newscaster reads a vast array of news articles and summarizes how the world evaluates the impact of any particular event on the larger economy. Historically, the duration of the recession signal provided by our indicator has been 8 months. During these periods, the average stock performance observed since 1985 was negative (on average -10 %) and the spread of high yield bonds widened on average by 250 bps.
We therefore believe that risky assets will continue to adjust downward as the deteriorating situation materializes in the macroeconomic data and corporate earnings reports. Although the risk of global liquidation was reduced by central bank intervention, macroeconomic risk management remains. The markets were driven by “liquidity risk” in March; they will be driven by “profitability risk” in the coming weeks. Pricing of a significant recession in markets is still absent. This encourages us to remain defensive and to seek only the most attractive opportunities that would directly benefit from fiscal and monetary support (e.g., US investment grade credit on the back of the Fed’s corporate bond purchasing program). Finally, we are closely monitoring liquidity in financial markets as a cash squeeze could trigger another major downturn in the markets.
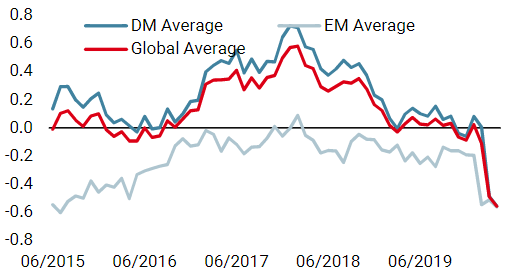
Unigestion Nowcasting
World Growth Nowcaster
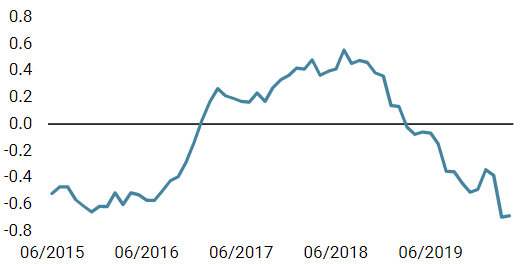
World Inflation Nowcaster
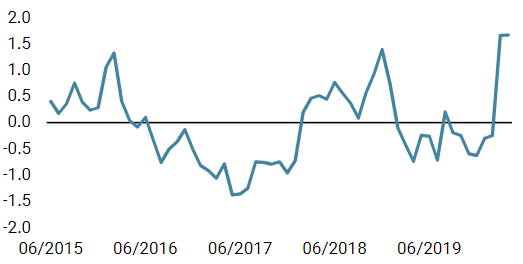
Market Stress Nowcaster
Weekly Change
- Our world Growth Nowcaster decreased again last week, as most countries declined. This week’s sharpest fall was in the Eurozone. According to our indicators, the risk of a world recession is currently very high.
- Our world Inflation Nowcaster is dropping as well, as the slowed growth mutates into undershooting inflation.
- Our Market Stress Nowcaster remains elevated but retreated marginally last week as credit spreads narrowed in the week while liquidity improved.
Sources: Unigestion. Bloomberg, as of 06 April 2020.
Important Information
This document is provided to you on a confidential basis and must not be distributed, published, reproduced or disclosed, in whole or part, to any other person.
The information and data presented in this document may discuss general market activity or industry trends but is not intended to be relied upon as a forecast, research or investment advice. It is not a financial promotion and represents no offer, solicitation or recommendation of any kind, to invest in the strategies or in the investment vehicles it refers to. Some of the investment strategies described or alluded to herein may be construed as high risk and not readily realisable investments, which may experience substantial and sudden losses including total loss of investment.
The investment views, economic and market opinions or analysis expressed in this document present Unigestion’s judgement as at the date of publication without regard to the date on which you may access the information. There is no guarantee that these views and opinions expressed will be correct nor do they purport to be a complete description of the securities, markets and developments referred to in it. All information provided here is subject to change without notice. To the extent that this report contains statements about the future, such statements are forward-looking and subject to a number of risks and uncertainties, including, but not limited to, the impact of competitive products, market acceptance risks and other risks.
Data and graphical information herein are for information only and may have been derived from third party sources. Although we believe that the information obtained from public and third party sources to be reliable, we have not independently verified it and we therefore cannot guarantee its accuracy or completeness. As a result, no representation or warranty, expressed or implied, is or will be made by Unigestion in this respect and no responsibility or liability is or will be accepted. Unless otherwise stated, source is Unigestion. Past performance is not a guide to future performance. All investments contain risks, including total loss for the investor.
Unigestion SA is authorised and regulated by the Swiss Financial Market Supervisory Authority (FINMA). Unigestion (UK) Ltd. is authorised and regulated by the UK Financial Conduct Authority (FCA) and is registered with the Securities and Exchange Commission (SEC). Unigestion Asset Management (France) S.A. is authorised and regulated by the French “Autorité des Marchés Financiers” (AMF). Unigestion Asset Management (Canada) Inc., with offices in Toronto and Montreal, is registered as a portfolio manager and/or exempt market dealer in nine provinces across Canada and also as an investment fund manager in Ontario and Quebec. Its principal regulator is the Ontario Securities Commission (OSC). Unigestion Asia Pte Limited is authorised and regulated by the Monetary Authority of Singapore (MAS). Unigestion Asset Management (Copenhagen) is co-regulated by the “Autorité des Marchés Financiers” (AMF) and the “Danish Financial Supervisory Authority” (DFSA). Unigestion Asset Management (Düsseldorf) SA is co-regulated by the “Autorité des Marchés Financiers” (AMF) and the “Bundesanstalt für Finanzdienstleistungsaufsicht” (BAFIN).