As you may know, we have communicated for the past few months our concerns regarding global growth, which had fallen considerably since the beginning of 2018, and its impact on growth-oriented assets like equities and credit. With the release last Friday that the US grew by an annual rate of 3.2% over the first quarter of this year, it is helpful to take a step back and reassess where global growth stands today. From our perspective, we are seeing signs of stabilisation around potential. While this is positive in the sense that recession risk has diminished, we do not yet see a re-acceleration of growth back to the levels seen in mid-2017 to mid-2018. For that, we have a long way to go. After slowing down significantly from its peak in early 2018, US economic growth looks to have stabilised around potential, with our US Growth Nowcaster remaining steady around neutral levels for the last three months. Indeed, most components look to be right at their potential levels, with the exception of financing conditions (comfortably above potential and similar to early 2018) and non-durable goods consumption (below potential). Last Friday’s estimate by the US Bureau of Economic Analysis that first quarter growth was 3.2% looks, at first sight, to suggest that the US economy is expanding well above its potential rate of about 2% (Congressional Budget Office estimate). However, taking a closer look at the underlying components points to supportive short-term factors that are unlikely to prove sustainable in the longer run:“LONG WAY TO GO” – Gwen Stefani and André 3000, 2004
What’s next?
While healthy, US growth was accelerated by volatile factors
- Among the largest contributors were changes in private inventories, which added 0.7% to the total. This is a fairly noisy component that reflects firms adding to their inventory stock, which can occur for a variety of reasons and is not indicative of strong demand. For example, inventories may rise because firms are expecting higher demand in the future and are stockpiling units to meet this future expected demand, or they may rise simply because current demand is low and firms are unable to sell their goods.
- Imports, which contracted by 3.7% over the quarter, were also a large positive factor and contributed 0.6% to total growth. But a contraction in imports is typically a reflection of economic slowdown as the domestic economy reduces its spending, including on the goods and services it imports from abroad. The contraction this past quarter also looks to be in part a reversal of the large pull-forward of imports in the second half of last year (when they grew by about 6% annualised) as firms tried to get ahead of the imposition of tariffs by the Trump administration.
- While personal consumption and business fixed investment continued to grow (at an annual rate of 1.2% and 1.5%, respectively), their contribution of 0.8% and 0.3% are well below their recent average levels of 1.8% and 0.7%, respectively. These two components are most closely linked to domestic demand and their cooling is noteworthy.
Looking past the short-term factors, it seems to us that the US economy grew a tad over its potential rate over the first quarter. This is a healthy pace of growth, but points to a stabilisation in growth, not a reacceleration of the expansion.

Our Eurozone Growth Nowcaster remains in negative territory, pointing to an economy expanding below potential and at risk of contracting. All components have been trending consistently downward, led by production expectations and non-durable goods consumption and, importantly, are not showing signs of stabilisation. As we have previously mentioned, Germany has not been immune to the slowdown and the recent Ifo release confirmed that the modest optimism seen for the German economy in March has evaporated. Expectations for future conditions missed consensus estimates markedly and have hovered for the last few months at levels last seen in 2012 during the sovereign debt crisis. Moreover, earlier in the month, forecasts for German growth in 2019 were slashed from 1.9% to 0.8%. Given its close trading ties to China, Germany would certainly benefit from a resurgence in Chinese growth. The end of 2018 and beginning of 2019 saw the stimulation measures enacted by Chinese policymakers flow through the economy, with financing and investment along with the housing sector seeing sharp recoveries. However, much of those impacts look to be behind us now as the housing sector is again showing signs of cooling and many other components of the economy, such as production expectations and consumption, remain below potential. Policymakers have the ability to stimulate further, but their cautiousness in light of an overly indebted private sector may prove to be more reactive than proactive to further deterioration. It is our view that global growth is likely to remain stable around potential for the next few months, though there is clear dispersion across economies. As recession risk has greatly diminished, returns of growth-oriented assets should remain positive though their risk-reward has been reduced. For credit markets, macro conditions have significantly improved, though valuations in the asset class are a challenge. For equities, we believe a cautious stance with discrimination is warranted given the divergent growth conditions, high valuations and strong year-to-date rally.Across the Atlantic, the Eurozone remains at risk
Stabilisation in growth around potential calls for selectivity

LONG WAY TO GO

Our medium-term views are fairly neutral, with selective overweights in risky assets including investment grade and emerging credit. We continue to protect the downside from an equity sell-off via options as we see challenging conditions for global equities. Over the month of April thus far, the Multi Asset Risk Target Strategy was up 0.4% versus 3.1% for the MSCI AC World Index and 0% for the Barclays Global Aggregate (USD hedged). Year-to-date, the Multi Asset Risk Target Strategy has returned 5.4% versus 15.9% for the MSCI AC World index, while the Barclays Global Aggregate (USD hedged) index is up 3.0%. * The Multi Asset Risk Targeted Strategy performance is shown in USD net of fees for the representative account of the Multi Asset Risk Targeted (Medium) USD Composite and reflects the deduction of advisory fees and brokerage commission and the reinvestment of all dividends and earnings. Past performance is not indicative of future performance. This information is presented as supplemental information only and complements the GIPS compliant presentation provided on the following page.Strategy behaviour
Performance review
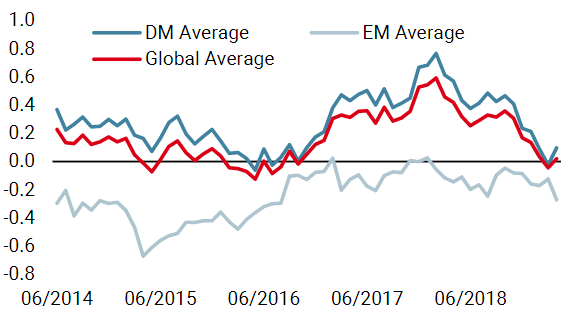
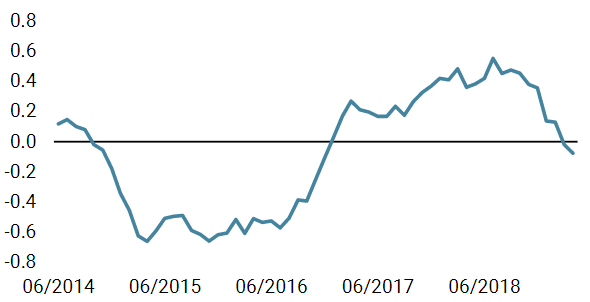
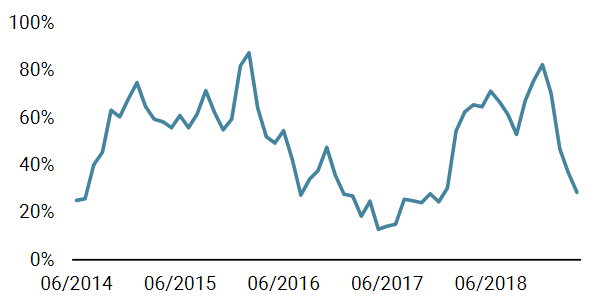
Unigestion nowcasting
World Growth Nowcaster
World Inflation Nowcaster
Market Stress Nowcaster
Weekly Change
- Our world Growth Nowcaster rose, essentially as developed market countries continued printing better macro data.
- Our world Inflation Nowcaster decreased again this week, mainly driven by lower inflation prospects in the US and in Canada.
- Market stress remained unchanged over the week.
Sources: Unigestion. Bloomberg, as of 29 April 2019.
Important Information Past performance is no guide to the future, the value of investments can fall as well as rise, there is no guarantee that your initial investment will be returned. This document has been prepared for your information only and must not be distributed, published, reproduced or disclosed by recipients to any other person. This is a promotional statement of our investment philosophy and services only in relation to the subject matter of this presentation. It constitutes neither investment advice nor recommendation. This document represents no offer, solicitation or suggestion of suitability to subscribe in the investment vehicles it refers to. Please contact your professional adviser/consultant before making an investment decision. Where possible we aim to disclose the material risks pertinent to this document, and as such these should be noted on the individual document pages. Please contact Unigestion for a complete list of all the applicable risks. Some of the investment strategies described or alluded to herein may be construed as high risk and not readily realisable investments, which may experience substantial and sudden losses including total loss of investment. These are not suitable for all types of investors. To the extent that this report contains statements about the future, such statements are forward-looking and subject to a number of risks and uncertainties, including, but not limited to, the impact of competitive products, market acceptance risks and other risks. As such, forward looking statements should not be relied upon for future returns. Data and graphical information herein are for information only and may have been derived from third party sources. Unigestion takes reasonable steps to verify, but does not guarantee, the accuracy and completeness of this information. As a result, no representation or warranty, expressed or implied, is or will be made by Unigestion in this respect and no responsibility or liability is or will be accepted. All information provided here is subject to change without notice. It should only be considered current as of the date of publication without regard to the date on which you may access the information. Rates of exchange may cause the value of investments to go up or down. An investment with Unigestion, like all investments, contains risks, including total loss for the investor. Depending on your country of residence, this document is distributed by Unigestion UK Limited, Unigestion SA, Unigestion Asset Management (France) S.A., Unigestion Asia Pte Limited or Unigestion Asset Management (Canada) Inc. Unigestion UK Limited is authorised and regulated by the UK Financial Conduct Authority (“FCA”). Unigestion UK Limited is also registered as an investment adviser with the U.S. Securities and Exchange Commission (“SEC”). Unigestion SA is authorised and regulated by the Swiss FINMA. Unigestion Asset Management (France) S.A. is authorised and regulated by the French Autorité des Marchés Financiers. Unigestion Asia Pte Limited is authorised and regulated by the Monetary Authority of Singapore. Unigestion Asset Management (Canada) Inc. is authorised and regulated by the Ontario Securities Commission. Unigestion Multi Asset Risk-Targeted (USD): 31 December 2014 to 31 December 2018 Special Disclosure: For presentations prior to 31.03.2018 the strategy was measured against the LIBOR 3M USD + 4%. Beginning April 2018 the firm determined that the benchmark did not accurately reflect the strategy mandate and the benchmark was removed. Definition of the Firm: For the purposes of applying the GIPS Standards, the firm is defined as Unigestion. Unigestion is responsible for managing assets on the behalf of institutional investors. Unigestion invests in several strategies for institutional clients: Equities, Hedge Funds, Private Assets and the solutions designed for the clients of our Cross Asset Solution department. The GIPS firm definition excludes the Fixed Income Strategy Funds, which started in January 2001 and closed in April 2008, and the accounts managed for private clients. Unigestion defines the private clients as High Net Worth Families and Individual investors. Policies: Unigestion policies for valuing portfolios, calculating performance, and preparing compliant presentations are available upon request. Composite Description: The Multi Risk Targeted (Medium) composite was defined on 15 December 2014. It consists of accounts which aim to deliver consistent smooth returns of cash + 5% gross of fees across all market conditions over a 3-year rolling period. It seeks to achieve this by capturing the upside during bull markets while protecting capital during market downturns. Benchmark: Because the composites strategy is absolute return and investments are permitted in all asset classes, no benchmark can reflect this strategy accurately. Fees: Returns are presented gross of management fees, administrative fees but net of all trading costs and withholding taxes. The maximum management fee schedule is 1.2% per annum. Net returns are net of model fees and are derived by deducting the highest applicable fee rate in effect for the respective time period from the gross returns each month. List of Composites: A list of all composite descriptions is available upon request. Minimum Account Size: The minimum account size for this composite is 5’000’000.- USD. Valuation: Valuations are computed in US dollars (USD). Performance results are reported in US dollars (USD). Internal Dispersion & 3YR Standard Deviation: The annual composite dispersion presented is an asset-weighted standard deviation calculated for the accounts in the composite the entire year. When internal dispersion is not presented it is as a result of an insufficient number of portfolios in the composite for the entire year. When the 3 Year Standard Deviation is not presented it is as a result of an insufficient period of time. Compliance Statement Unigestion claims compliance with the Global Investment Performance Standards (GIPS®) and has prepared and presented this report in compliance with the GIPS standards. Unigestion has been independently verified for the periods 1 January 2003 to 31 December 2016. The verification report(s) is/are available upon request. Verification assesses whether (1) the firm has complied with all the composite construction requirements of the GIPS standards on a firm-wide basis and (2) the firms policies and procedures are designed to calculate and present performance in compliance with the GIPS standards. Verification does not ensure the accuracy of any specific composite presentation.
Year
Composite
Return Gross
of FeesComposite Net Return
Benchmark Return
Number of Accounts
Internal Dispersion
Composite 3-Yr Std Dev
Benchmark 3-Yr Std Dev
Composite AUM (M)
Firm
AUM (M)
2015
-1.61%
-2.80%
–
1
–
–
–
127.24
15,550.31
2016
5.05%
3.79%
–
1
–
–
–
129.66
18,144.46
2017
11.16%
9.82%
–
1
–
–
–
169.51
22,340.80
2018¹
-2.91%
-4.08%
–
1
–
–
–
286.93
21,403.49