Since 1979, central banks have made concerted efforts to tame inflation across the G10 world. With strength and consistency, they have successfully reduced inflation rates from more than 10%+ p.a. to below 2% today. Mission achieved – but maybe a bit too much. For perhaps the first time in 40 years, inflation is consistently undershooting expectations, and expectations are collapsing. It is all the more puzzling that we are currently late-cycle, a period when central banks are traditionally fighting against inflation, not for it. What explains this current situation in the macro data and what are its implications in terms of market sentiment and valuation? Overall, we think this situation is supportive for carry-yielding assets and strategies. The underlying question is one we have already raised in these weekly updates: are we lost in Japan and how can we adapt our portfolios to this situation? Inflation has fallen short of central bank targets for some time now. Most of them target a 2% long-term inflation goal but since 2016, it has not worked well. In the Eurozone, core inflation (inflation ex cyclical elements) has increased at around 1% p.a. over the period. In the US, things look more encouraging. US core inflation has been hovering around 2% but, when crunching the numbers, a similar situation to the rest of the world appears: a large portion of the current US core inflation rate (2.4%) comes from the cost of health care and the fact that shelter is included. Net of both these sources of inflation, US core inflation falls back to 2.1%: not a high number given the fact that we are late-cycle. A similar case can be made in Canada, Sweden, Norway, Switzerland – and of course Japan. In late-cycle 2006-2007, these numbers were much higher: what is missing today?“Lost in Japan” – Shawn Mendes, 2018
What’s Next?
Macro: The Root of Undershooting Inflation
First things first, economic theory predicts that the longer-run growth rate of prices should be strongly tied to that of wages. What is happening there? In the Eurozone, the growth rate of wages from 2011 to 2018 has been roughly 1.5%: it’s hard to see inflation reaching higher values. This increased recently, with June numbers rising up to 2.7%, pointing to the possibility of stabilising inflation. In the US, wage growth currently sits around 3.5% for now, following the Atlanta Fed survey. This is not low, but is still lower than where we were in 2006-2007 (above 4%). In Canada, wages have been growing by 4.5% since 2017, still lower than the 6% observed in 2006-2007. The wage situation is therefore still supportive of an above 1% inflation across the G10 world, but lower than the previous cycle. This explains only a small portion of the current situation.
The missing piece of the low inflation puzzle is probably to be found elsewhere. Demand since the 2008 crisis has grown at a slower-than-usual pace. According to IMF data, between 2006-2007, the world’s GDP grew by an average rate of 5.5% with investment growing by 10%. Over the recent period, these numbers fell to 3.5% and 7%, respectively: clearly, investment but also consumption has slowed.
This has had two key consequences: first, it has led to a slower growth rate in commodity prices. The seasoned investor will remember when oil peaked in 2007 at above USD 140 per barrel compared to recent highs of just USD 75 per barrel. A similar case can be made with most commodities. They are not included in core inflation, but when prices increase for a long enough period, they eventually contaminate core inflation indices by pushing other products’ prices higher. The second consequence is that, with weaker demand, it becomes harder for companies to flow increased production costs to the consumer. In the US, over the 1990-2006 period, the CPI to PPI ratio grew by 1.2% but, since 2008, this ratio has remained stable: the “pricing power” of companies has clearly collapsed. This roots the lower inflation issue in slow economic growth. However, other structural sources of low inflation should be listed here, such as the impact of an ageing population, the combination of globalisation and deindustrialisation weighing on wages and pricing power, while services are gaining a larger share in the value created at the expense of industry. Recently, our Inflation Nowcasters have been signalling potentially negative inflation surprises. Low inflation situation is therefore an essential element for us now.
Sentiment and Valuation: Be Selective in Your Carry Strategies
From an investment perspective, it is essential to understand how low inflation affects market sentiment and asset valuations. First, in terms of sentiment, we think this low inflation surprise situation means that central banks should lean on the dovish side for longer. The recent moves from both the ECB and the Fed mean, in our view, that sentiment towards carry-related assets and strategies should remain positive. The quest for yield triggered by quantitative easing is here to stay in our view¸ at least in the Eurozone where it should persist for longer. This low inflation situation is likely to maintain an environment for which sentiment towards carry-related assets should remain positive.
Which assets will benefit from this positive sentiment? To answer this question we think comparing carry across risk premia from a cross-sectional (which risk premia yields the highest carry for a given unit of risk) and a time-series perspective (which risk premia yields the highest carry compared to its own history) makes a lot of sense today. Such an analysis finds that both investment grade and high yield credit look attractive today: they deliver an attractive carry while also being potentially the target of a central bank buying frenzy should the macro cycle deteriorate. We also think that carry strategies such as bonds carry and dividend carry are attractive for similar reasons: their carry looks appealing by historical and cross-asset comparison. We think that screening sentiment and valuations (the flip side of the carry coin) is essential to harness the potential impact of the lower inflation situation.

Asset Allocation: Go Carry Go!
Inflation should remain largely under control while showing periods of undershoot. Central banks are worried about the ‘Japanisation’ of their respective economies and they will fight against it using all available tools. In the end, the only mistake Japan made was to hesitate. This, in our view, is likely to bolster sentiment towards carry strategies, especially for the strategies with the highest carry. We are currently overweight investment grade, high yield, bonds carry and dividend carry for these reasons. The fear of getting “lost in Japan” can mean opportunities for investors, but also threats: be selective with the carry you invest in, as they can also become value traps. VIX carry strategies in 2018 were a remarkable example of that. Being dynamic is essential, in our view: we keep a wary eye on both sentiment and valuation to avoid exaggerations.

Lost in Japan

Our medium-term view is more constructive, as we are still overweight growth assets and underweight real assets. Given the current cost of hedging, we are using forex-based strategy exposures to hedge ourselves against adverse market conditions. Over the month of September, the Multi Asset Risk Targeted Strategy gained 0.78% versus 1.92% for the MSCI AC World index and -0.47% for the Barclays Global Aggregate (USD hedged). Year-to-date, the Multi Asset Risk Targeted Strategy has returned 9.98% versus 15.99% for the MSCI AC World index, while the Barclays Global Aggregate (USD hedged) index is up 8.75%. * The Multi Asset Risk Targeted Strategy performance is shown in USD net of fees for the representative account of the Multi Asset Risk Targeted (Medium) USD Composite and reflects the deduction of advisory fees and brokerage commission and the reinvestment of all dividends and earnings. Past performance is not indicative of future performance. This information is presented as supplemental information only and complements the GIPS compliant presentation provided on the following page.Strategy Behaviour
Performance Review
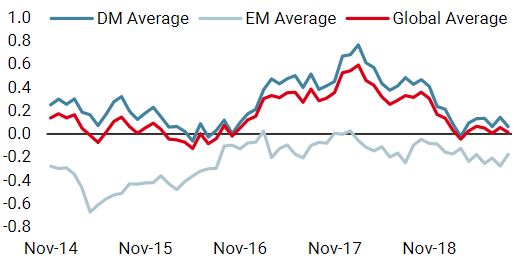
Unigestion Nowcasting
World Growth Nowcaster
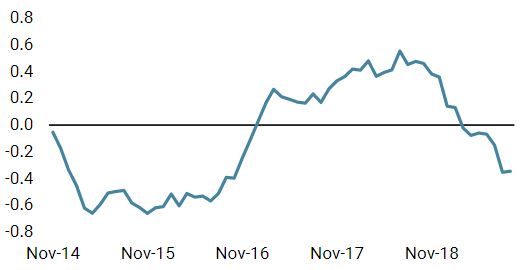
World Inflation Nowcaster
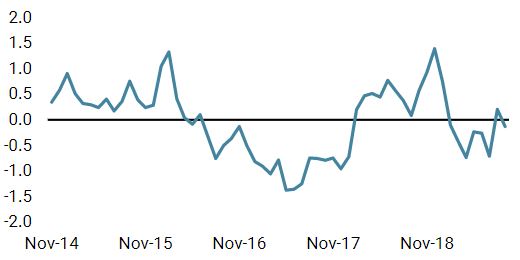
Market Stress Nowcaster
Weekly Change
- Our world Growth Nowcaster marginally increased last week, essentially driven by stronger US data.
- Our world Inflation Nowcaster continued to stabilise last week, after a long period of decline.
- Market stress increased last week as volatility rose.
Sources: Unigestion. Bloomberg, as of 30 September 2019.
Important Information
Past performance is no guide to the future, the value of investments can fall as well as rise, there is no guarantee that your initial investment will be returned. This document has been prepared for your information only and must not be distributed, published, reproduced or disclosed by recipients to any other person. This is a promotional statement of our investment philosophy and services only in relation to the subject matter of this presentation. It constitutes neither investment advice nor recommendation. This document represents no offer, solicitation or suggestion of suitability to subscribe in the investment vehicles it refers to. Please contact your professional adviser/consultant before making an investment decision. Where possible we aim to disclose the material risks pertinent to this document, and as such these should be noted on the individual document pages. Please contact Unigestion for a complete list of all the applicable risks. Some of the investment strategies described or alluded to herein may be construed as high risk and not readily realisable investments, which may experience substantial and sudden losses including total loss of investment. These are not suitable for all types of investors. To the extent that this report contains statements about the future, such statements are forward-looking and subject to a number of risks and uncertainties, including, but not limited to, the impact of competitive products, market acceptance risks and other risks. As such, forward looking statements should not be relied upon for future returns. Data and graphical information herein are for information only and may have been derived from third party sources. Unigestion takes reasonable steps to verify, but does not guarantee, the accuracy and completeness of this information. As a result, no representation or warranty, expressed or implied, is or will be made by Unigestion in this respect and no responsibility or liability is or will be accepted. All information provided here is subject to change without notice. It should only be considered current as of the date of publication without regard to the date on which you may access the information. Rates of exchange may cause the value of investments to go up or down. An investment with Unigestion, like all investments, contains risks, including total loss for the investor.
This information is issued by Unigestion (UK) Ltd (“Unigestion”), which is authorised and regulated by the UK Financial Conduct Authority (“FCA”). Unigestion is also registered as an investment adviser with the U.S. Securities and Exchange Commission (“SEC”). This information is intended only for professional clients, institutional clients and eligible counterparties, as defined by the FCA, and qualified purchasers as defined by the SEC and has therefore not been adapted to retail clients.
Unigestion Multi Asset Risk-Targeted (USD): 31 December 2014 to 30 June 2019
| Year | Composite Return Gross of Fees |
Composite Net Return | Benchmark Return | Number of Accounts | Internal Dispersion | Composite 3-Yr Std Dev | Benchmark 3-Yr Std Dev | Composite AUM (M) | Firm AUM (M) |
| 2015 | -1.61% | -2.80% | – | 1 | – | – | – | 127.24 | 15,550.31 |
| 2016 | 5.05% | 3.79% | – | 1 | – | – | – | 129.66 | 18,144.46 |
| 2017 | 11.16% | 9.82% | – | 1 | – | – | – | 169.51 | 22,340.80 |
| 2018 | -2.91% | -4.08% | – | 1 | – | – | – | 286.93 | 21,403.49 |
| 20191 | 7.45% | 6.80% | – | 1 | – | – | – | 364.46 | 21,692.55 |
1: This year is incomplete, it stops in June.
Special Disclosure: For presentations prior to 31.03.2018 the strategy was measured against the LIBOR 3M USD + 4%. Beginning April 2018 the firm determined that the benchmark did not accurately reflect the strategy mandate and the benchmark was removed. Definition of the Firm: For the purposes of applying the GIPS Standards, the firm is defined as Unigestion. Unigestion is responsible for managing assets on the behalf of institutional investors. Unigestion invests in several strategies for institutional clients: Equities, Hedge Funds, Private Assets and the solutions designed for the clients of our Cross Asset Solution department. The GIPS firm definition excludes the Fixed Income Strategy Funds, which started in January 2001 and closed in April 2008, and the accounts managed for private clients. Unigestion defines the private clients as High Net Worth Families and Individual investors. Policies: Unigestion policies for valuing portfolios, calculating performance, and preparing compliant presentations are available upon request. Composite Description: The Multi Risk Targeted (Medium) composite was defined on 15 December 2014. It consists of accounts which aim to deliver consistent smooth returns of cash + 5% gross of fees across all market conditions over a 3-year rolling period. It seeks to achieve this by capturing the upside during bull markets while protecting capital during market downturns. Benchmark: Because the composites strategy is absolute return and investments are permitted in all asset classes, no benchmark can reflect this strategy accurately. Fees: Returns are presented gross of management fees, administrative fees but net of all trading costs and withholding taxes. The maximum management fee schedule is 1.2% per annum. Net returns are net of model fees and are derived by deducting the highest applicable fee rate in effect for the respective time period from the gross returns each month. List of Composites: A list of all composite descriptions is available upon request. Minimum Account Size: The minimum account size for this composite is 5’000’000.- USD. Valuation: Valuations are computed in US dollars (USD). Performance results are reported in US dollars (USD). Internal Dispersion & 3YR Standard Deviation: The annual composite dispersion presented is an asset-weighted standard deviation calculated for the accounts in the composite the entire year. When internal dispersion is not presented it is as a result of an insufficient number of portfolios in the composite for the entire year. When the 3 Year Standard Deviation is not presented it is as a result of an insufficient period of time. Compliance Statement Unigestion claims compliance with the Global Investment Performance Standards(GIPS®) and has prepared and presented this report in compliance with the GIPS standards. Unigestion has been independently verified for the periods 1 January 2003 to 31 December 2016. The verification report(s) is/are available upon request. Verification assesses whether (1) the firm has complied with all the composite construction requirements of the GIPS standards on a firm-wide basis and(2) the firms policies and procedures are designed to calculate and present performance in compliance with the GIPS standards. Verification does not ensure the accuracy of any specific composite presentation.