Welcome to uncharted territory. A combination of rising recession fears and trade war concerns have pushed sovereign bonds yields to new lows in August. Over the month, most safe haven assets performed very well, reflecting a change in market sentiment. If the current US yield curve is really heralding a recession, it would be the first to begin at a time when nominal bond yields are so low and central banks have such limited ammunition to smooth the negative impact. What does this situation mean for asset allocation? As usual, August was a volatile month. Tweets from the US President prompted new tariff increases, risky assets suffered and safe haven ones posted positive returns. Over the month, global equities declined, with the MSCI World and MSCI Emerging Markets indices falling -2.4% and -5.1%, respectively. Emerging currencies also fell: -8.7% for BRL, -7.3% for ZAR, -5.6% for MXN and -3.9% for CNH versus the greenback. Energy prices followed growth-oriented assets with a decline of -5.7% for the Bloomberg Energy index. Rising uncertainties about the global economy and the extent of the trade war pushed risk aversion higher with a sharp rise in both realised and implied equity volatility. As a result, sovereign bonds, gold and safe currencies performed well. In August, sovereign bond yields reached a record low and the Barclays Global Treasuries USD hedged index posted one of the best monthly returns ever (2.6%), similar to those seen in November 2008. In terms of style, unsurprisingly, Low Volatility, Momentum and Quality factors outperformed Value and Size. How should we interpret these performances? Is it a new market stress episode, amplified by poor liquidity, stretched valuations ahead of earning seasons and high expectations around monetary easing? Does it reflect a new deterioration in the economic cycle as indicated by the inverse US yield curve? In this challenging macroeconomic scenario, it is essential to dissociate noise from fundamentals, short term from long term, and expectations from surprises. To do this, we allocate risk dynamically by monitoring the three main factors that drive asset return over the medium term: 1) macroeconomic factors (economic cycle and inflation), 2) market sentiment and 3) valuation. Where are we currently and what has changed over the last twelve months? According to our Nowcasters that track in real time a large spectrum of macroeconomic data covering all economic sectors and most emerging and developed countries, risk of recession is neutral and risk of inflation surprise is very low. Compared to a year ago, the economic environment has clearly deteriorated. Nevertheless, the trend is much more alarming on the inflation front than on the activity side. Over the last twelve months, our Global GDP Nowcaster declined from 0.33 to 0, while our Global Inflation Nowcaster fell from 0.45 to -0.3. In our view, investors should be more worried about returning deflation risk and its consequences than a sharp economic downturn. Below-target inflation is the main reason why central banks have turned from normalisation to easing mode over the period. While major central banks have already cut, or will cut, their rates in 2019, we consider that this monetary policy shift has more than offset the deterioration in the economic cycle. It also explains why risky assets and safe assets have delivered extraordinary returns this year. Regarding valuations, lower bond yields have dramatically changed asset rankings. One year ago, most assets were attractive except real assets. Today, sovereign bonds and real assets are now extremely expensive while growth-oriented assets look fairly priced. Regarding market sentiment, one year ago, positioning in global equities was close to extreme, momentum supportive for risky assets and risk aversion tracked by our Market Stress Nowcaster a bit muted. As a result, leverage and risk concentration was high ahead of the October 2018 market turmoil. Today, positioning seems safer as exposure to growth-oriented assets has been reduced. Nevertheless, uncertainty has increased, mainly driven by geopolitical tensions: higher tariffs and political instability in the UK, Iran, Hong Kong and Italy. Overall, in our view, the current situation looks like 2016 when global growth was slowing following the Chinese downturn, raising questions about risk of a US recession and the sustainability of the economic cycle. Deflation risk was rising, mainly in Europe. Market sentiment remained fragile, led by a sharp decline in energy prices and weakness in the commodities complex. At this time, the Fed had delayed its normalisation from March to December 2016 and China had deployed stimulus to support its economy. Consequently, emerging countries recovered, followed by Europe. At the end, the global economic cycle was saved and growth continued for some years. We do not believe the current economic cycle will extend by several years. Nevertheless, we estimate that the concerns about upcoming recession triggered by the inverted yield curve in some countries are overstated and overestimate the risk of economic downturn in the short term. Therefore, we continue to overweight risky assets with some hedges rather than cut the overall risk of the portfolio by increasing cash exposure.“Lost In Translation” – Logic, 2019
What’s Next?
‘Flight to quality’ month
A lot can change in 12 months
Back to 2016?

Since the financial crisis, we have been in a ‘new normal’ era, called ‘secular stagnation. Although the causes are a source of debate, the current environment is characterised by low global growth and muted inflation pressure with rising deflation risk in some developed countries. Japan has experienced this economic context for more than twenty years. Over the period (2000-2019), the Barclays Global Aggregate Japan index has delivered an annualised performance of 2% with a 2.2% realised volatility, more attractive than Japanese equities that delivered higher annualised performance (2.9%) but with much higher risk (19% realised volatility). One lesson we should learn from Japan in order to be ready for the ‘Great Japanisation’ is that, despite very low or negative yields, the total return performance of sovereign bonds has remained positive and provided an attractive Sharpe ratio. This could be counterintuitive but helpful to know to avoid being “lost in translation” in the future and in uncharted territory.Welcome to the “Great Japanisation”

Lost in translation

Our medium-term view is currently more constructive, as we are still overweight growth assets and underweight real assets. We are also complementing our exposures with options to protect the portfolio in the case of equity drawdowns. Over the month of August, the Multi Asset Risk Targeted Strategy gained 0.6% versus -2.4% for the MSCI AC World index and 2.2% for the Barclays Global Aggregate (USD hedged). Year-to-date, the Multi Asset Risk Targeted Strategy has returned 9.0% versus 13.8% for the MSCI AC World index, while the Barclays Global Aggregate (USD hedged) index is up 9.3%. * The Multi Asset Risk Targeted Strategy performance is shown in USD net of fees for the representative account of the Multi Asset Risk Targeted (Medium) USD Composite and reflects the deduction of advisory fees and brokerage commission and the reinvestment of all dividends and earnings. Past performance is not indicative of future performance. This information is presented as supplemental information only and complements the GIPS compliant presentation provided on the following page.Strategy Behaviour
Performance Review
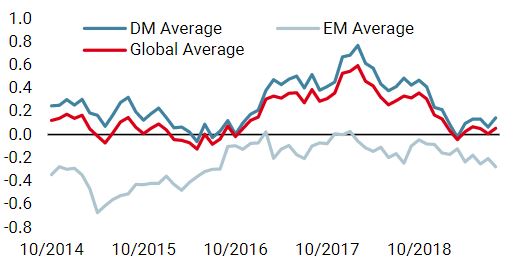
Unigestion Nowcasting
World Growth Nowcaster
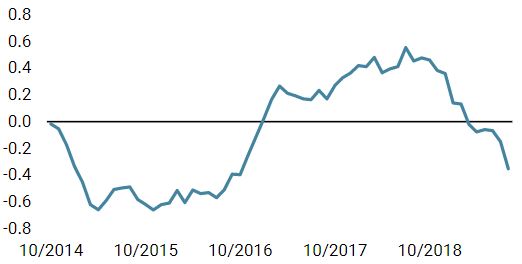
World Inflation Nowcaster
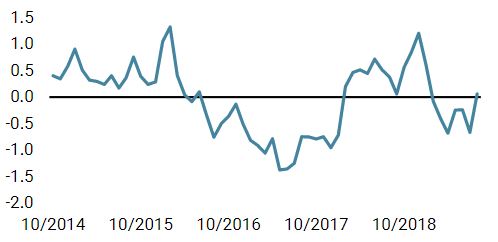
Market Stress Nowcaster
Weekly Change
- Our world Growth Nowcaster increased for the first time in a long time as most developed economies published improving data.
- Our world Inflation Nowcaster declined again last week, mainly driven by softer inflation-related data in the US and the Eurozone.
- Market stress decreased last week, as volatility and credit spreads decreased.
Sources: Unigestion. Bloomberg, as of 02 September 2019.
Important Information
Past performance is no guide to the future, the value of investments can fall as well as rise, there is no guarantee that your initial investment will be returned. This document has been prepared for your information only and must not be distributed, published, reproduced or disclosed by recipients to any other person. This is a promotional statement of our investment philosophy and services only in relation to the subject matter of this presentation. It constitutes neither investment advice nor recommendation. This document represents no offer, solicitation or suggestion of suitability to subscribe in the investment vehicles it refers to. Please contact your professional adviser/consultant before making an investment decision. Where possible we aim to disclose the material risks pertinent to this document, and as such these should be noted on the individual document pages. Please contact Unigestion for a complete list of all the applicable risks. Some of the investment strategies described or alluded to herein may be construed as high risk and not readily realisable investments, which may experience substantial and sudden losses including total loss of investment. These are not suitable for all types of investors. To the extent that this report contains statements about the future, such statements are forward-looking and subject to a number of risks and uncertainties, including, but not limited to, the impact of competitive products, market acceptance risks and other risks. As such, forward looking statements should not be relied upon for future returns. Data and graphical information herein are for information only and may have been derived from third party sources. Unigestion takes reasonable steps to verify, but does not guarantee, the accuracy and completeness of this information. As a result, no representation or warranty, expressed or implied, is or will be made by Unigestion in this respect and no responsibility or liability is or will be accepted. All information provided here is subject to change without notice. It should only be considered current as of the date of publication without regard to the date on which you may access the information. Rates of exchange may cause the value of investments to go up or down. An investment with Unigestion, like all investments, contains risks, including total loss for the investor.
This information is issued by Unigestion (UK) Ltd (“Unigestion”), which is authorised and regulated by the UK Financial Conduct Authority (“FCA”). Unigestion is also registered as an investment adviser with the U.S. Securities and Exchange Commission (“SEC”). This information is intended only for professional clients, institutional clients and eligible counterparties, as defined by the FCA, and qualified purchasers as defined by the SEC and has therefore not been adapted to retail clients.
Unigestion Multi Asset Risk-Targeted (USD): 31 December 2014 to 30 June 2019
| Year | Composite Return Gross of Fees |
Composite Net Return | Benchmark Return | Number of Accounts | Internal Dispersion | Composite 3-Yr Std Dev | Benchmark 3-Yr Std Dev | Composite AUM (M) | Firm AUM (M) |
| 2015 | -1.61% | -2.80% | – | 1 | – | – | – | 127.24 | 15,550.31 |
| 2016 | 5.05% | 3.79% | – | 1 | – | – | – | 129.66 | 18,144.46 |
| 2017 | 11.16% | 9.82% | – | 1 | – | – | – | 169.51 | 22,340.80 |
| 2018 | -2.91% | -4.08% | – | 1 | – | – | – | 286.93 | 21,403.49 |
| 20191 | 7.45% | 6.80% | – | 1 | – | – | – | 364.46 | 21,692.55 |
1: This year is incomplete, it stops in June.
Special Disclosure: For presentations prior to 31.03.2018 the strategy was measured against the LIBOR 3M USD + 4%. Beginning April 2018 the firm determined that the benchmark did not accurately reflect the strategy mandate and the benchmark was removed. Definition of the Firm: For the purposes of applying the GIPS Standards, the firm is defined as Unigestion. Unigestion is responsible for managing assets on the behalf of institutional investors. Unigestion invests in several strategies for institutional clients: Equities, Hedge Funds, Private Assets and the solutions designed for the clients of our Cross Asset Solution department. The GIPS firm definition excludes the Fixed Income Strategy Funds, which started in January 2001 and closed in April 2008, and the accounts managed for private clients. Unigestion defines the private clients as High Net Worth Families and Individual investors. Policies: Unigestion policies for valuing portfolios, calculating performance, and preparing compliant presentations are available upon request. Composite Description: The Multi Risk Targeted (Medium) composite was defined on 15 December 2014. It consists of accounts which aim to deliver consistent smooth returns of cash + 5% gross of fees across all market conditions over a 3-year rolling period. It seeks to achieve this by capturing the upside during bull markets while protecting capital during market downturns. Benchmark: Because the composites strategy is absolute return and investments are permitted in all asset classes, no benchmark can reflect this strategy accurately. Fees: Returns are presented gross of management fees, administrative fees but net of all trading costs and withholding taxes. The maximum management fee schedule is 1.2% per annum. Net returns are net of model fees and are derived by deducting the highest applicable fee rate in effect for the respective time period from the gross returns each month. List of Composites: A list of all composite descriptions is available upon request. Minimum Account Size: The minimum account size for this composite is 5’000’000.- USD. Valuation: Valuations are computed in US dollars (USD). Performance results are reported in US dollars (USD). Internal Dispersion & 3YR Standard Deviation: The annual composite dispersion presented is an asset-weighted standard deviation calculated for the accounts in the composite the entire year. When internal dispersion is not presented it is as a result of an insufficient number of portfolios in the composite for the entire year. When the 3 Year Standard Deviation is not presented it is as a result of an insufficient period of time. Compliance Statement Unigestion claims compliance with the Global Investment Performance Standards(GIPS®) and has prepared and presented this report in compliance with the GIPS standards. Unigestion has been independently verified for the periods 1 January 2003 to 31 December 2016. The verification report(s) is/are available upon request. Verification assesses whether (1) the firm has complied with all the composite construction requirements of the GIPS standards on a firm-wide basis and(2) the firms policies and procedures are designed to calculate and present performance in compliance with the GIPS standards. Verification does not ensure the accuracy of any specific composite presentation.