Overview
In this paper we show how machine learning can be used to successfully enhance the performance of risk-managed portfolios. At Unigestion, our risk-managed portfolios are based on a variance minimisation process applied to a given stock universe that is typically pre-filtered to exclude securities with unsuitable characteristics such as extreme valuations, low quality or high leverage.
In this paper, we present four major findings:
- Fundamental parametric filters can be improved by machine learning filters that use a large set of stock characteristics and provide an overall ranking for a stock rather than focusing on the level of each characteristic individually.
- Using machine learning filters to better exclude stocks with large tail risks in the portfolio construction process results in superior out-of-sample properties after accounting for transaction costs.
- Machine learning is not a ’black box’ since the use of variable importance measures allows us to explain which variables are selected by the algorithms at different points in time.
- Tree-based models applied with regularisation, cross-validation and ensemble methods help to uncover complex non-linear relationships and interactions and overcome the over-fitting problem.
The paper is structured as follows: Section 1 provides a brief review of the recent and relevant academic and industry literature on machine learning to forecast asset returns and risk. Section 2 describes the portfolio construction process and data. In section 3 we report the empirical findings with regard to out-of-sample forecasts. Section 4 then shows that the machine learning model is not a black box and explains which variables account for the majority of the predictability. Section 5 documents the out-of-sample backtests and the improvement in the performance of low risk portfolios under realistic transaction cost assumptions. Finally, section 6 concludes.
1. Machine Learning to Forecast Asset Returns and Risk
Several recent papers have applied machine learning algorithms to the forecasting of security returns. Gu, Kelly and Xiu (2020) show that machine learning algorithms, and neural networks in particular, lead to better out-of-sample predictability than linear models when applied to a large set of stock characteristics. In a recent publication by members of the Unigestion quantitative research team, Adell et al (2020) find that machine learning algorithms can be used to improve stock risk forecasts and the out-of-sample forecasts of equity betas in particular. Machine learning algorithms have also been applied to government bond return predictability. Bianchi et al (2020) find that machine learning methods provide strong statistical evidence in favour of bond return predictability. Feng et al (2020) confirm that the predictability of bond returns using machine learning remains significant when allowing for real-time macro information.
In a recent paper Bali et al (2020) extend the work to corporate bonds and found that machine learning methods substantially improve the out-of-sample predictive power of bond returns compared to traditional linear regression models. In recent Unigestion research papers, Fontanille et al (2020) apply machine learning to create superior fund of hedge fund portfolios while Sigrist and Perfetto (2019) describe a machine learning based private equity fund scoring tool that is used to predict which funds will be successful. We build on this literature and examine whether machine learning methods, and tree-based methods in particular, can be used to filter out stocks that are forecast to have the lowest returns in the universe, thus improving the risk-return relationship of low risk portfolios.
2. Incorporating Machine Learning into Low Risk Portfolio Construction
The low risk portfolio construction process at Unigestion contains three main steps as illustrated in Figure 1. A broad investment universe is filtered using (1) bottom-up screening, (2) top-down risk identification and (3) fundamental review steps. The first step is systematic and relied historically on excluding stocks with undesirable characteristics such as poor liquidity balance sheet weaknesses or other variables indicative of unattractive risk properties.

Following a comprehensive review, we selected 70 predictors to see if they can be used to identify stocks that will suffer the lowest returns in the universe.

Following a comprehensive review of the academic and industry literature which identified more than 200 stock return predictors or anomalies, we selected a subset of around 70 predictors in addition to 24 GICS Level 2 dummies to study if they can be used to predict which stocks would have the lowest return in the universe over the next 12 months.
Figure 1: The Low Risk Investment Process
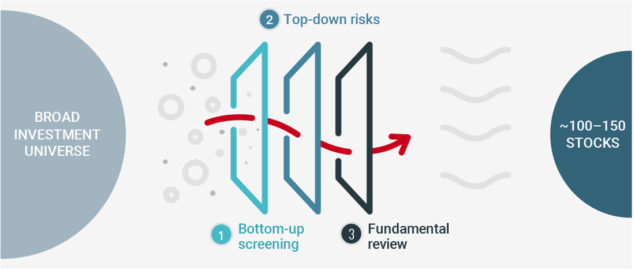
Source: Unigestion.
The reason for the 12 month horizon is due to our focus on long-term risks and to avoid excessive turnover from short-term signals. This long-term focus is different from some of the studies cited above which tend to focus on shorter-term predictability. To form our forecasts, we use stock returns (response variables) and characteristics (features) at monthly frequency from 1999 to 2019. The results are presented for a US stock universe of around 1,500 stocks. Results for other stock universes, such as Europe or the emerging markets, are available on request.
The 70 features that we used can be grouped into the following categories: Momentum (12m, 6m, 3m), Quality (accounting quality, efficiency, growth, investment, profitability, solvency), Value, Risk, Size, Liquidity, Sentiment, Technical and GICS (as dummies). Both features and response variables are rank transformed on a crosssectional basis.
3. Out-of-Sample Forecasting
One of the choices that need to be made in any forecasting exercise is how much one looks back into the past to predict the future. We train our machine learning models separately using rolling and expanding 10 year windows and we also produce an ensemble of the two forecasts. There is a trade-off between using an expanding or a rolling window. An algorithm based on a rolling window looks for factor combinations that have worked well in a more recent period. An expanding window accounts for different macroeconomic cycles, but may fail to capture the recent dynamics. Our results show that a combination of a rolling and expanding window performs particularly well. The data is split into training, validation and test periods which are each separated by a buffer period. Figure 2 illustrates this in the case of an expanding window.
Figure 2: Illustration of the Training, Validation and Testing Periods with an Expanding Window
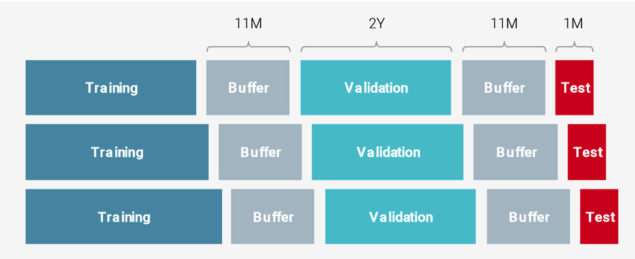
Source: Unigestion.
Before applying the machine learning filters to risk-managed portfolios, we first document the ability of non-linear models to improve forecasts compared to linear forecasts. The forecasts are evaluated by means of the out-of-sample correlation which captures the cross-sectional correlation between the forecasted crosssectional rank of a given stock and its actual rank. The machine learning algorithm that we apply is called Random Forest (RF). RF are an ensemble learning technique for regression that is based on constructing a multitude of decision trees at training time and generating the average prediction of the individual trees. One of the advantages of RF is the ability to correct for decision trees’ habit of overfitting to their training set. Breiman (2001) provides an excellent introduction to RF.
The machine learning algorithm we apply is Random Forest, which helps correct decision trees’ habit of overfitting to their training set.
Figure 3 illustrates that RF models outperform linear (OLS) models, in particular when used with a rolling window. The linear model is a simple linear predictive regression that uses all the features. Figure 3 shows that the average out-of-sample correlation doubles when using a rolling 10 year window RF algorithm to forecast returns compared to a linear OLS expanding window forecast.
Figure 3: Average Out-of-Sample Correlation across Models
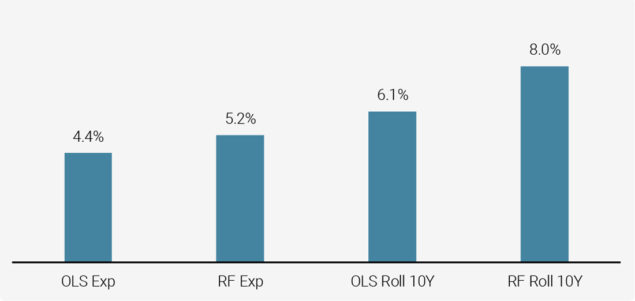
Source: S&P Global, Unigestion. Data as at June 2020.
This chart shows the average correlation between the true realised returns and forecasts. The chart is based on the period from Dec 2009 to Mar 2019.
To study how robust the out-of-sample performance of the RF model is over time, in Figure 4 we plot the out-of-sample correlation of the different models from 2009 to 2019. As we can see from the red line, the tree-based RF model typically outperforms the competitor models with only a few exceptions such as the end of 2011.
Our results show that a combination of a rolling and expanding window performs particularly well.
Figure 4: Out-of-Sample Correlation over Time
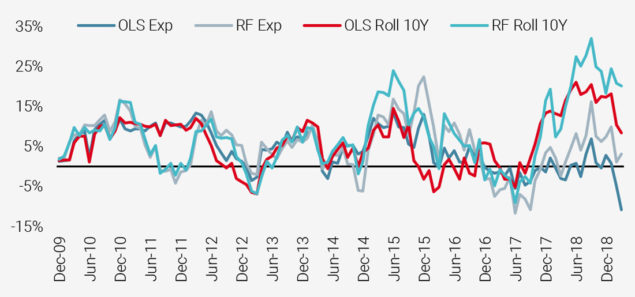
Source: S&P Global, Unigestion.
Data as at June 2020. Based on the period from Dec 2009 to Mar 2019. This chart shows the correlation between the true realised returns and forecasts.
To assess the economic value of the predictability in stock returns that we document, we first report the performance of spread portfolios that are formed by going long each month the stocks that are forecasted to be in the top quintile and short the stocks that are forecasted to be in the bottom quintile based on their rank. Figure 5 reports the resulting Sharpe Ratio. The Sharpe Ratio for the ensemble model is the highest of all models except the single characteristic momentum model. Of course, the drawdown characteristics of the momentum factor are very different from that of the ensemble model as the momentum factor experiences large occasional drawdowns.
Figure 5: Average Annualised Sharpe Ratio of Long-Short Quintile Spread
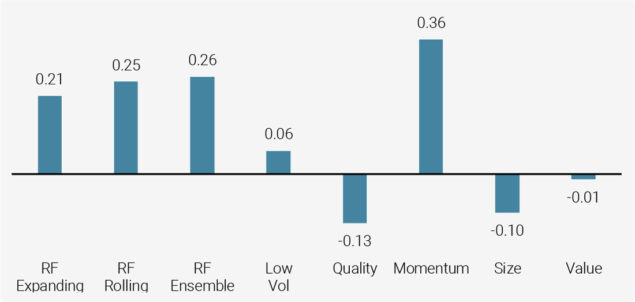
Source: S&P Global, Unigestion. Data as at June 2020.
Average annualised performance based on the period from Dec 2009 to Mar 2020. The low vol factor is not beta adjusted.
4. Not a Black Box
After reviewing the superior forecasting performance of the RF model in Section 3, it is natural to ask what the drivers of this performance are. A range of statistical measures are available to shed light on this. Machine learning models, therefore, should not be interpreted as a black box. Figure 6 illustrates this point and shows the variable importance based on the so called gain measure. We see that similar variables such as EBITDA to Enterprise Value and EPS are important independent of whether one chooses a rolling or expanding window, but that there is also some variation in the variable importance. This can be attributed to how quickly the model ‘forgets’ the historical relationships. Such variable importance is economically meaningful and reassuring since it confirms that several of the variables are related to valuation type metrics but also to liquidity and quality stock level characteristics.
With a range of statistical measures available to analyse the performance of machine learning models, they should not be thought of as a black box.
Figure 6: Variable Importance
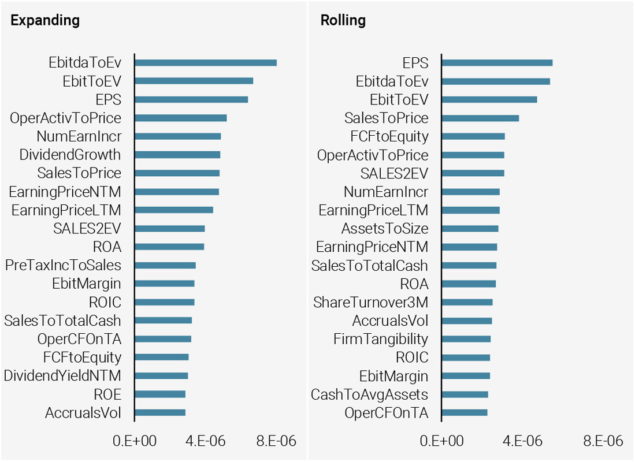
Source: S&P Global, Unigestion. Data as at June 2020.
Based on the period from Dec 2009 to Mar 2020. This chart shows the variable importance. The importance of Random Forest is computed using gain method which equals to the decrease in loss function accounting for all splits produced by a feature.
There are alternatives to using the gain method such as the Shapley value. In a related publication by members of the Unigestion Equities team (Adell et al (2020)), we show how the Shapley value can provide additional insights about the sign and strength of the predictive relationship between the feature and the response variable.
5. Impact on Out-of-Sample Low Risk Portfolio
Although the superior forecast performance documented above is insightful and promising, we need to examine its impact when constructing risk-managed portfolios. Historically, we have been using parametric thresholds to filter out stocks with unfavourable fundamental characteristics. One of the advantages of using the machine learning approach is that it can, in principle, reduce turnover and transaction costs relative to parametric filters that treat each fundamental variable separately. The RF method allows us to optimally combine the information in multiple features and form a single forecast based on the resulting signal.
One of the advantages of using the machine learning approach is that it can, in principle, reduce turnover and transaction costs.
However, the implementation of the machine learning filter has to be done with care since simply filtering out all stocks in the bottom quintile each month would generate excessive turnover. Our research has shown that restricting the maximum allowed weights of stocks in the bottom 5% to 15% group and excluding the worst 5% of stocks generates the most attractive return profile after transaction costs and without generating additional turnover.
In Figure 7, we report the summary statistics for the risk-managed portfolios with the RF filter and compare them to the portfolio with the standard fundamental parametric filters which exclude stocks based on fixed cut-offs of valuation, quality and credit characteristics. We observe a desirable increase in the Sharpe Ratio from 1.18 to 1.23 and an accompanying decrease in the maximum drawdown which leads to an overall more attractive risk/return profile, thus proving the superiority of using a machine learning based filter.
Figure 7 also illustrates the expected turnover reduction from 180% to 132%. This is the result of using the machine learning algorithm to aggregate information and apply it in a way that does not simply exclude certain stocks but also freezes the weights of stocks depending on their rank in the cross-sectional distribution of forecasts.
Figure 7: Summary Statistics of Low Risk Portfolios with the RF Filter
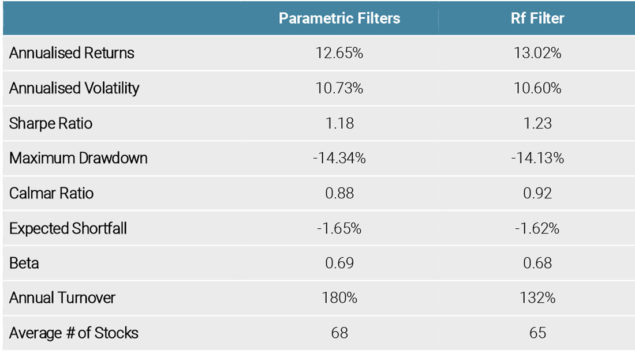
Source: S&P Global, Unigestion. Data as at June 2020.
Backtested performance from Dec 2009 to Jan 2020. This table contains hypothetical performance, please refer to the Important Information at the end of the document. Hypothetical performance is no guide to the future, the value of investments can fall as well as rise, there is no guarantee that your initial investment will be returned. Performance is shown gross of fees, thereby the inclusion of fees, costs and charges will reduce the overall value of performance. Returns may increase or decrease as a result of currency fluctuations.
One natural question to ask when interpreting the performance of the machine learning algorithm is which types of stocks are excluded by the algorithm during the sample period. To complement the variable importance results discussed in the context of Figure 6, we present in Figure 8 the factor scores for excluded stocks. The scores or characteristics of the stocks excluded suggest that the algorithm tends to exclude expensive, low quality high volatility stocks.
Figure 8: Factor Scores for Excluded Stocks
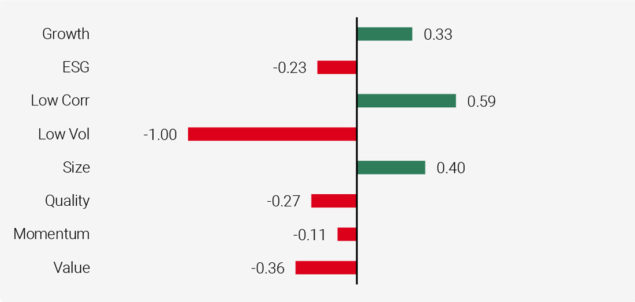
Source: S&P Global, Unigestion. Data as at June 2020.
Average figures based on the period from Dec 2009 to Mar 2020, except for ESG scores, where the starting period is Jan 2016.
To shed further insights into the workings of the RF algorithm, Figure 8 reports which sectors the excluded stocks tend to belong to. Among the excluded sectors, Health Care, Energy, Financials and Real Estate are overrepresented.
Figure 9: Sector Representation for Excluded Stocks
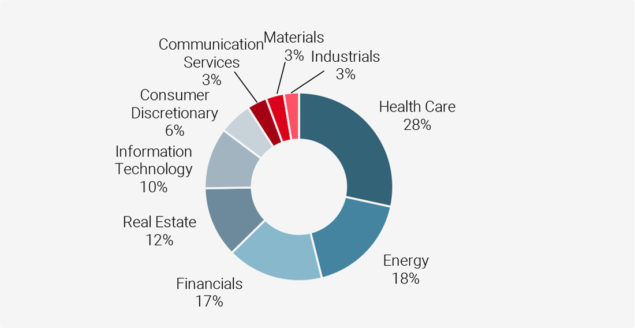
Source: S&P Global, Unigestion.
Data as at June 2020. Average figures based on the period from Dec 2009 to Mar 2020.
Of course, when interpreting the stock characteristics and sector representation, it is important to bear in mind that these results are averages over the whole sample period. A more granular analysis can reveal which characteristics and sectors tend to be overrepresented as a result of the filter at each point in time.
6. Conclusion
In this paper, we have documented the improvement in the risk/return relationship that is obtained by applying machine learning based stock filters to the initial stock universe before selecting stocks to create a risk-managed portfolio. The results have been illustrated for the case of a US portfolio. Unigestion has successfully applied these filters to other regions as well.
Obvious avenues for further research are to examine a range of other machine learning methods such as XGBoost and Neural Networks. The integration of machine learning filters with ESG is particularly relevant for investors. Unigestion has integrated the machine learning filter described in this paper within an ESG framework. For more details about ESG integration into low risk portfolios, please refer to our recent white paper ‘ESG Integration Within Minimum Variance Portfolios’ (May, 2020).
References
Bianchi, D. Büchner, M. and Andrea Tamoni, 2020, “Bond Risk Premiums with Machine Learning”. The Review of Financial Studies, hhaa062, https://doi.org/10.1093/rfs/hhaa062
Breiman L., 2001, “Random Forests”. Machine Learning. 45 (1): 5–32.
De Rossi, G., Borghi, R., Kolodziej, Brar, G., Conomos, J., Stuard-Findlay, C., Lamplough, J., Hou, Y., Chow, T. and A. Chao, 2018, “Building a Multi-Factor Signal: The Machine Learning Approach”. Macquarie Quantitative Strategy team.
Feng, G., Fulop, A. and L. Junye, 2020, “Real-Time Macro Information and Bond Return Predictability: Does Deep Learning Help?”. Available at: https://papers.ssrn.com/sol3/papers.cfm?abstract_id=3517081
Fontanille, C., Kosowski, R., Ramakrishnan, R. Rodriguez, E. and G. Trichilo (2020), ‘’Machine Learning for Fund Selection”. Available at /wp-content/uploads/2020/12/20201008-White-Paper-Machine-Learning-FINAL.pdf
Gu, S., Kelly, B. and D. Xiu, 2020, “Empirical Asset Pricing via Machine Learning”, The Review of Financial Studies, Vol. 33, Issue 5, May 2020, pages 2223 to 2273.
Haugen, R.A., and A.J. Heins. “Risk and the Rate of Return of Financial Assets: Some Old Wine in Bottles”. Journal of Financial and Quantitative Analysis, Vol. 10, Issue 5, December 1975, 775-784.
Jourovski, A., Dubikovskyy, V., Adell, P. R. Ramakrishnan, and R. Kosowski, 2020, “Forecasting Beta Using Machine Learning and Equity Sentiment Variables”, book chapter Machine Learning for Asset Management – New Developments and Financial Applications published by Wiley in July 2020 and edited by Emmanuel Jurczenko.
Razmpa, S. and R. Kosowski, 2020, “ESG Integration within Minimum Variance Portfolios”. Available at: /wp-content/uploads/2020/05/UNG_ESG_IntegrationMinVarPrtflios_WhitePaper_EN_052020.pdf
Sigrist, N. and M. Perfetto (2019), “A Quantitative Approach to Private Equity Fund Selection”, Available at: /wp-content/uploads/2019/10/Perspectives-A-Quantitative-Approach-to-Private-Equity-Fund-Selection-Final-all-jurisdictions.pdf
Important Information
Past performance is no guide to the future, the value of investments, and the income from them change frequently, may fall as well as rise, there is no guarantee that your initial investment will be returned. This document has been prepared for your information only and must not be distributed, published, reproduced or disclosed by recipients to any other person. It is neither directed to, nor intended for distribution or use by, any person or entity who is a citizen or resident of, or domiciled or located in, any locality, state, country or jurisdiction where such distribution, publication, availability or use would be contrary to law or regulation.
This is a promotional statement of our investment philosophy and services only in relation to the subject matter of this presentation. It constitutes neither investment advice nor recommendation. This document represents no offer, solicitation or suggestion of suitability to subscribe in the investment vehicles to which it refers. Any such offer to sell or solicitation of an offer to purchase shall be made only by formal offering documents, which include, among others, a confidential offering memorandum, limited partnership agreement (if applicable), investment management agreement (if applicable), operating agreement (if applicable), and related subscription documents (if applicable). Please contact your professional adviser/consultant before making an investment decision.
Where possible we aim to disclose the material risks pertinent to this document, and as such these should be noted on the individual document pages. The views expressed in this document do not purport to be a complete description of the securities, markets and developments referred to in it. Reference to specific securities should not be considered a recommendation to buy or sell. Unigestion maintains the right to delete or modify information without prior notice. Unigestion has the ability in its sole discretion to change the strategies described herein.
Investors shall conduct their own analysis of the risks (including any legal, regulatory, tax or other consequences) associated with an investment and should seek independent professional advice. Some of the investment strategies described or alluded to herein may be construed as high risk and not readily realisable investments, which may experience substantial and sudden losses including total loss of investment. These are not suitable for all types of investors.
To the extent that this report contains statements about the future, such statements are forward-looking and subject to a number of risks and uncertainties, including, but not limited to, the impact of competitive products, market acceptance risks and other risks. Actual results could differ materially from those in the forward-looking statements. As such, forward looking statements should not be relied upon for future returns. Targeted returns reflect subjective determinations by Unigestion based on a variety of factors, including, among others, internal modeling, investment strategy, prior performance of similar products (if any), volatility measures, risk tolerance and market conditions. Targeted returns are not intended to be actual performance and should not be relied upon as an indication of actual or future performance.
No separate verification has been made as to the accuracy or completeness of the information herein. Data and graphical information herein are for information only and may have been derived from third party sources. Unigestion takes reasonable steps to verify, but does not guarantee, the accuracy and completeness of information from third party sources. As a result, no representation or warranty, expressed or implied, is or will be made by Unigestion in this respect and no responsibility or liability is or will be accepted. All information provided here is subject to change without notice. It should only be considered current as of the date of publication without regard to the date on which you may access the information. Rates of exchange may cause the value of investments to go up or down. An investment with Unigestion, like all investments, contains risks, including total loss for the investor.
Hypothetical, Backtested or Simulated Performance
Hypothetical, backtested or simulated performance is not an indicator of future actual results. The results reflect performance of a strategy not currently offered to any investor and do not represent returns that any investor actually attained. Hypothetical results are calculated by the retroactive application of a model constructed on the basis of historical data and based on assumptions integral to the model which may or may not be testable and are subject to losses. Changes in these assumptions may have a material impact on the hypothetical (backtested/simulated) returns presented. Certain assumptions have been made for modeling purposes and are unlikely to be realized. No representations and warranties are made as to the reasonableness of the assumptions. This information is provided for illustrative purposes only. Specifically, hypothetical (backtested/simulated) results do not reflect actual trading or the effect of material economic and market factors on the decisionmaking process. Since trades have not actually been executed, results may have under- or over-compensated for the impact, if any, of certain market factors, such as lack of liquidity, and may not reflect the impact that certain economic or market factors may have had on the decision-making process. Further, backtesting allows the security selection methodology to be adjusted until past returns are maximized.
Legal Entities Disseminating This Document
UNITED KINGDOM
This material is disseminated in the United Kingdom by Unigestion (UK) Ltd., which is authorized and regulated by the Financial Conduct Authority (“FCA”). This information is intended only for professional clients and eligible counterparties, as defined in MiFID directive and has therefore not been adapted to retail clients.
UNITED STATES
This material is disseminated in the U.S. by Unigestion (UK) Ltd., which is registered as an investment adviser with the U.S. Securities and Exchange Commission (“SEC”). This information is intended only for institutional clients and qualified purchasers as defined by the SEC and has therefore not been adapted to retail clients.
EUROPEAN UNION
This material is disseminated in the European Union by Unigestion Asset Management (France) SA which is authorized and regulated by the French “Autorité des Marchés Financiers” (“AMF”).
This information is intended only for professional clients and eligible counterparties, as defined in the MiFID directive and has therefore not been adapted to retail clients.
CANADA
This material is disseminated in Canada by Unigestion Asset Management (Canada) Inc. which is registered as a portfolio manager and/or exempt market dealer in nine provinces across Canada and also as an investment fund manager in Ontario, Quebec and Newfoundland & Labrador. Its principal regulator is the Ontario Securities Commission (“OSC”). This material may also be distributed by Unigestion SA which has an international advisor exemption in Quebec, Saskatchewan and Ontario. Unigestion SA’s assets are situated outside of Canada and, as such, there may be difficulty enforcing legal rights against it.
SWITZERLAND
This material is disseminated in Switzerland by Unigestion SA which is authorized and regulated by the Swiss Financial Market Supervisory Authority (“FINMA”).
Document issued December 2020.