Last month, we expected a sharp deterioration in macroeconomic data, a downward adjustment in earnings expectations and more attractive valuations that would shift our cautious view to a more positive one on growth-oriented assets. In line with our outlook, hard data depicted one of the greatest economic shocks in history in April, and analysts sharply downgraded their expectations for earnings growth in 2020. However, our defensive tactical allocation was not rewarded by market action. Indeed, despite deteriorated fundamental elements, risky assets delivered exceptionally strong returns in April, recovering markedly from the lows seen in March. Why are financial markets thriving while fundamentals are so dire? And what does this imply for the future?Main Street vs Wall Street

Money, Money, Money

The scope and the scale of current monetary policy has been so large and so broad that this has destroyed the relationship between fundamentals and market pricing. Usually, returns from risky assets reflect the economic performance of a country, sector or company. We can apply the same link between the yields on sovereign or corporate bonds and the level of debt, growth trajectory and the rating of the country or company. This historical relationship has been broken recently. Asset performance in April 2020 reflects this disconnect. Despite an historic rise in unemployment figures across the world, the worst quarterly GDP growth in the US and Europe since World War II and historically low consumption and confidence, equity markets delivered one of their best monthly returns ever. The MSCI AC World returned 10.7% last month, the second best monthly performance in history after April 2009. We could explain this by the difference in horizon reflected by coincident or backward-looking macroeconomic data and more forward-looking markets. However, this explanation does not work while Q1 GDP figures only partially incorporate the negative impact of lock down (two weeks for the US economy and between three to four weeks for European countries). We already know that Q2 numbers will be much worse and that uncertainty about a return to normality will remain high. The situation for “Main Street “will not improve any time soon but “Wall Street” seems to think differently. What have we missed? This disconnect between the real economy and financial markets stems mainly from the new role of central banks, which have decided to buy everything whatever the price and the risk of the assets they’re targeting to save the global economy from major dislocations. Having saved the financial sector in 2008 and European peripheral countries in 2011, central banks are now saving big corporates from failure and governments from higher cost of debt. The target has become so big that the tools had to be adapted. The Fed has increased its balance sheet by USD 2.5tn in just six weeks. This represents more than 10% of US GDP. The ECB, BoJ, RBA, BoE and BoC are all following this revolutionary trend. Projections show that, by the end of the year, G4 central banks could hold around 60% of their GDP on their balance sheets. In the new normal, size matters and the size is big, but scope matters more and it is becoming bigger than any ‘helicopter money’ rhetoricians could imagine. Thanks to the “portfolio channel” effect, central banks do not need to buy equity or high yield bonds directly to support shareholders or bondholders. Injecting money in other markets such as investment grade (IG) credit or mortgage-backed security markets is sufficient because it lowers their associated risk premium, thereby increasing the attractiveness of other risky assets. Moreover, by expanding the investment universe eligible for their asset purchase programmes, central banks have opened the door for a new period of expansion that could include equities or downgraded corporate bonds if the situation does not stabilise. This reinforces the compression of risk premia embedded in any risky assets thanks to the “guidance channel” effect. In modern history, characterised by muted inflation risks, we have seen the Greenspan era and the “Fed put” that used the “interest rates channel” to smooth the negative impact of economic downturns, creating a negative correlation between sovereign bonds and risky assets. We have experienced the “Bernanke and Draghi” period with the concept of quantitative easing, implemented to contend with the lower limits of interest rates, and which generated the famous epithet “bad news is good news”. We are now in new territory where “All-in Easing” or “Infinite QE” has created an unlimited demand for financial assets, raising the question “what does value mean?” when you have a buyer of last resort for a large spectrum of assets. We believe that this situation will continue and become structural because the size and the impacts are both too big to be removed in the medium term. Consequently, the “new normal” has become the norm and the temporary, permanent. Focused on macro deterioration and the propagation of the COVID-19 virus, we have perhaps underestimated the positive impact of this on market sentiment and valuation, both of which fueled the rally in April. The first consequence of this “game changer” is to validate the Quantity Theory of Money but in a different way from the one developed by Milton Friedman,who assumed that the quantity of money drives the prices of goods. Finally, the quantity of money injected by central banks since QE started seems to have determined the price of assets, not those consumed by households and producers. In the end, price only reflects the balance between supply and demand. If supply remains unchanged (or even declines due to delisting or buybacks) and demand explodes thanks to the boost coming from trillions of dollars’ worth of central bank balance sheet expansion, the price of equities and risky assets could rise regardless of their fundamentals thanks to this structural support. We could illustrate this by comparing the money velocity, defined as the unit of GDP per unit of money supply (M2), with what we call the financial velocity, defined as the unit of S&P 500 per unit of money supply. Historically, both are evolving in parallel, confirming the historical relationship between the economy and equity returns. Since the central bank purchases in 2010, the money velocity has fallen to a new low in April while the ratio of the S&P 500 to M2 has risen markedly over the period to reach pre-GFC levels. From an asset allocation point of view, this would imply that the well-known mantra “Don’t fight the Fed” is increasingly valid and should be taken into account in all tactical decisions alongside fundamental analysis, positioning tracking, sentiment monitoring and valuation assessment. The mantra also highlights how costly it can be to not be exposed to beta, especially if the Fed is followed by other key central banks. That is why we are selective in our growth-oriented exposure, preferring assets with a larger sensitivity to central bank action than those with a higher beta to growth. As a result, we have increased our allocation to IG bonds in our portfolio despite a deteriorated macro environment. We think that this exceptional support from central banks has modified the risk/reward of this asset class by lowering liquidity risk and improving its valuation. The Fed’s actions have also eased pressure on USD funding and improved visibility for emerging assets. Given the tools available in China for further supportive action and the relative attractiveness of emerging assets versus developed ones, our tactical allocation currently has a positive tilt toward emerging equities as well. The macro element has benefited from central bank action that has smoothed the negative impact of recession on both income and financial conditions. As a result, market sentiment now seems more balanced for several technical reasons: 1) we observe a normalisation in Treasury markets and a tightening of funding spreads in USD funding markets. 2) Since the correction started in February, around USD 1.1tn has been moved into US money market funds and another USD 1.2tn into US bank deposits. We observe a similar pattern in other countries. This mountain of cash could be invested in the short term if the COVID-19 curve continues to decline.3) The current low positioning in equities, as tracked by our beta analysis for systematic and discretionary hedge fund strategies, could be reversed. Firstly, if equity markets continue to rise or even stabilise, implied and realised volatility will decline, triggering an appetite to re-risk portfolios. Secondly, trend follower strategies that are currently net short global equities and credit spreads could mechanically reverse their positions soon if the rally continues in the coming weeks. These elements could trigger a new bullish leg for growth-oriented assets without a net improvement in fundamentals, economic outlook and earnings expectations. The divergence between Main Street and Wall Street would then widen in the future, not tighten. On the surface, when we look at April or year-to-date performance for most risky assets, the crisis seems 1) behind us, 2) not so dramatic and 3) closer to a big episode of market stress than one driven by one of the biggest macro shocks observed since World War II. Nevertheless, as is often the case, beneath the surface, the picture and the narrative told by market pricing looks clearly different. For several reasons, only a few market segments have recovered in April. This means that the scale of the rebound was weak in terms of both growth-oriented assets and sectors. Cyclical commodities, EM FX, cyclical equity sectors and the lowest credit segment are all closer to their lows than their highs. As an illustration of this, the Russel 1000 Index, which has performed well in April (+15%), is still down -20% on a year-to-date basis, markedly lagging other US equity indices. This concentration in upside contribution raises, in our view, two risks: 1) the current discrimination between winners and losers based on Schumpeter’s concept of “creative destruction” could be challenged if the economy takes longer than expected to normalise. Our China GDP Nowcaster shows that, although the recovery in several sectors is on track, current levels for several segments are still markedly lower than those observed before the crisis. We have a similar picture in South Korea. A broader and longer recession will limit the benefits of discrimination and affect the current winners as their earnings are adjusted downwards. 2) The bigger the concentration, the greater the fragility of financial sectors because of crowded positioning. A new shock linked to a negative surprise on COVID-19 will trigger a new negative feedback loop driven by a “liquidity run”. To deal with these two sources of risk, we have added, beside our overweight in both IG credit and emerging equities, some exposure to implied long-term volatility that will provide convex protection in our portfolio in the event of another sharp decline. The odds that the mantra “Sell in May” will outweigh “Don’t fight the Fed” and “Trend is your friend” remains far from negligible despite the song sung by markets in April: “Money, Money, Money”.What’s Next?
Main Street vs Wall Street
Monetary policy is a game changer (once again)
“Don’t fight the Fed”
Trend could be your friend in the coming weeks
The tail has been removed from pricing, but not in our outlook
Unigestion Nowcasting
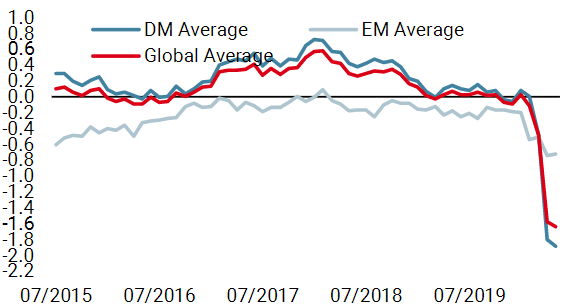
World Growth Nowcaster
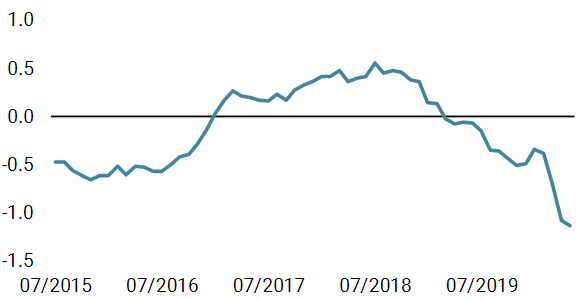
World Inflation Nowcaster
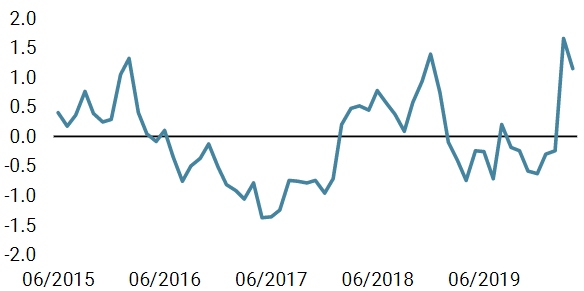
Market Stress Nowcaster
Weekly Change
- Our world Growth Nowcaster decreased again last week, with the Eurozone and the UK showing a 1 standard deviation decline in their economic data. Our world indicator has now reached a value of -1.64 standard deviations, indicative of a very high risk of recession.
- Our world Inflation Nowcaster also fell across all countries we monitor. This decline is consistent with dire growth conditions.
- Our Market Stress Nowcaster declined across all components last week: liquidity improved and so did volatility and credit spreads.
Sources: Unigestion. Bloomberg, as of 30 April 2020.
Important Information
This document is provided to you on a confidential basis and must not be distributed, published, reproduced or disclosed, in whole or part, to any other person.
The information and data presented in this document may discuss general market activity or industry trends but is not intended to be relied upon as a forecast, research or investment advice. It is not a financial promotion and represents no offer, solicitation or recommendation of any kind, to invest in the strategies or in the investment vehicles it refers to. Some of the investment strategies described or alluded to herein may be construed as high risk and not readily realisable investments, which may experience substantial and sudden losses including total loss of investment.
The investment views, economic and market opinions or analysis expressed in this document present Unigestion’s judgement as at the date of publication without regard to the date on which you may access the information. There is no guarantee that these views and opinions expressed will be correct nor do they purport to be a complete description of the securities, markets and developments referred to in it. All information provided here is subject to change without notice. To the extent that this report contains statements about the future, such statements are forward-looking and subject to a number of risks and uncertainties, including, but not limited to, the impact of competitive products, market acceptance risks and other risks.
Data and graphical information herein are for information only and may have been derived from third party sources. Although we believe that the information obtained from public and third party sources to be reliable, we have not independently verified it and we therefore cannot guarantee its accuracy or completeness. As a result, no representation or warranty, expressed or implied, is or will be made by Unigestion in this respect and no responsibility or liability is or will be accepted. Unless otherwise stated, source is Unigestion. Past performance is not a guide to future performance. All investments contain risks, including total loss for the investor.
Unigestion SA is authorised and regulated by the Swiss Financial Market Supervisory Authority (FINMA). Unigestion (UK) Ltd. is authorised and regulated by the UK Financial Conduct Authority (FCA) and is registered with the Securities and Exchange Commission (SEC). Unigestion Asset Management (France) S.A. is authorised and regulated by the French “Autorité des Marchés Financiers” (AMF). Unigestion Asset Management (Canada) Inc., with offices in Toronto and Montreal, is registered as a portfolio manager and/or exempt market dealer in nine provinces across Canada and also as an investment fund manager in Ontario and Quebec. Its principal regulator is the Ontario Securities Commission (OSC). Unigestion Asia Pte Limited is authorised and regulated by the Monetary Authority of Singapore (MAS). Unigestion Asset Management (Copenhagen) is co-regulated by the “Autorité des Marchés Financiers” (AMF) and the “Danish Financial Supervisory Authority” (DFSA). Unigestion Asset Management (Düsseldorf) SA is co-regulated by the “Autorité des Marchés Financiers” (AMF) and the “Bundesanstalt für Finanzdienstleistungsaufsicht” (BAFIN).