Managing the risks in emerging market equities
- While EM equities outperformed global equities in 2017, this year has been more challenging, with the MSCI Emerging Markets Index declining by 6.66% over the six months to 30 June.*
- This pullback has brought EM equity valuations down, offering an attractive entry point. In addition, EMs benefit from a younger demographic who are likely to have a significant impact on spending growth.
- Despite the relatively positive longer-term outlook for EM equities, there are a number of potential headwinds on the horizon. We believe that a riskmanaged strategy, which aims to provide good upside participation with some downside protection, is critical.
The case for emerging market equities
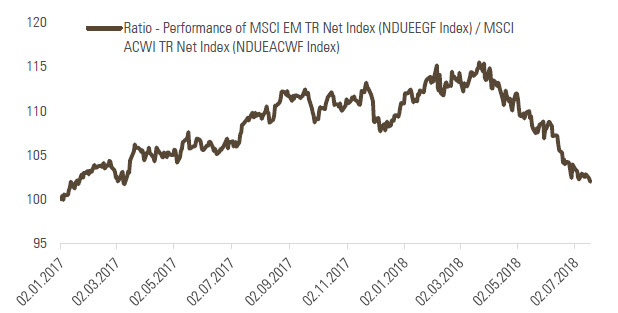
Emerging market (EM) equities strongly outperformed global equities in 2017, driven by better global growth prospects, low inflation and interest rates, a lack of negative news from China, as well as a relatively weak US dollar versus EM currencies.
This year, however, has so far proven to be more challenging, with the MSCI Emerging Markets index declining by 6.66% over the six months to 30 June and underperforming the MSCI World index by 7.1%*. After a very strong start during most of January, inflation concerns late in the month triggered a market sell-off as bond yields rose in the US and Europe. In mid-March, equities came under pressure again, as global technology stocks dropped following the Facebook scandal. Since March, protectionist rhetoric from the US, monetary tightening from the US Federal Reserve (Fed), a stronger US dollar and weaker data from China have reversed some of emerging markets’ earlier momentum.
Chart 1: Performance of emerging market vs global equities
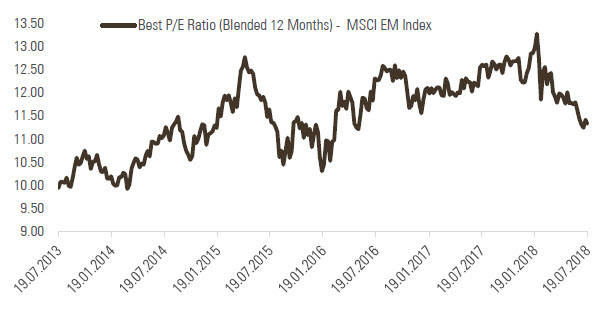
This pullback has brought EM equity valuations down from their five-year highs in January to more reasonable levels, which we believe now offer an attractive entry point.
Chart 2: MSCI Emerging Markets price-to-earnings ratio
In addition, while many developed economies struggle with the demographic challenges associated with an aging population, emerging and developing economies benefit from a younger demographic, with China alone having 400 million millennials (those generally born between 1980 and the late 90s), which is more than the entire population of the US. China’s rapid growth has driven a change in the economic profile of the population, with significant growth in middle-income earners, as illustrated by the below charts from McKinsey. These more cash-rich millennials are likely to have a significant impact on spending patterns and growth.
Chart 3: Changes in income levels across Chinese households
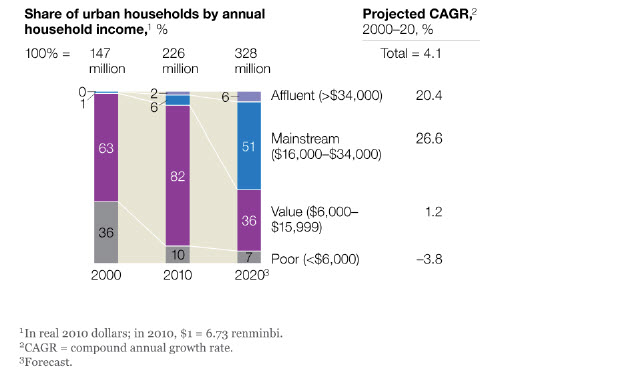

China’s rapid growth has driven a change in the economic profile of the population, with significant growth in middle-income earners.

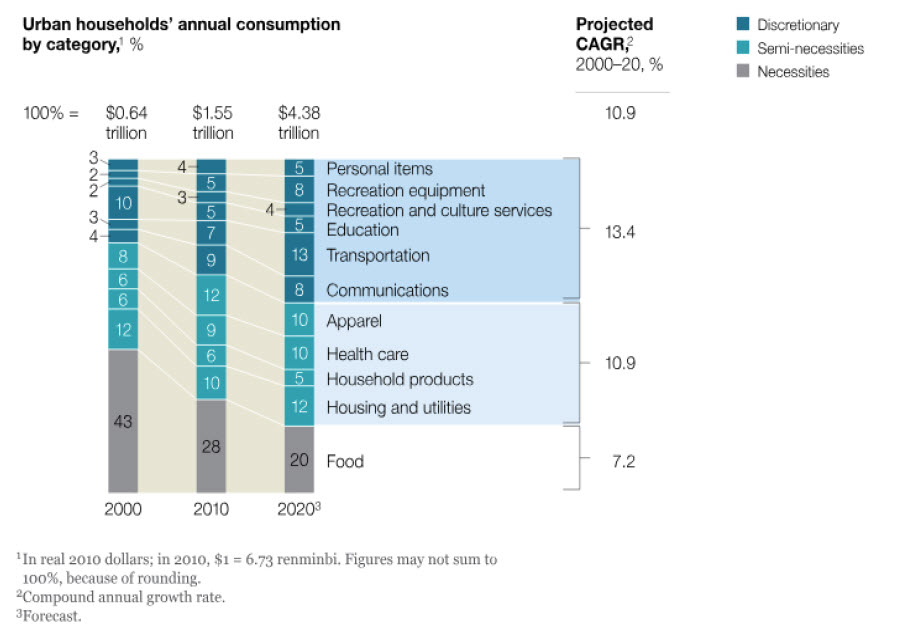
Chart 4: Discretionary spending growth
A risk-managed approach is essential
Despite the relatively positive longer-term outlook for EM equities, we believe that a risk-managed approach to investing in these markets is critical, especially given the potential headwinds on the horizon. One such headwind is the stronger US dollar, as most EM countries are running current account deficits and require external funding, with external debt held mostly in US dollars.
Chart 5: Most EM countries are running current account deficits
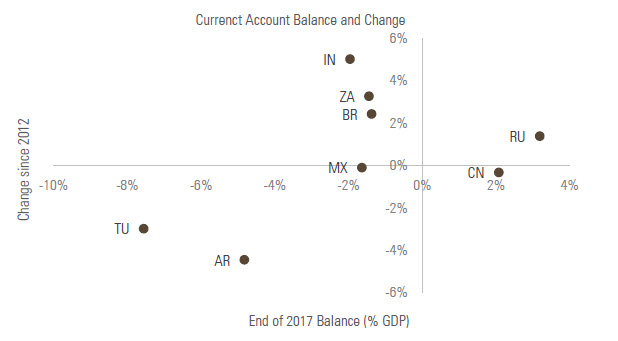
Although many EM countries have improved their current account positioning since 2012, a stronger US dollar is still likely to present a challenge.
Chart 6: Most external debt is held in US dollars
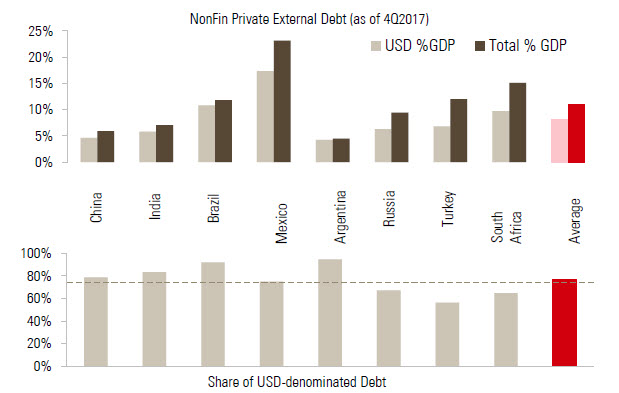
The above charts illustrate EM current account deficits along with corporate debt. Although many countries have improved their current account positioning since 2012, a stronger US dollar is still likely to present a challenge. The corporate debt chart (chart 6) should be considered in the context of the proportion of corporate revenues generated in US dollars. For example, despite the illustration in the chart, Mexican companies might not be as exposed to the currency risk if they are financing their US dollar debt with US dollar-generated revenues.
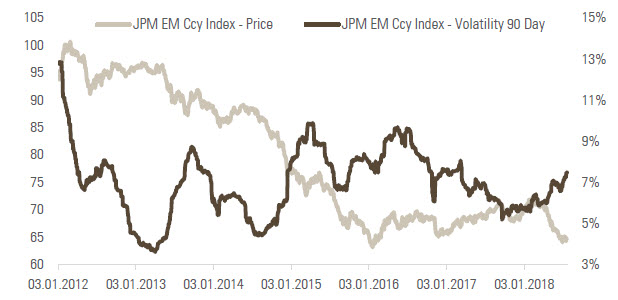
This pressure via the foreign exchange (FX) channels is likely to continue, given the Fed’s monetary policy tightening cycle and further potential for inflationary surprises in the US, driven by higher wage pressures and rising input prices. This may in turn put pressure on EM central banks to also tighten their monetary policy, in order to limit FX depreciation and avoid subsequent inflationary impacts.
Chart 7: EM currencies have weakened and volatility has increased
Tighter monetary policy in China, aiming to bring under control the country’s exorbitant debt levels, is also having a visible impact, with some signs of slowing economic activity. This has been compounded by weaker data from Europe, China’s largest export market. If this situation deteriorates further, we may see a return to monetary easing in China.
Chart 8: Recently our Growth Nowcasters have shown disappointing data in China and in the Eurozone
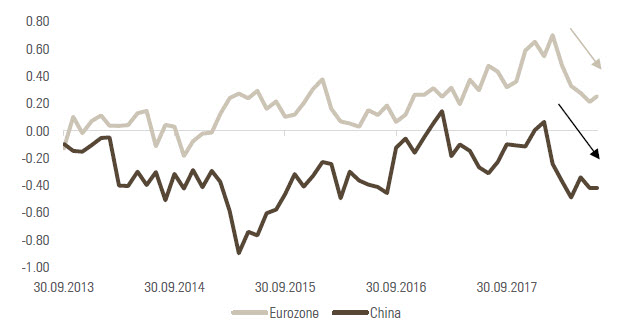
Reading note: the Growth Nowcaster indices are real-time synthetic measures of economic growth. It is computed as a proprietary normalised average of a broad spectrum of indicators spanning the different domains of the economy (production, consumption, employment, investment). The Growth Nowcaster takes positive or negative values. A reading above (resp. below) 0 of the Growth nowcaster expresses that the economy is growing at a higher (resp. lower) pace than the “normal” growth (also called potential growth). Based on the same set of indicators, the Diffusion index is computed as the proportion of increasing macroeconomic indicators, hence giving indication of the broadness of the economic expansion.
Conclusion
In this context of market uncertainty and increased volatility driven by escalating trade war rhetoric, we believe that the best way to gain exposure to EM equities is through a risk-managed strategy that aims to provide good upside participation with some downside protection. Our Emerging Markets strategy has proven to be resilient in the more turbulent environment of 2018, having returned -3.48% gross of fees, versus a return of -6.66% for the MSCI Emerging Markets index, over the first six months of 2018.*
Our risk-managed approach ensures we focus on the unrewarded risks that we believe may be lurking in the shadows, aiming to steer our portfolios to minimise their negative impacts. Our control for excessive valuation and interest rate sensitivity will be key in the coming quarters, as the normalisation of monetary policy in the US and Europe is likely to drag capital out of EM equities, with overvalued and rate-sensitive stocks likely to be the first to suffer.
*Source: Bloomberg, Unigestion, 31/12/2017 to 30/06/2018.
Important Information
The information and data presented in this page may discuss general market activity or industry trends but is not intended to be relied upon as a forecast, research or investment advice. It is not a financial promotion and represents no offer, solicitation or recommendation of any kind, to invest in the strategies or in the investment vehicles it refers to. Some of the investment strategies described or alluded to herein may be construed as high risk and not readily realisable investments, which may experience substantial and sudden losses including total loss of investment.
The investment views, economic and market opinions or analysis expressed in this page present Unigestion’s judgement as at the date of publication without regard to the date on which you may access the information. There is no guarantee that these views and opinions expressed will be correct nor do they purport to be a complete description of the securities, markets and developments referred to in it. All information provided here is subject to change without notice. To the extent that this page contains statements about the future, such statements are forward-looking and subject to a number of risks and uncertainties, including, but not limited to, the impact of competitive products, market acceptance risks and other risks.
Data and graphical information herein are for information only and may have been derived from third party sources. Although we believe that the information obtained from public and third party sources to be reliable, we have not independently verified it and we therefore cannot guarantee its accuracy or completeness. As a result, no representation or warranty, expressed or implied, is or will be made by Unigestion in this respect and no responsibility or liability is or will be accepted. Unless otherwise stated, source is Unigestion.
Past performance is not a guide to future performance. All investments contain risks, including total loss for the investor.