Gold has been an interesting trade over the years, shining at times and disappointing during others. Its diversification properties, store of value and hedge against inflation are reasons why investors like allocating part of their portfolios to the yellow metal. The Covid-19 crisis, accompanied by extraordinary fiscal and monetary stimulus, gave gold an unprecedented boost pushing its price up by over 40% from its March 2020 lows and sending it to record highs above USD 2,000/oz. A combination of strong inflows, a weakening US dollar and declining real yields were strong driving forces. Having already started its decline from its peak in August 2020, gold has struggled year to date and is currently in negative territory. The precious metal now seems to be at a crossroads. Below, we examine how we think gold will likely manoeuvre in the changing macroeconomic landscape to come.

Gold

What are the driving forces behind gold?
Uncertainty combined with extraordinary monetary and fiscal stimulus
Gold has been a relatively uneventful trade since 2013, moving in a fairly narrow range and averaging close to flat returns over the six-year window leading up to 2019 when it started to gain some traction ahead of the Covid-19 crisis at the start of 2020. The pandemic was a game changer as it pushed uncertainty to extreme highs, leading to strong investor demand and a temporary constraint over supplies. Gold futures trading on COMEX faced delivery shortages of 100 oz bars, which pushed the premium between the futures and physical London spot gold prices to record highs. This prompted the exchange to launch a new contract where 400 oz bars could be delivered in an attempt to alleviate the physical supply bottlenecks and shortage fears.
However, it is worth highlighting that dispersion dominated the demand side, with the first half of 2020 seeing record inflows into gold–backed Exchange Traded Funds (ETFs), as can be seen in Figure 1, while demand from the industry, for example the jewellery sector, took a large hit. Overall, central bank buying also slowed in 2020.
Figure 1: Exchange Traded Funds (ETF) holdings and flows in ounces
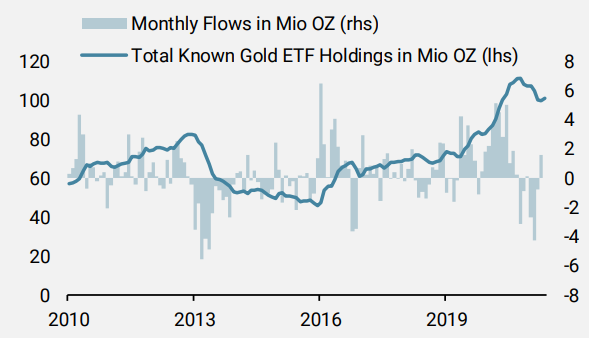
Source: Unigestion, Bloomberg, as of June 2021.
According to the World Gold Council, demand hit an 11-year low in 2020 and the last quarter of the year was the weakest for demand since 2008. The rally in gold was therefore largely driven by its safe haven status due to Covid-19 uncertainty.
Extraordinary monetary and fiscal stimulus, which resulted in masses of liquidity injections into the market, record levels of debt, plummeting real rates and a fall in the US dollar, made holding long gold positions particularly attractive and rewarding. Arguably, the most important driver of the price of gold are real rates (interest rates minus inflation) given the inverse relationship between the two. As the precious metal is characterised as a non-yielding asset, if interest rates rise the opportunity cost of holding it becomes negative. When these fall or go into negative territory, as is the case today, the appeal of gold to help prevent capital erosion grows sharply. The inverse correlation between the two is staggering, as can be seen in Figure 2, and this explains a large part of why prices reached record levels last year.
Figure 2: Gold’s relationship with US real rates
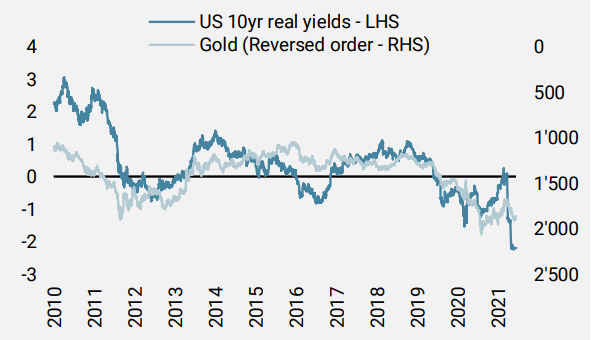
Source: Unigestion, Bloomberg, as of June 2021.
With gold largely denominated against the US dollar, the pull back in the world’s largest reserve currency has also been an important driver with the Dollar index (DXY) down 12% since its March 2020 peak.
The strong investor appeal and resulting performance of gold over the last few years is therefore not that surprising given the macroeconomic shock, policy dynamics and resulting uncertainty that followed the Covid-19 crisis. However, we believe that a majority of these driving forces are now behind us and the risk/reward of holding long gold positions has therefore diminished significantly. We expect it to continue its downward trajectory as long as our macro scenario continues to unfold.
Gold in the current macro environment
The current macro environment and momentum that we are observing is outstanding, as pointed out by both our proprietary Nowcasters and Newscasters which confirm above potential growth. We expect this strong macro environment to be with us for some time. Despite some mild dispersion between countries, the overall picture remains excellent and laggards such as the Eurozone are playing catch up with the US, which had so far dominated the macro recovery within developed markets. Uncertainty, one of the factors which had driven gold higher during the pandemic, has receded materially as recession fears have disappeared and this should continue to weigh on the safe haven demand for gold. The 6m oz of outflows out of gold ETFs so far this year only represent 25% of the inflows seen in 2020. These outflows should therefore continue. In short, ETF inflows which were a large tailwind behind the gold rally last year are now a strong headwind which could intensify going forward.
Looking at our World Inflation Nowcaster, which is a real-time synthetic measure that tracks inflation surprise risk, the message is clear: inflationary pressures are everywhere. Consumption is also likely to add a further boost as the world continues to reopen and the situation normalises. It is the only component of our indicators which had lagged post the Covid-19 crisis.
Contrary to the opinion of many central bankers and economists, we believe that these inflationary pressures will persist and not be transient. This should eventually revive taper discussions and comfort central banks into exiting their extraordinary levels of monetary policy accommodation. The end result should therefore be higher real rates which would leave gold vulnerable given the strong negative correlation discussed earlier.
There are many debates as to whether gold still has its role as an inflation hedge. We will not enter this debate here today, but we believe that commodities such as energy and industrial metals are in a better position to protect us against high inflation surprise risk than gold. Following the 2015 slump in commodity markets, global corporate spending across the energy and mining sectors fell dramatically. In many areas, supply was also severely affected by the Covid-19 crisis. Given the strong growth momentum we are now seeing, and combined with large infrastructure projects, the supply/demand imbalances should continue to be supportive over the medium term for commodity markets more broadly. We therefore remain overweight both industrial metals and energy and underweight gold.
To get a feel for the macroeconomic recovery we can look at the gold/silver ratio. Silver, despite also being labelled a precious metal, has a much larger industrial usage than gold. In periods of recession or uncertainty, silver therefore underperforms and gold tends to outperform thanks to its safe haven appeal. In line with our macro scenario, it is therefore not surprising to see how much the gold/silver ratio spread has collapsed from its record levels post the Covid-19 crisis – see Figure 3.
Figure 3: The Gold/Silver ratio is a good indicator of the macro recovery
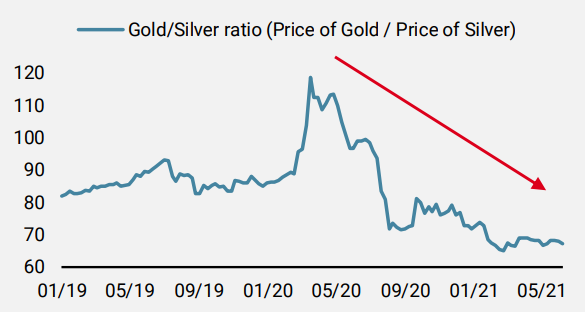
Source: Unigestion, Bloomberg, as of 10.06.2021.
What is gold’s valuation telling us?
In a famous article from 2013, Erb and Harvey proposed a valuation metric for gold based on its theoretical connection to inflation: they theorised that the price of gold should somewhat be linearly related to the levels of goods and services’ price indices. They named this this the “Golden Constant” and Figure 4 illustrates such a relationship. The Golden Constant has since become a reference for the valuation of gold. Figure 4 is a scatterplot between the US CPI index and the nominal price of gold. The blue dotted line is the trend implicit in the relationship between both series, estimated via a linear regression. The red dot is the most recent point. From that perspective, gold is clearly overvalued.
Furthermore, we believe that carry is another reliable cross-asset valuation metric. In the case of commodities, the roll yield is often used as a carry measure. Given the steep contangoed forward curve of gold, it also looks expensive.
Figure 4: Scatterplot of gold vs. US inflation as a valuation measure
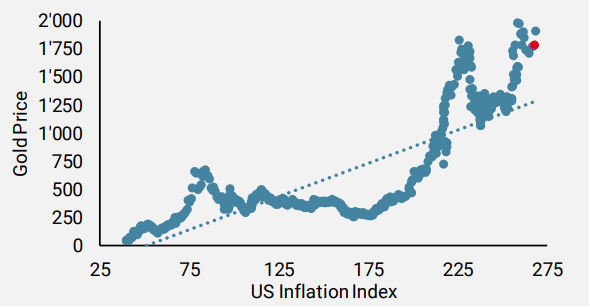
Source: Unigestion, Bloomberg, as of 31.03.2021.
Concluding remarks
Gold’s diversification properties remain appealing in terms of portfolio construction. However, it is clear that the driving forces which had aligned last year have now lost significant momentum and will likely be headwinds going forward if our macro scenario continues to unfold as expected. Given the retreating threat from the Covid-19 crisis and lack of geopolitical risk, investor demand for gold will likely remain weak going forward. However, industrial demand should pick up after having been seriously impacted last year. Having said that, we doubt this will be enough to counter the balance of investor outflows.
Rising real rates are gold’s biggest threat over the medium term and given our high inflation risk scenario, we prefer to remain underweight in the metal at this stage. Given the large fiscal and monetary stimulus which took place in the US and talks for additional infrastructure projects, if the US dollar were to remain under pressure it could help gold down the road.
All in all, the risk/reward for gold remains skewed to the downside in the current environment. Based on our narrative, our positioning favours overweighting real and growth assets and an underweight in defensive ones. We currently remain underweight gold and long the USD vs G10 currencies as the short USD trade seems to be consensual and crowded while the macro momentum remains firm and we expect real rates to rise further.
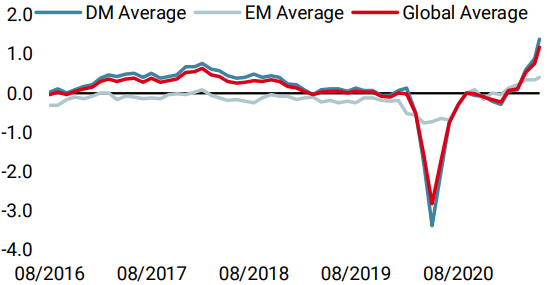
Unigestion Nowcasting
World Growth Nowcaster
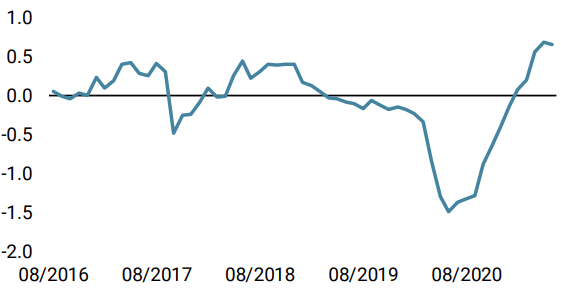
World Inflation Nowcaster
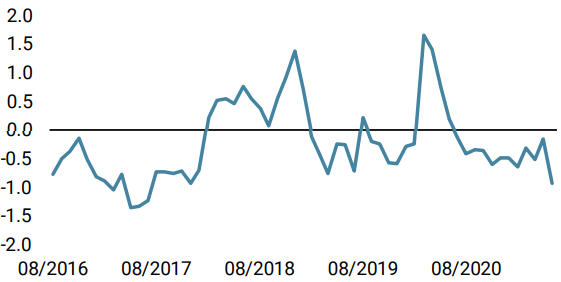
Market Stress Nowcaster
Weekly Change
- Last week, our World Growth Nowcaster rose further, with an improvement in both developed and emerging economies.
- Our World Inflation Nowcaster also moved up due to increasing inflation pressures in the US, Japan, and Switzerland.
- Our Market Stress Nowcaster remained low as all sub-components remain stable at low levels.
Sources: Unigestion, Bloomberg, as of 18.06.2021.
Important Information
This document is provided to you on a confidential basis and must not be distributed, published, reproduced or disclosed, in whole or part, to any other person.
The information and data presented in this document may discuss general market activity or industry trends but is not intended to be relied upon as a forecast, research or investment advice. It is not a financial promotion and represents no offer, solicitation or recommendation of any kind, to invest in the strategies or in the investment vehicles it refers to. Some of the investment strategies described or alluded to herein may be construed as high risk and not readily realisable investments, which may experience substantial and sudden losses including total loss of investment.
The investment views, economic and market opinions or analysis expressed in this document present Unigestion’s judgement as at the date of publication without regard to the date on which you may access the information. There is no guarantee that these views and opinions expressed will be correct nor do they purport to be a complete description of the securities, markets and developments referred to in it. All information provided here is subject to change without notice. To the extent that this report contains statements about the future, such statements are forward-looking and subject to a number of risks and uncertainties, including, but not limited to, the impact of competitive products, market acceptance risks and other risks.
Data and graphical information herein are for information only and may have been derived from third party sources. Although we believe that the information obtained from public and third party sources to be reliable, we have not independently verified it and we therefore cannot guarantee its accuracy or completeness. As a result, no representation or warranty, expressed or implied, is or will be made by Unigestion in this respect and no responsibility or liability is or will be accepted. Unless otherwise stated, source is Unigestion. Past performance is not a guide to future performance. All investments contain risks, including total loss for the investor.
Unigestion SA is authorised and regulated by the Swiss Financial Market Supervisory Authority (FINMA). Unigestion (UK) Ltd. is authorised and regulated by the UK Financial Conduct Authority (FCA) and is registered with the Securities and Exchange Commission (SEC). Unigestion Asset Management (France) S.A. is authorised and regulated by the French “Autorité des Marchés Financiers” (AMF). Unigestion Asset Management (Canada) Inc., with offices in Toronto and Montreal, is registered as a portfolio manager and/or exempt market dealer in nine provinces across Canada and also as an investment fund manager in Ontario and Quebec. Its principal regulator is the Ontario Securities Commission (OSC). Unigestion Asset Management (Copenhagen) is co-regulated by the “Autorité des Marchés Financiers” (AMF) and the “Danish Financial Supervisory Authority” (DFSA). Unigestion Asset Management (Düsseldorf) SA is co-regulated by the “Autorité des Marchés Financiers” (AMF) and the “Bundesanstalt für Finanzdienstleistungsaufsicht” (BAFIN).