The first six months of the year will go down in the history books. For the first time outside of wartime, the global economy experienced a global lockdown, with half of the world’s population staying at home. For the first time in history, the global economy fell into recession without any disruption or imbalances in supply and demand. As in the famous Kim Ki-duk movie, “Spring, Summer, Fall, Winter… and Spring”, financial markets and the world economy have faced four seasons in one day, one week or one month, over recent months. While the global situation has stabilised and tail risks have been lowered thanks to extraordinary policy support, investors remain cautious about the economic recovery in terms of path and scale. In contrast, we believe that the “V-shaped” recovery scenario remains underestimated while aggregate data continues to surprise to the upside. It is just “A Question of Time”.Markets Are Positioned For Protection, Not Recovery

A Question Of Time

After another positive month for global equities, and one of the best quarterly performances in the history of risky assets, what are the main messages being conveyed by current pricing and market dynamics? Based on an in-depth analysis of performance across assets, styles and sectors, we are seeing three key points: 1. The financial outlook is perceived as very uncertain This consensus view is reflected in the expensiveness of defensive assets that usually deliver positive returns in periods of sharp slowdown. Gold reached a new record since 2012 and was up 16% over the first six months of the year. Sovereign bond yields remained very low level despite the sharp rebound in risky assets. For example, the yield to maturity of the Bloomberg Barclays Global Treasuries index was 0.5% at end of June versus 1% at the beginning of the year and above 2% in 2010. More importantly, uncertainty is still seen as elevated by investors, as reflected by the high level of implied volatility in equities and the VVIX that are both above the 95th percentile. Moreover, the forward curve of the VIX index, still inverted due mainly to the US presidential election and the high level of skew, indicate that global positioning is tilted toward defensiveness and risk protection. 2. The inflation premium has recovered, but not the growth one We track the two main risk premia, inflation and growth, using different indicators. All are singing the same song: the growth premium remains depressed while the inflation premium has rebounded from very low levels. As a result, the performance of our Macro Baskets developed to monitor the pricing of the main macro risks (recession, inflation surprise and market stress) show a large positive performance in June for the inflation basket (+3.2%) while the growth basket delivered a flat performance. Similarly, the inflation risk premium embedded in sovereign bond yields has increased sharply from its lows in March, while the growth premium, reflected by the difference between the nominal bond yield and the inflation breakeven, remains negative, confirming that, for investors, expansion is not on the medium-term horizon. 3. The crisis has been an accelerator of past trends, and trend remains your friend In addition to the level and path of global growth, current pricing also provides important information about the nature and drivers of future expansion, as expected by financial markets. The relative performance across all sectors and equity styles confirms that past trends will accelerate and amplify. The continued outperformance of the Technology sector highlights the scale and the speed of economic digitalisation. Similarly, the outstanding performance of the “Quality” style highlights the benefits of having a healthy balance sheet and visibility on sales growth in the context of low bond yields and high leverage, while “Value” companies face higher labour costs-to-revenue ratios, greater competition and tighter regulation. As a result of these elements, the “Momentum” factor has delivered the best year-to-date performance of all the MSCI factors with a positive performance of 4.3% versus -5.6% for the MSCI World index. Market pricing therefore reflects a belief that these trends will continue in the coming quarters. The NBER records the peaks and troughs of US business cycles. Last month, it determined that US economic activity peaked in February 2020. This peak marks the end of the expansion that began in June 2009 and the beginning of a new US recession. The current crisis is therefore the third period of economic contraction in the US economy since 2000. This slowdown happened after the longest period of expansion in the history of US business cycles dating back to 1854. The previous record expansion lasted for 120 months from March 1991 to March 2001. As defined by the NBER, a recession involves “a decline in economic activity that lasts for more than a few months.” To determine when the US economy becomes recessionary, the NBER analyses the depth of the contraction, its duration, and whether economic activity declined broadly across the economy (the diffusion of the downturn). Since 1971, the US economy has experienced seven recessionary episodes, according to the NBER. Although it is common to look at these periods as a stylised pattern based on average GDP figures, confidence indicators and asset performance, beneath the surface, each US recession exhibits large specificities. For instance, regarding equity indices, the 1981 and 1990 episodes show that the S&P 500 index reached its pre-crisis peak before the official end of the recession. Conversely, the 2001 and 2008 periods took a long time to return to the levels seen before the economic contraction (respectively, 51 and 52 months). Regarding earnings, they did not contract during the 1973-1974 and 1980 episodes, but they declined sharply, between 20% and 25%, during the 1991, 2001 and 2008 episodes. It is interesting to note the number of months required for earnings to recover to pre-crisis peak. For the last four recessions, this number is fairly stable for trailing 12-month earnings: 36 months for 1981, 38 for 1990 and 33 for 2001 and 2008: around three years on average. Based on history, investors seem to be right to remain cautious about the path of the recovery and its amplitude. Nevertheless, as highlighted several times in our previous communications, we are convinced that this time is different, and while history can help to build expectations and forecasts, the specificities of the current shock should not be underestimated. As a reflection of this view, the NBER has recognised “that the pandemic and the public health response have resulted in a downturn with different characteristics and dynamics than prior recessions”. Nonetheless, it concluded that “the unprecedented magnitude of the decline in employment and production, and its broad reach across the entire economy, warrants the designation of this episode as a recession, even if it turns out to be briefer than earlier contractions.” We agree strongly with this last point and have built our dynamic asset allocation on a V-shaped recovery with a six to 12-month horizon. Our medium term view is based on three key elements: 1. In a V-shaped scenario, we trust Our different indicators developed to track the global economy in real time are all conveying the same message: the recovery is broad, strong and ongoing. Our Growth Nowcaster and Growth Newscaster rebounded sharply in June, as did the Fed’s different regional surveys. According to our Nowcasters, the Chinese economy is close to reaching pre-crisis levels of activity. Our Europe and US Growth Nowcasters have seen their forward-looking components such as production expectations and investment perspectives recover strongly while the housing component has remained resilient despite the fall in household confidence observed in March and April. 2. From growth-oriented assets, we expect a positive return Taken in isolation, the historical performance of assets during a marked economic slowdown would give us cause to prefer defensive assets to growth-oriented ones. The key factors that, in our view, justify a different positioning than the one suggested by previous recessions is about current policy mix and the huge impact of accommodative monetary policy on the risk premium for equities and credit spreads. Firstly, since its implementation, central bank balance sheet expansion has led risky assets to deliver positive returns thanks to the portfolio channel, as described by H. Hannoun in 2015 in a BIS paper1. Secondly, our analysis, based on a Gordon and Shapiro-type of model that decomposes the equity risk premium into different factors, shows that the actions of central banks, which increased the discount factor through lower bond yields and tighter credit premia, have offset the expected decline in earnings growth. As an illustration, our calculation shows that a 100 bps decline in interest rates offsets a 20% fall in next-12-months (NTM) earnings. At the end of 2019, expectations for 2020 earnings growth were 20% versus -20% currently. In the event of a V-shaped recovery in quarterly earnings growth that would lead to flat NTM earnings growth and an unchanged discount factor, our calculations give a level of 3,450 for the S&P 500, which is around 10% higher than today. The expected return based on this model is even larger for European or Japanese indices. We are convinced that the extraordinary fiscal plan implemented worldwide (around 10% of world GDP is expected) will help earnings to recover quicker than market and analyst expectations and will reinforce the V-shaped recovery in the coming months across and within assets. This is why we are tactically overweight growth-oriented assets in our multi asset portfolios. 3. In “Quality” stocks, we invest Within growth-oriented assets, our preference remains for “Quality” equity indices such as the Nasdaq or SMI for the following reasons. Unlike during the dotcom bubble, earnings in the Technology sector are strong, and likely to stay elevated. Moreover, Technology and Healthcare sectors have been relatively immune to the crisis. Most of the biggest companies in these sectors have been net winners in the dislocation and will continue to benefit from an acceleration of past trends driven by the Schumpeterian pattern and its famous creative destruction. Moreover, in a context of liquidity risk and higher default risk, in contrast to ’01-’02, balance sheets for “quality” companies are healthy and cash rich and these companies are supported by strong cash flow generation. Finally, while the continued rise in new cases has raised the risk that economies could reintroduce lockdown measures, we believe that these exposures will outperform the other styles and sectors. In the event of a second wave, we foresee selective and rolling measures, not the strict lockdown measures imposed earlier this year. At a global level, this means that economic activity can continue to improve, driven in particular by the economies that are reopening and helping to avoid the kind of market reaction seen between February and March. This reinforces our positive tilt toward risky assets at the expense of expensive defensive ones.What’s Next?
What is the market currently saying?
What is the NBER and history highlighting?
What do we believe?
Unigestion Nowcasting
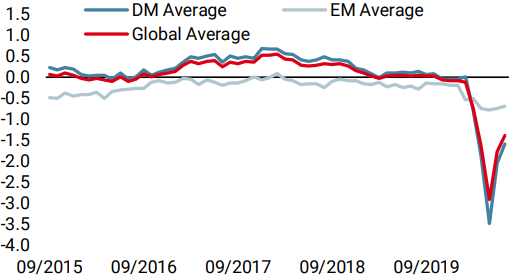
World Growth Nowcaster
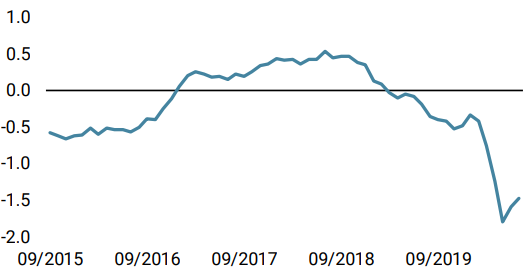
World Inflation Nowcaster
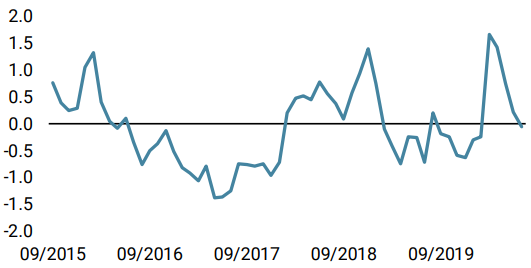
Market Stress Nowcaster
Weekly Change
- Our world Growth Nowcaster increased last week broadly: most countries showed stronger data. China’s growth nowcaster is now nearing the zero level, implying a complete normalisation of its economy.
- Our world Inflation Nowcaster also increased more broadly: only Japan and the UK are still seeing deflation pressures.
- Our Market Stress Nowcaster decreased last week, as volatility and spreads decreased.
Sources: Unigestion. Bloomberg, as of 06 July 2020.
Important Information
This document is provided to you on a confidential basis and must not be distributed, published, reproduced or disclosed, in whole or part, to any other person.
The information and data presented in this document may discuss general market activity or industry trends but is not intended to be relied upon as a forecast, research or investment advice. It is not a financial promotion and represents no offer, solicitation or recommendation of any kind, to invest in the strategies or in the investment vehicles it refers to. Some of the investment strategies described or alluded to herein may be construed as high risk and not readily realisable investments, which may experience substantial and sudden losses including total loss of investment.
The investment views, economic and market opinions or analysis expressed in this document present Unigestion’s judgement as at the date of publication without regard to the date on which you may access the information. There is no guarantee that these views and opinions expressed will be correct nor do they purport to be a complete description of the securities, markets and developments referred to in it. All information provided here is subject to change without notice. To the extent that this report contains statements about the future, such statements are forward-looking and subject to a number of risks and uncertainties, including, but not limited to, the impact of competitive products, market acceptance risks and other risks.
Data and graphical information herein are for information only and may have been derived from third party sources. Although we believe that the information obtained from public and third party sources to be reliable, we have not independently verified it and we therefore cannot guarantee its accuracy or completeness. As a result, no representation or warranty, expressed or implied, is or will be made by Unigestion in this respect and no responsibility or liability is or will be accepted. Unless otherwise stated, source is Unigestion. Past performance is not a guide to future performance. All investments contain risks, including total loss for the investor.
Unigestion SA is authorised and regulated by the Swiss Financial Market Supervisory Authority (FINMA). Unigestion (UK) Ltd. is authorised and regulated by the UK Financial Conduct Authority (FCA) and is registered with the Securities and Exchange Commission (SEC). Unigestion Asset Management (France) S.A. is authorised and regulated by the French “Autorité des Marchés Financiers” (AMF). Unigestion Asset Management (Canada) Inc., with offices in Toronto and Montreal, is registered as a portfolio manager and/or exempt market dealer in nine provinces across Canada and also as an investment fund manager in Ontario and Quebec. Its principal regulator is the Ontario Securities Commission (OSC). Unigestion Asia Pte Limited is authorised and regulated by the Monetary Authority of Singapore (MAS). Unigestion Asset Management (Copenhagen) is co-regulated by the “Autorité des Marchés Financiers” (AMF) and the “Danish Financial Supervisory Authority” (DFSA). Unigestion Asset Management (Düsseldorf) SA is co-regulated by the “Autorité des Marchés Financiers” (AMF) and the “Bundesanstalt für Finanzdienstleistungsaufsicht” (BAFIN).