- We expect global consumption to exceed expectations in 2021, leading the world into yet another recovery episode.
- Higher consumption growth should drive higher inflation – but not enough to derail the uptrend in growth assets.
- The main risk is therefore not a W-shaped recovery but growth strong enough to create an inflation wave.
- Given this scenario and this risk, we combine positive views on both growth and inflation assets.
Overview
As we head into the new year, we are starting to see an alignment of the three drivers of market returns: macro, sentiment and valuation. On the macro front, global consumption growth in H1 2021 stands an excellent chance of exceeding expectations. The considerable stimulus unleashed by most governments has not yet hit the global economy to its fullest, and what remains of it – upon the condition that the economy continues to normalise – is enough to lift the world economy’s boat, leaving brisk spurts of inflation in its wake. On the sentiment front, we think markets are not fully prepared for this: positioning in growth assets could reach higher grounds while inflation assets have yet to attract significant investor attention. Finally, high valuations could find justification in the strong recovery that we expect, while inflation assets remain in the affordable zone. We therefore see 2021 as a land of investment opportunities, favouring a combination of growth and inflation assets, as the latter should protect the first if inflation hits the economy harder than expected. Inflation is the risk we are seeing for 2021, not recession.
Part 1 – Reflation Means Higher Growth Assets
Consumption Growth Should Be Stronger than Expected
The announcement of a new round of fiscal stimulus by the US Treasury in the last few days of December serves as a stark reminder of the extraordinary developments in 2020. Market volatility was extreme throughout the year but comparable to other periods such as 1987 or 2008. On the other hand, the scale of the fiscal response globally was truly remarkable. Figure 1 below provides a graphical representation of the extent of the stimulus across global economies: while investors have focused on the US plan, the G7 economies have injected on average 16.2% of GDP into global economies, according to the IMF (not including the recent US plan, which amounts to 5% of the country’s GDP). This leads us to highlight two observations. First, the sheer scale of fiscal stimulus is unprecedented, being approximatively 1.5 times larger than during 2008. Second, unlike 2008, which was met with fiscal responses from just a few countries, the stimulus plan this time was deployed by a much larger group of countries: Fiscal support within the Euro area has been larger, and developing countries within Asia have done much more this time than after the Global Financial Crisis. The impact of this fiscal stimulus is amplified by the current low interest rate environment engineered by central banks. The question now is: have we seen the extent of the impact of these stimulus plans? We think not.
Figure 1: Primary Deficit to Gross Domestic Product Ratio by Country Zone (%)
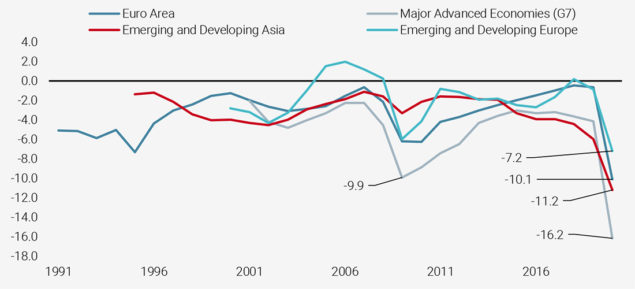
Source: IMF, Unigestion. Data as at 31.12.2020.
The impact arising from these stimulus policies will be both direct and indirect.
One key direct impact is the way governments spend the promised money to help their economies. Are we done with that? Not quite. According to our estimates in April last year, the main lockdown episode in 2020 cost around 3 to 5% of GDP growth depending on the economy in question. Since then, the proliferation of lockdowns and their asynchronicity has likely increased the overall impact to 5 – 7%. According to the IMF, world growth for 2020 should stand at around -4.4%, while professional economists are predicting -3.8%. Given that the world fiscal stimulus is much larger than this activity slump, where has the money gone? In short, into savings, both consumer (US households’ disposable income has increased by 13.6%, for example) and corporate (cash levels are up by 2% on revenues across US companies). Furthermore, we believe world consumption may be underestimated by many. Professional economists expect 4.6% growth in consumption in the US and Eurozone over 2021, which implies 2.4% and 3% in excess of long-term trends, respectively. That, in our opinion, is unlikely. We believe that consumption is set to creep higher than those figures, particularly in the US: above 5% consumption growth in 2021 would not surprise us, as shown in Figure 2 below.
Figure 2: US and Eurozone Consumption Growth (2-quarters Moving Averages) vs. Nowcaster-Implied Growth Projection
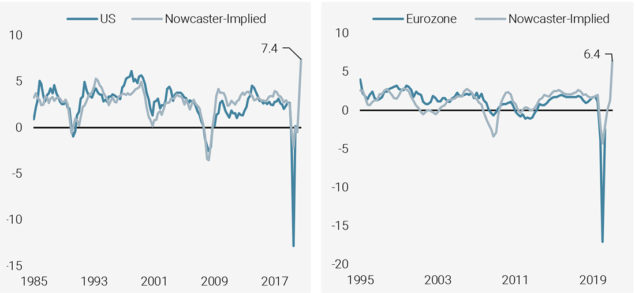
Source: Bloomberg, Unigestion. Data as at 30.11.2020.
Reading note: the 2021 nowcaster figures are expectations turned into consumption projections using a linear regression.
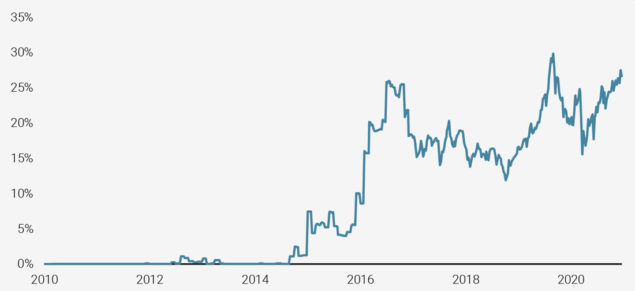
We believe this scenario is all the more likely because secondary indirect effects have not yet been felt in the economy. What do we mean by that? With low rates, low commodity prices and – in the case of the US – a lower dollar, there are untapped sources of consumption growth that will impact the economy slowly but surely in the quarters to come. One key element is the delayed impact of mortgage refinancing: longer-term rates have fallen, providing the opportunity for many households to refinance their debt at a lower cost. This will alleviate fixed costs, freeing up disposable income and boosting consumption. As illustrated in Figure 3 below, this refinancing activity remains limited when compared to 2008 and 2011 in spite of the significantly lower 10-year rates worldwide. Such a refinancing-related consumption boom usually lasts for two years, leading to a longer lasting indirect stimulation of consumption. Why is it different this time around? Because (1) central banks have made it clear that they will give governments time to get a handle on their debt stock pile and (2) as the Fed has clearly stated, selected central banks are ready to tolerate an above-target inflation rate in the future before acting against it. With this “lower for longer” mind-set, the refinancing boom will combine nicely with a myriad of other indirect factors supporting a growth in consumption. Once again, economists are greatly underestimating these effects, as many have never experienced such strong momentum.
Figure 3: Personal Consumption in the US vs. Mortgage Refinancing
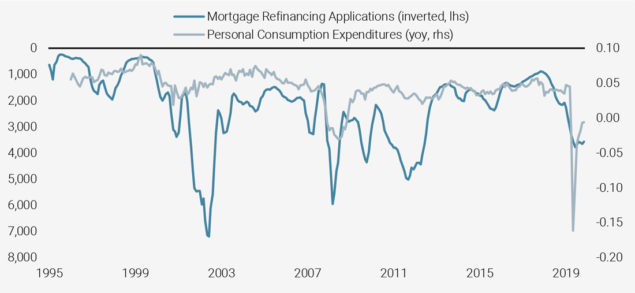
Source: Bloomberg, Unigestion. Data as at 31.10.2020.
Reflation Should Support Growth Assets
The fact that the economists’ consensus underestimates the likely strength of consumption growth next year does not mean that markets are not already priced for this rosy scenario. Figure 4 below offers a broad take on what analysts are expecting in terms of sales growth for 2021. On average, they expect companies within the MSCI World index to see 8% sales growth throughout the year, which looks ambitious: over the 2005-2020 period sales growth was only 2% on average. Economists also expect sales growth to be stronger than usual for European stocks and even more so for emerging market stocks, while US and tech-related industries are expected to barely outperform their 2005-2019 growth. With a 5% forecast in growth in consumption for both the US and Europe in 2021, and 10% in the emerging world (a conservative scenario, given the 1-to-3 ratio between their respective growth rates), we expect these sales growth numbers to be even stronger, especially for Europe and emerging countries. We do not disagree with analysts’ main call that we will see higher than usual sales growth numbers, but rather we disagree with the scale of it, and believe that these numbers are underestimated. In other words, our analysis suggests that the improvement is only partially priced in.
Figure 4: Analysts’ Expected Sales Growth in 2021 vs. 5%/10% DM/EM Base Consumption Growth Scenario
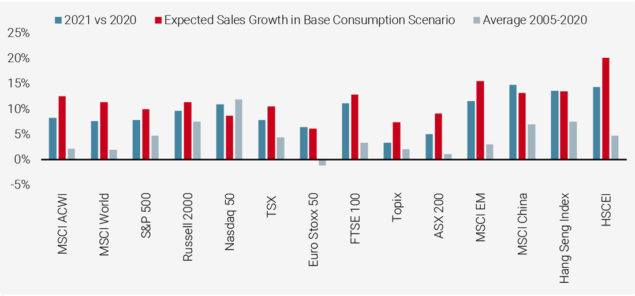
Source: Bloomberg, Unigestion. Data as at 20.12.2020.
Reading note: Expected sales growth scenario has been calculated by applying a linear regression between consumption growth in the US as a proxy for world consumption.
Much like the improving macro situation does not seem to be fully priced into expectations, market sentiment has also improved, but not yet fully recovered. The VIX index in 2020 saw dramatic swings, from 82 in March to 21 at the end of the year. This strong improvement was also reflected in credit spreads. High Yield spreads reached 1084 bps in the US in March and 870 bps in Europe, falling back to 400 and 350 bps, respectively at the end of 2020: here again, these are exceptional moves over a 12- month period. What now? With further expected macro improvement and pricing gaps in 2021, is sentiment already at full speed? We believe it is not, and that can be seen from multiple angles. First, in spite of the current lower VIX index, the term structure of its futures remains upward sloping and the far end of the curve remains quite high by historical standards (the August 2021 futures were still around 26% at the end of December 2020). Second, the skew of the VIX curve, which gives an idea as to whether investors are insuring themselves more against a drop or against a rise in equity markets, remains strongly tilted towards downside protection. Finally, investors’ positioning on growth assets – especially among global macro hedges funds and CTAs – have significantly further to go until we can say that the positioning normalisation is behind us. History tells us that recovery takes time and, despite the violent Vshaped recovery experienced in 2020, this normalisation process is likely to continue for some time. Figure 5 below highlights the recent evolution of our Market Stress Nowcaster: 2021 is not 2017 but some convergence towards similar historical levels should be expected.
Figure 5: Market Stress Nowcaster and Its Components
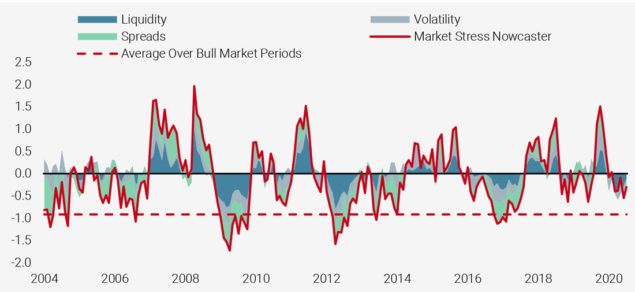
Source: Bloomberg, Unigestion. Data as at 30.09.2020.
Reading note: this chart shows the estimated beta of Macro Hedge Funds and CTA to world equities as proxied by the MSCI World index. The beta have been obtained from a 22-day rolling regression.
All of these factors point toward growth assets moving higher in 2021: better growth than expected, stillconservative expectations for corporate revenues and scope for sentiment to recover. However, this strong backdrop bears one main risk, that of a higher- to much higher-than-expected inflation. Moderate inflation would only be a prolongation of the reflation scenario described above. A stronger inflation surprise could disrupt markets and assessing this risk is essential. The first element is to assess what our consumption recovery scenario would mean for inflation. Current inflation expectations for 2021 remain conservative: professional economists predict US inflation to be around 2% and around 0.9% for the Eurozone by the end of 2021. Official forecasts from the Fed and the ECB are 1.8% (in the case of the PCE) and 0.2% for 2021, respectively. Where has inflation gone? We believe that inflation should normalise within the next three to five years (see our paper on inflation) but not over the shorter term. Figure 6 below draws a comparison between the growth rate of world consumption and world inflation: given the historical relationship that binds both, 5% consumption growth (our scenario) alone could lead to a worldwide inflation level of around 3.6%. At the end of December 2020, professional economists expected this number to reach only 2.7%, leaving some room for surprise. We believe this is a temporary and cyclical factor that will wane in the medium term, but will be relevant in 2021, especially when investing in fixed income. Our baseline scenario implies global inflation levels around 1% higher than expected – nothing less than reflation.
Figure 6: World Consumption Growth vs. 1-year Forward Change in Inflation
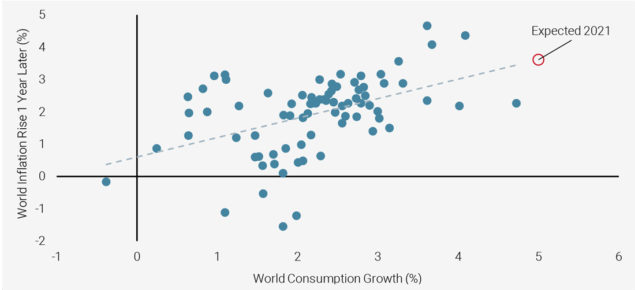
Source: Bloomberg, Unigestion. Data as at 30.09.2020.
Isn’t this reflation scenario already priced in? When looking at the slope of futures curves across commodity markets, gold futures are in a profound contango while copper and oil futures curves remain flat compared to historical levels, indicating rather subdued inflation pricing. Another approach is to compare the pricing of inflation breakevens. Figure 7 below demonstrates that inflation breakevens have a long-standing history of underestimating realised inflation, especially during recovery periods. The 1year US breakeven in 2009 averaged to 0 when the matching realised inflation hovered around 1.5%. A similar situation occurred in 2013 and 2015 during the European and Chinese recoveries – not to mention 2018. Currently the 1-year breakeven rate has reached 1.8%, hence a 3% inflation in the US would be unsurprising and little of it is priced for now. The potential brisk repricing of this poorly-reflected investment risk could potentially pose a serious threat to fixed income markets and, to a lesser extent, trigger volatile episodes across equity markets.
Figure 7: US 1-Year Breakeven vs. Realised Inflation in the US 1 Year Later
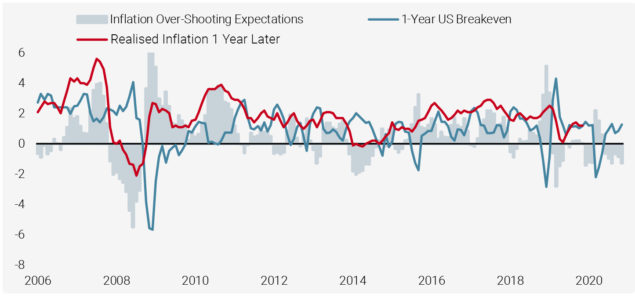
Source: Bloomberg, Unigestion.
Reading note: the light blue bars show the periods when inflation over/undershoots expectations. A positive reading is indicative of a realised inflation that is higher than the 1-year breakeven a year earlier.
To sum things up, we expect growth in consumption to beat expectations, triggering a poorly-expected but limited rise in inflation in its wake. From these two elements, we expect fixed income assets to disappoint while equities (with a preference for Europe and emerging markets) are much better prepared to benefit from this reflation environment. Now is the time to ask ourselves the key question: given our positive medium term scenario, what could go wrong?
Part 2 – What Could Go Wrong?
While our core scenario for 2021 calls for strong growth and rising-but-limited inflation pressures, the main macro risk in our view for coming quarters is a growth overshoot – not a growth undershoot – pushing inflation up much higher than we expect. To put things in a different way, our number one risk is not a “W” scenario but a larger-scale inflation acceleration – big enough to weigh on the mighty equities.
The Likelihood of a ‘W’ Scenario Remains Low
Starting with the downside risk, there are two elements that could weigh on the current recovery and positive sentiment: (1) short-term hurdles and (2) the mass of debt constraining growth below potential.
There are a number of short-term unknowns that will accompany the logistical challenge of vaccinating the world. As an illustration of this challenge, 25% of the US public remains hesitant about being inoculated and we observe similarities in several European countries. Moreover, reaching herd immunity next year requires that the first ever approved mRNA vaccines work well and that the new strain in the UK poses no new threat (virulence, vaccine resistance, etc.). Nevertheless, despite these potential negatives that could weigh on sentiment through reduced visibility, we believe that the odds of a new economic slump remain limited. Disappointment would modify the pace of the recovery, not the direction:
- Firstly, the different high frequency data that we monitor such as mobility or credit card payments show that the second round of lockdowns have had a much lesser impact on the global economy than the first one. In our view, when lows tend to be higher and higher, it signals improvement: today, global growth is much more robust than in Q1 2020.
- Secondly, the first lockdowns happened to be synchronised around the world. Today, the situation is different. Several economic areas are currently facing a resurgence in the pandemic but many are not. Also, the rate of propagation is much lower this time around. Asia, Africa and Oceania are all actively pursuing their recovery, helping to rebalance the sources of global growth and leading to a sharp increase in global trade. Comparing global trade to the recent rebound in cyclical commodities illustrates perfectly the quality and thus the sustainability of the current economic rebound (Figure 8).
In our view, these two elements should prevent the world economy from experiencing a second slowdown.
Figure 8: Cyclical Commodities and Global Trade
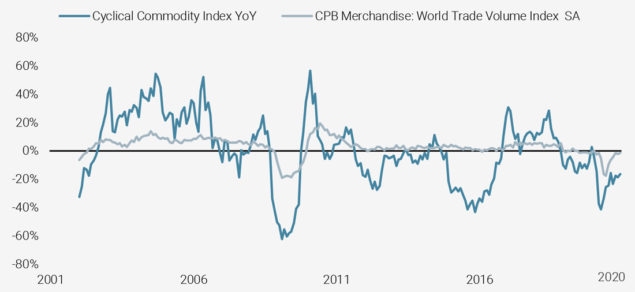
Source: Bloomberg, Unigestion, Data as at 22.12.2020.
Regarding the mass of debt on balance sheets, several economic institutions such as the IMF recently highlighted the exponential growth in debt-to-GDP ratios. According to the IMF, the COVID-19 crisis is expected to push global public debt above 100% of GDP in 2020, the highest ever for the global economy. We observe a similar pattern among corporates, where the number of companies that have increased their borrowing from banks to cope with cash shortage, refinance their debt, or build precautionary buffers has exploded. In normal times, without the policy support that facilitated such borrowing, nonfinancial firms would have seen a sharp rise in bankruptcies. This situation raises two challenges: first, a financial one as liquidity pressures may morph into insolvencies as the crisis continues to unfold and a cascade of bankruptcies meets a wall of high asset valuations. Second, it also raises a macro challenge: a reduction of potential growth due to the rising cost of debt that limits spending from those debtors.
These risks would have been the crucial ones during normal times. Nevertheless, with the generalisation of QE, normal times are long gone – or so it seems. Firstly, the current combination of accommodative monetary policy combined with fiscal supports have created a further excess of savings over investment, lowering interest rates. This should keep the cost of debt at a low level for most countries and corporates. Secondly, the expanding asset purchases from central banks mitigates the risk of a funding crisis: short and long-term liquidity is abundant. Figure 9 below shows the proportion of bonds with negative yields in the Bloomberg Global Aggregate index and reflects perfectly these two effects. Despite a sharp decline in the equity risk premium and the compression of credit spreads, nominal bond yields have not increased over the period, benefiting from high liquidity and continuing purchases from central banks.
Figure 9: Proportion of Negative Bond Yields in Barclays Global Aggregate Bond Index
Source: Bloomberg, Unigestion. Data as at 18.12.2020.
The Risk is an Inflation Overshoot
In our view, this positive change in sentiment, coupled with the accommodative policy mix – reflected by the latest statements from the Fed and the ECB, and the new fiscal stimulus in the US – puts a new risk on the horizon: uncontrolled inflation.
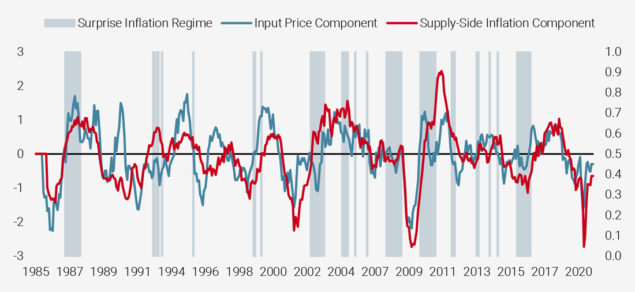
A significant inflation surprise results from the confrontation between realised inflation and expectations. As mentioned earlier, inflation is anticipated to remain well below central bank targets for the next two years. However, we have recently started to observe changes in our inflation indicators. Our Inflation Nowcasters and Newscasters have recovered sharply from their low levels, notably in the US (Figure 10). In the meantime, inflation expectations have also been on the rise. Inflation already seems to be on its way but could the surprise be larger than what we expect? In our opinion, the bulk of the surprise should come more from the too-low expectations than from realised inflation hitting levels not seen in decades. What could prove us wrong?
Figure 10: US Inflation Nowcaster Components vs. Inflation Surprise Regimes
Source: Bloomberg, Unigestion as of 31.12.2020.
Reading note: this chart compares the evolution of the input price and supply-side components within our US Inflation Nowcaster to periods of inflation surprises. These periods are defined as periods of inflation higher than consensus estimates, with this difference between realised and expected inflation being on the rise.
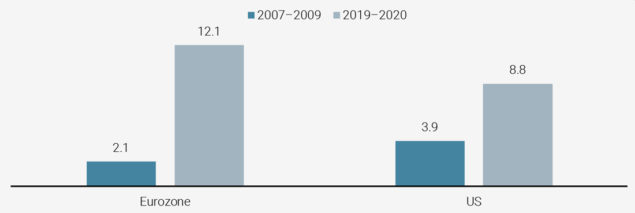
Historically, rising inflation pressures are generated by an imbalance between demand and supply. For the first time in several decades, the risk of facing both a surge in demand and constrained supply in 2021 is far from negligible. On the demand side, the jump in saving rates as a precaution creates a large cushion in case of a “W” scenario. However, importantly it also creates a stratospheric “reserve of consumption” that could be unleashed if the pandemic is resolved and euphoria takes hold: our baseline scenario implies a 5% consumption growth but this could reach even higher ground if savings violently revert back to their pre-crisis levels. In the case of greater visibility, the savings glut would be translated into exploding household consumption. Both would provide significant upward pressures on the prices of goods and services. Figure 11 illustrates the exceptional scale of precautionary savings, which could fuel consumption and investment in the case of improved clarity.
Figure 11: Change in Saving Rates 2020 vs 2008 as % of Disposable Income
Source: Bloomberg, Unigestion. Data as at 30.09.2020.
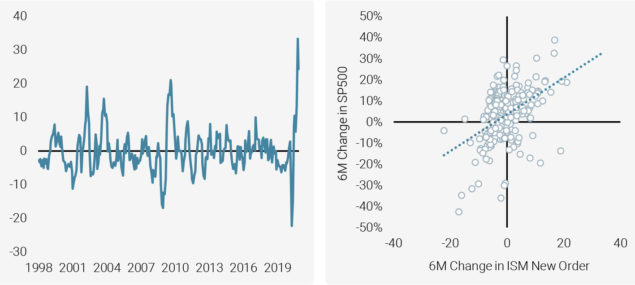
At the same time, the risk of a supply shock is considerable as lockdowns and the lack of visibility have damaged several sectors’ current and future capacities. This risk of supply shock could affect “old” industries such as those in the commodity complex that have cut their capacity and capex over recent years because of smaller anticipated demand and lower profitability. It would also impact activities and services boosted by recent changes in climate policies. For instance, activities related to electric vehicles and the need for batteries will require higher use of metals such as cobalt or services to clean depleted batteries. While the transition from one world to another is rarely linear, any excess in demand will lead to higher prices in some areas because supply will take time to respond. As reflected by the New Orders component of the ISM Manufacturing and Services surveys, the current situation is already truly exceptional (Figure 12, left): rarely has the second derivative of demand been so strong. Typically, such a surge in demand would support risky assets as shown in Figure 12, right. Nevertheless, that would also increase the risk of inflation surprise.
Figure 12: 6-Month Change in US Manufacturing and Service New Orders (left) and Compared to 6-Month Returns on the S&P 500 Index
Source: Bloomberg, Unigestion as of 30.11.2020.
The good news is that there is still time to hedge against it. Sentiment for inflation-related assets has remained quite tepid so far in light of the uncertain future of inflation. Typical securities used to protect a portfolio against inflation are breakeven swaps and commodities. Figure 13 below shows the beta of macro hedge funds to these assets when combined into a basket. The chart illustrates how this beta crept up between summer 2017 and Q2 2018 as inflation continued to surprise investors to the upside. Today, their beta to this inflation basket lies at the lower end of its recent history and this is not only the case for macro hedge funds: CTAs also find themselves in a similar situation, directly or indirectly. How big does the inflation surprise need to be to see sentiment for these assets recover? In September 2017, economists were forecasting US inflation to reach 2% in 2018. However, when it edged 50 bps higher (2.5% at the end of 2018), it sent shock waves through markets. Keeping in mind the significance of the inflation risk for 2021, we think it is time to add protection against it, either by having a positive stance on commodities or by using breakevens. Sectorial bias could be another way to participate in an inflation acceleration: financials for instance have lagged because rates have remained low. Increasing our allocation to inflation assets seems to make the most sense in order to protect our positive view on growth assets discussed earlier.
Chart 13: Hedge Fund Realised Beta to Inflation Assets
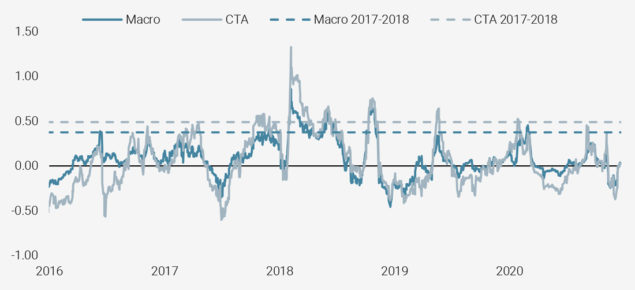
Source: Bloomberg, Unigestion
Reading note: this chart illustrates the estimated beta of Macro Hedge Funds and CTAs compared to a basket of breakeven inflation swaps and commodities. The betas have been obtained from a 22-day rolling regression.
At this stage of the recovery – and despite huge increases in public debt and central bank balance sheets – uncontrolled inflation remains a risk to us, not a scenario. The usual sequence of a recovery implies that first it will have to give clear signs that it is strong and sustainable enough before mutating into an inflationary situation. This usually takes a few quarters at least. In addition to this idea of a natural sequence, there are also structural obstacles which we believe should moderate a rise in inflationary pressures. We call them “the three Ss”: Savings (still high), Slack (still significant) and Secular Trends (digital revolution). This means that the inflation acceleration should only be temporary, although it can still be devastating to markets. We are of the opinion that a positive view on inflation assets today pairs well with a positive view on growth assets.
Conclusion
Given the continued economic recovery and our expectations of further normalisation in sentiment, we retain a positive view on growth assets. We also expect that this positive environment will coincide with building inflation pressures, taking some market participants by surprise, which is why we prefer a mix of both growth and inflation-oriented assets that should most directly benefit if our core scenario comes to pass. If we are wrong, it will most likely be due to an inflation overshoot that threatens markets, rather than a second dip into global recession. We expect in 2021 to combine a positive view on growth assets with a positive view on inflation assets. The latter should protect growth assets, should inflation exceed our expectations. Nevertheless, we continue to monitor both scenarios closely as their impact (especially the latter) would have significant consequences, both for markets and for our portfolios.
Important information
This document is provided to you on a confidential basis and must not be distributed, published, reproduced or disclosed, in whole or part, to any other person.
The information and data presented in this document may discuss general market activity or industry trends but is not intended to be relied upon as a forecast, research or investment advice. It is not a financial promotion and represents no offer, solicitation or recommendation of any kind, to invest in the strategies or in the investment vehicles it refers to. Some of the investment strategies described or alluded to herein may be construed as high risk and not readily realisable investments, which may experience substantial and sudden losses including total loss of investment.
The investment views, economic and market opinions or analysis expressed in this document present Unigestion’s judgement as at the date of publication without regard to the date on which you may access the information. There is no guarantee that these views and opinions expressed will be correct nor do they purport to be a complete description of the securities, markets and developments referred to in it. All information provided here is subject to change without notice. To the extent that this report contains statements about the future, such statements are forward-looking and subject to a number of risks and uncertainties, including, but not limited to, the impact of competitive products, market acceptance risks and other risks.
Data and graphical information herein are for information only and may have been derived from third party sources. Although we believe that the information obtained from public and third party sources to be reliable, we have not independently verified it and we therefore cannot guarantee its accuracy or completeness. As a result, no representation or warranty, expressed or implied, is or will be made by Unigestion in this respect and no responsibility or liability is or will be accepted. Unless otherwise stated, source is Unigestion. Past performance is not a guide to future performance. All investments contain risks, including total loss for the investor.
Unigestion (UK) Ltd. is authorised and regulated by the UK Financial Conduct Authority (FCA) and is registered with the Securities and Exchange Commission (SEC). Unigestion Asset Management (France) S.A. is authorised and regulated by the French “Autorité des Marchés Financiers” (AMF). Unigestion Asset Management (Canada) Inc., with offices in Toronto and Montreal, is registered as a portfolio manager and/or exempt market dealer in nine provinces across Canada and also as an investment fund manager in Ontario, Quebec and Newfoundland & Labrador. Its principal regulator is the Ontario Securities Commission. Unigestion Asset Management (Düsseldorf) SA is co-regulated by the “Autorité des Marchés Financiers” (AMF) and the “Bundesanstalt für Finanzdienstleistungsaufsicht” (BAFIN). Unigestion SA has an international advisor exemption in Quebec, Saskatchewan and Ontario. Unigestion SA is authorised and regulated by the Swiss Financial Market Supervisory Authority (FINMA). Unigestion SA’s assets are situated outside of Canada and, as such, there may be difficulty enforcing legal rights against Unigestion SA.
Document issued: January 2021.