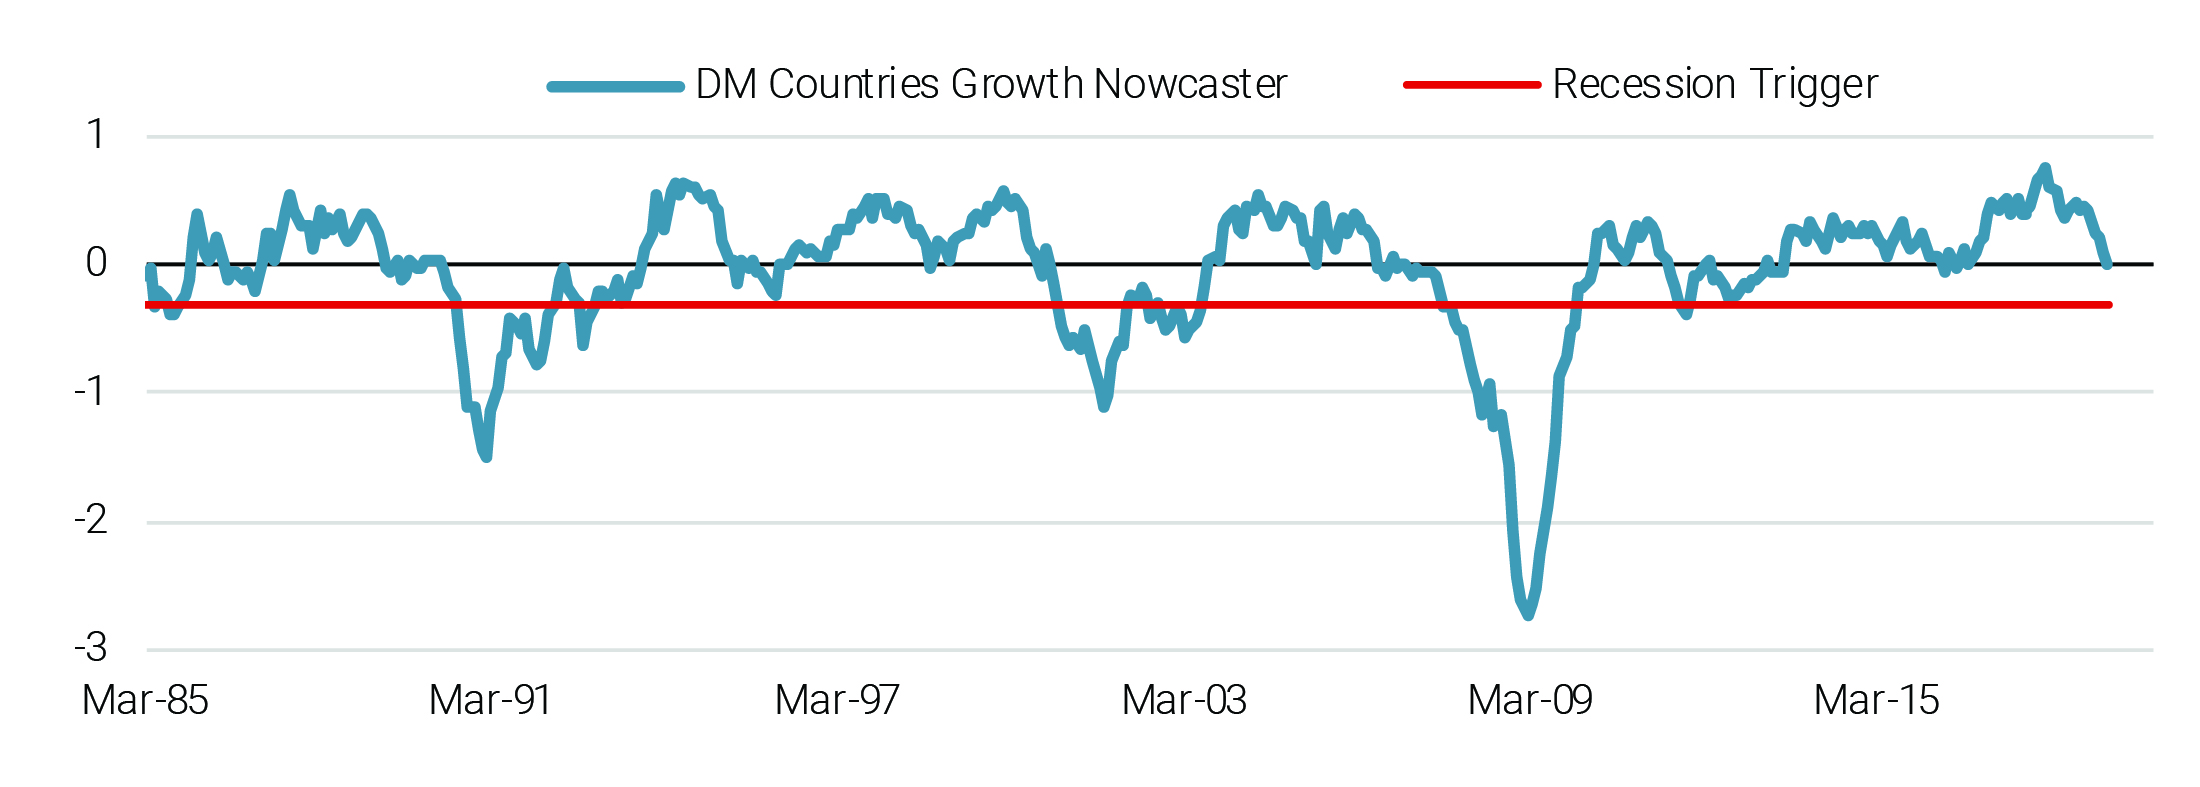
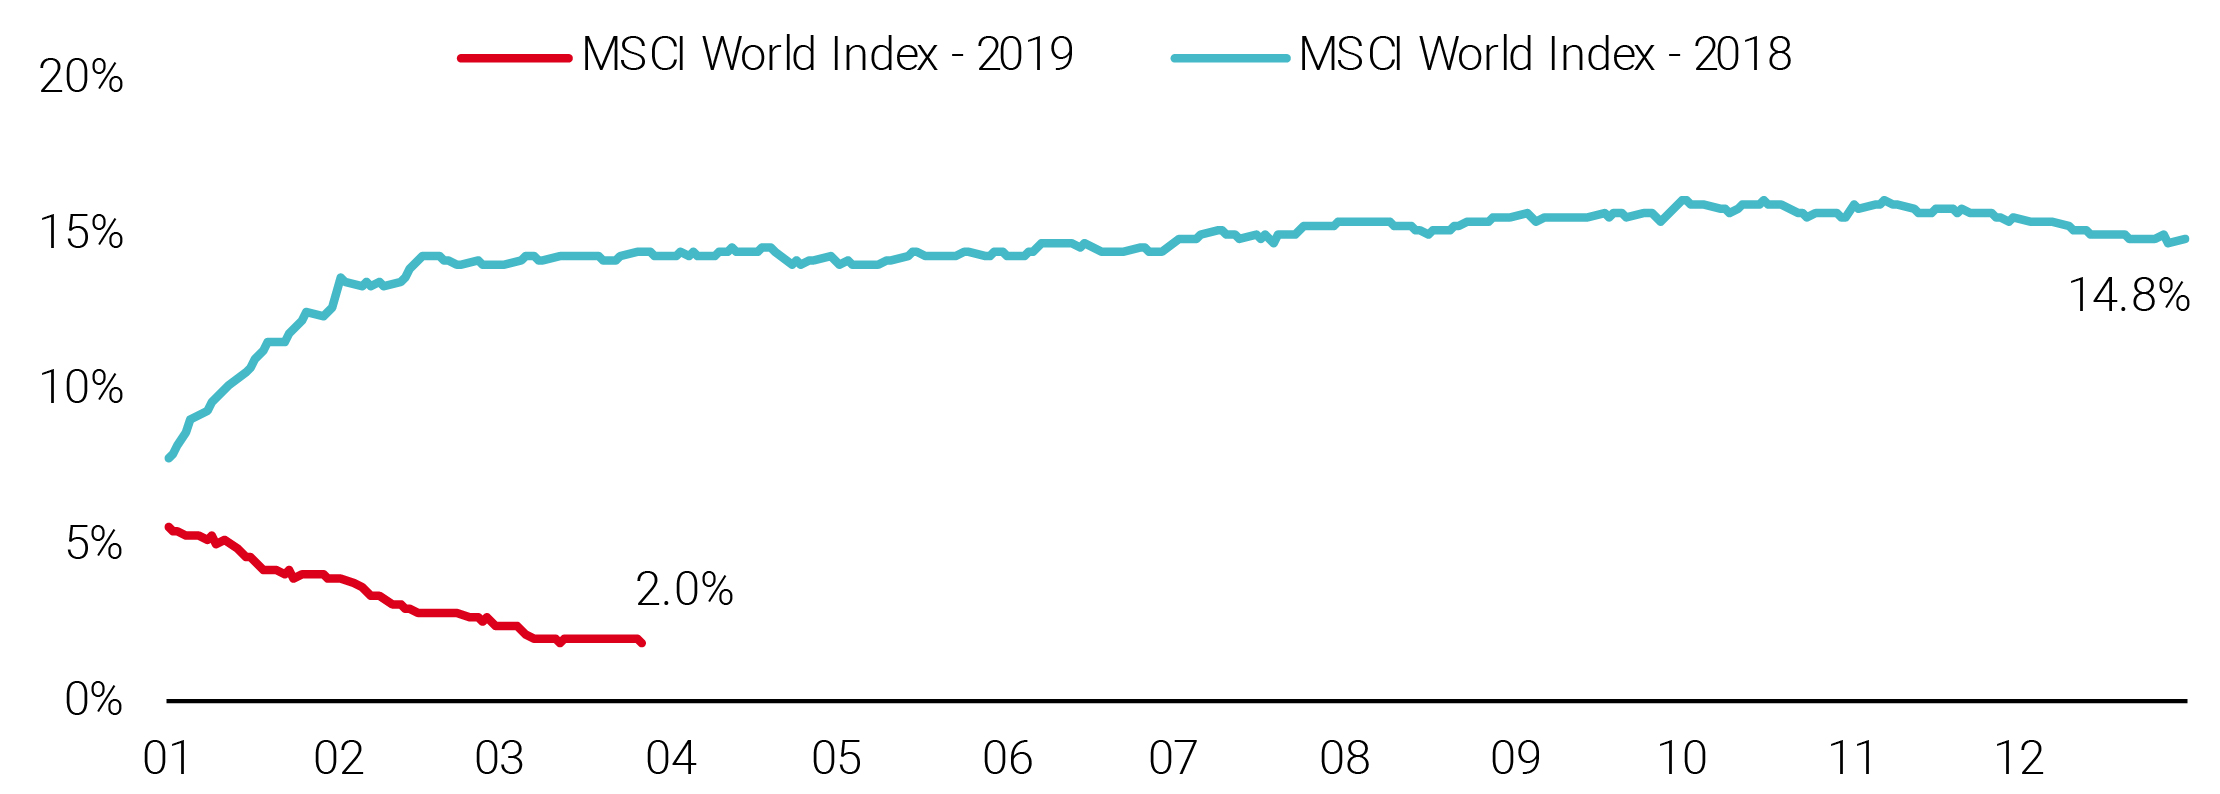
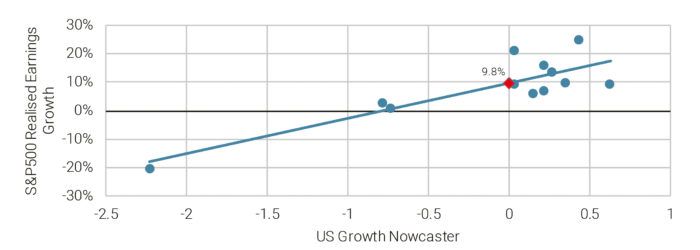
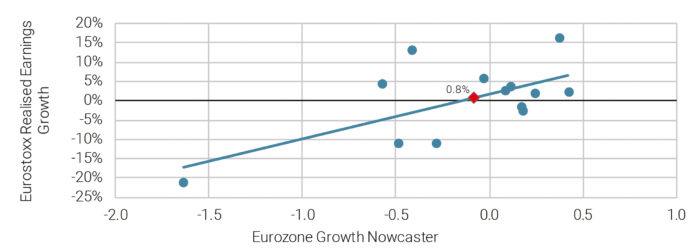
We have long held the view that the current deceleration in global growth is a significant risk to growth-related markets. But the valuation gap that appeared at the end of last year, combined with the change in the policy stance of most central banks have conspired to prove us wrong: markets rallied as bonds delivered positive returns. However, we believe that growth deceleration will likely continue: it has been continuous and significant, and rarely in the past have such episodes ended just as things stand today. The Eurozone is especially at risk, having endured most of the storm thus far, with even Germany showing significant signs of a sharp slowdown. This situation has been widely acknowledged by central bankers, whose change in policy stance has lifted equity and bond markets. For Q2, we believe equity valuations are at risk: valuations are much higher than last December and the coming earnings season is likely to bring a stream of disappointing news and forward guidance. Sentiment will likely take the upper hand at some point during the quarter and that prompts us to be on the defensive side. Moreover, we see a limited number of elements that could reverse this situation. Higher equity valuations amid macro deceleration suggests that markets are complacent and we remain cautious. Readers who follow our market reviews will know that we have held a somewhat bleak outlook for the current economic cycle since the last quarter of 2018. Our view is based mainly on the output of a proprietary set of economic indicators called “Growth Nowcasters”, designed to assess recession risk in real time. These indicators aggregate and analyse more than 600 economic data series across 21 economies, both developed and emerging. Chart 1 shows the aggregated evolution of our Growth Nowcaster for developed markets (DM) alongside its historical recession threshold. Chart 1: Percentage of Improving Data Across Developed Economies Over the Past 18 Months Source: Bloomberg, Unigestion (as of 27 March 2019). The orange arrow highlights the 2009 recovery while the red one, the current slowdown. We can draw three conclusions from this chart: Markets started pricing in this slowdown markedly in Q4 last year with the MSCI World index losing around 18%: a significant drawdown. Since then, it has staged an impressive recovery of a magnitude comparable to the drawdown. The pace and scale of this recovery could easily be compared to the 2009 recovery. Are both recoveries similar? Answering this question is key to anticipating what is coming next. Over the first quarter of 2019, we witnessed an exceptional market recovery from the lows of last December. Such recovery times are typical of post-recession periods such as 2009, 2012 or even 2016 as recession fears faded. How similar is the current situation? We can think of two key differences. First, the year started with what we call a “valuation gap”, which is to say that equity valuations in January were very cheap, in our view. In Chart 2, we illustrate our cross-asset valuation calculations based on the carry attached to each risk premia. Chart 2: Unigestion CAS’s Cross-Asset Valuation Indicator Source: Bloomberg, Unigestion (as of 27 March 2019) From this angle, it is clear that DM equities were very cheap – as they tend to be after a slowdown. The key difference today, however, is the trigger to the recovery. After most previous slowdowns, as clearly depicted in Chart 1, the recovery happened on the back of a strong improvement in economic conditions. As already mentioned, today’s situation is very different: growth is decent yet decelerating while over the past three periods of slowdown/recession, it was low and improving. This time, growth was not the origin of the market recovery. Second, the trigger to the Q1 recovery was the significant change in tone adopted by most DM central banks. Both the US Federal Reserve (Fed) and the European Central Bank (ECB) acknowledged the slowed growth. The Fed continuously downgraded its assessment of its own policy, improving market sentiment. “Bad news” started to be “good news” all over again as deteriorating data opened the door to central bank support to markets. As depicted in Chart 3, in October last year markets expected the Fed to hike rates. Currently, one rate cut is expected within the next 12 months and another within the following 12 months, a very significant change in expectations that induced a large market recovery. As rates went down, equities crept up. Chart 3: Evolution of Market Expectations for Fed Interest Rate Changes Source: Bloomberg, Unigestion (as of 27 March 2019) In summary, markets rose over the first few months of 2019 because (1) valuations were low on an historical basis while (2) the collapse in rates fuelled a discount factor-driven revision of the price of equities. This situation is problematic for two reasons: first, market valuations are now likely to be very sensitive to any change in sentiment and second, the change in the tone of central banks must be sufficient to offset the direction of macro data for markets to stay where they are for now. We see both elements as being at risk and here are the reasons why. If, from a cross-asset perspective a yield comparison makes sense, in the case of equities, multiple valuation dimensions can be analysed. Where do equity valuation metrics stand relative to history? The case of the S&P 500 index is probably the most obvious: its P/E ratio stands in its 70th percentile over the 1990-2019 period, while its price-to-book ratio lies in its 95th percentile (the higher the percentile, the higher the relative valuation). Its CAPE (Cyclically Adjusted P/E ratio) is in its 78th percentile over the same period. In terms of averages across all the metrics we are looking at, the index reached its 77th percentile, high valuations even when considering forward-looking metrics instead of trailing ones. However, valuations are not consistently high across geo-graphical indices. From our spectrum of metrics, the TOPIX index looks the cheapest alongside the FTSE 100 while the Euro Stoxx 50 stands in between, alongside the MSCI Emerging Markets index: a significant valuation disparity. Quite naturally, higher valuations imply a high sensitivity of market prices to bad news, but not always: a higher price can be indicative of a higher quality. So why are we so cautious about these valuations? With such high valuations, it is essential to compare what markets are expecting in terms of earnings growth for 2019 with analysts’ expectations and our own. As illustrated in Chart 4, an implied earnings growth model, turning equity indices’ levels into implied expected earnings growth, shows what hides behind these valuations. Chart 4: Stock Indices’ Implied Earnings Growth Source: Bloomberg, Unigestion (as of 27 March 2019) Market participants now expect a 14% year-on-year increase in earnings from S&P 500 companies. In the case of the Euro Stoxx 50, this number reaches 9% while it is still negative in the case of the FTSE 100, the TOPIX and EM equity indices. For the MSCI World index, earnings are expected to rise by 11% this year. Compare these numbers to analyst expectations, illustrated in Chart 5. Chart 5 MSCI World index’s Earnings Growth as Expected by Analysts Month by Month Source: Bloomberg, Unigestion (as of 27 March 2019) Earnings growth expectations started the year at about 5% – which implies a world nominal growth rate of about 3%. Since then, and in light of the macro deterioration, this number has been continuously revised downwards to 2% at the end of March. There is a clear discrepancy between what analysts are expecting and what markets are pricing. We agree with the analysts. Chart 6 compares the US and Eurozone Growth Nowcasters with realised corresponding equity earnings growth. Chart 6: US (Top) and Eurozone (Bottom) Growth Nowcasters vs. Local Stock Indices (S&P 500 and Euro Stoxx 50) Source: Bloomberg, Unigestion (as of 27 March 2019). The red diamond represents the earnings growth forecast for 2019 if current Nowcaster levels persist. Both nowcasters declined significantly over the past 12 months: the US one reached the zero line while the Eurozone one is now firmly below zero. A simple regression can be run in order to connect realised earnings growth and these macro indicators. The outcome supports our case: in the US, a 10% earnings growth is achievable while in the Eurozone, a 1% earnings growth would be consistent with the most recent readings of our indicator – assuming that these macro indicators remain where they stand for now. Markets should be prepared for disappointment as the earnings season starts to unfold, which brings us to our second key topic: can central banks work their magic and once again lift economies amid a slowdown? We have recently witnessed a rapid deceleration across most developed economies and we are of the opinion that this deceleration will likely continue this year. Here is why. In our view, 2018–2019 is more of a European story. Our Growth and Inflation Nowcasters in the Eurozone are consistently showing signs that the region is on the verge of a recession. Early in 2018, it was always easy to find a good explanation for the slowdown: initially, the 2018 winter had been hard, weighing on the zone’s activity. Then, the car-makers’ issues started weighing on the mood of purchasing managers. Eventually, most data series across the majority of sectors in the Eurozone began to tell the same story: strong and continuous deceleration hitting all economies of the zone alike – even the mighty Germany. Chart 7 shows the daily evolution of the percentage of improving data across the Eurozone. Chart 7: Eurozone Growth Nowcaster’s Diffusion Index (Percentage of Improving Data) Source: Bloomberg, Unigestion (as of 27 March 2019)MiViews Q2 2019: Cautiousness: the Remedy for Complacency
OVERVIEW
THE DEVELOPED WORLD IS SLOWING DOWN
THANKS, MR. POWELL
THE FRAGILE RECOVERY
ANOTHER U-TURN IN THE CYCLE?
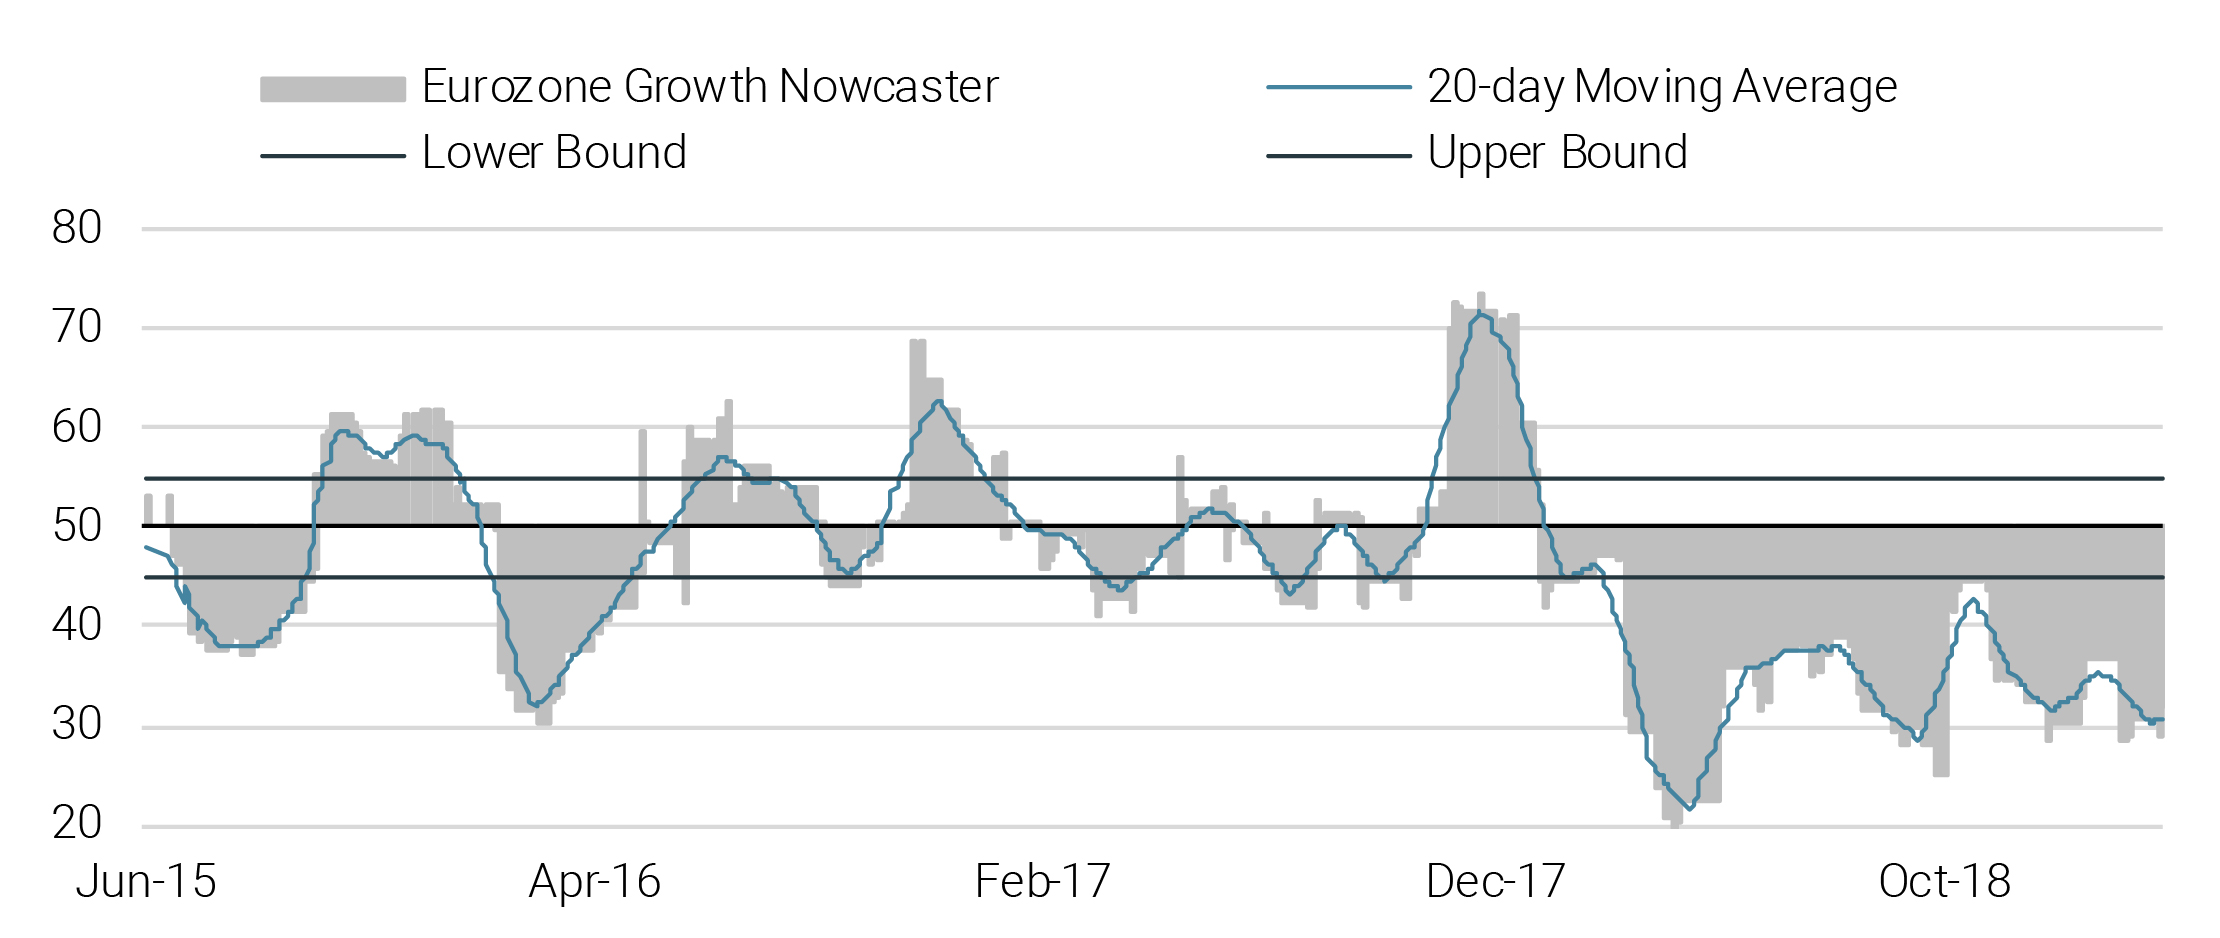
Since February 2018, on average, about 65% of the data came out at lower levels: from the analysis of the chart, this situation looks extraordinary. To some extent, it looks like the 2011 deceleration of the Eurozone with a few differences: first, growth was much stronger in the Eurozone in 2010 than in 2018, reaching 2.4% vs. 1.1%. Second, Germany was somewhat sheltered from the 2011 deceleration and still growing by 2.4% whereas in 2018, Germany only grew by 0.6%: a substantial difference. Finally, the ECB had not started its QE program in 2011. Today it holds about 20% of bond markets and recently initiated a new round of its long-term refinancing operation (LTRO). There is now limited scope to create a significant monetary policy response. Over the past two quarters, the ECB has acknowledged the fact that the zone is slowing down at a fast pace: we are worried and the ECB is worried. Only markets are – for the time being – not worried. How so?
There are three reasons that could lead markets to think that the Eurozone’s slowdown could deviate from this recessionary path.
3. Global trade is at risk. Even if 85% of Eurozone members’ external trade is done with a country from the zone, a contraction in world trade would be bad news. The OECD expects that an all-out trade war would imply a 2% decline in world trade. By our calculations, this drop could lead to a -0.4% contribution to Eurozone growth (see Chart 8), as world trade contractions usually lead to spiralling effects across countries. A positive settlement of this issue would leave the Eurozone’s situation unchanged. A worsening of this situation would clearly both offset the benign impact of lower oil prices and of the Chinese stimulus. World trade cannot be a net positive, but it can become a strong net negative.
Chart 8: Potential Impact of Different Macro Events on the US and the Eurozone GDP in 2019 Source: Bloomberg, Unigestion (as of 27 March 2019) The Eurozone is the focus of our concerns from a macro standpoint but it is not the only bloc that is slowing down. The broad base of the slowdown makes it very different from 2015: central banks in their current state will have a hard time lifting the world economy. Take the example of the US as presented in Chart 9: every economic sector slowed in a consistent way over the past 12 months. Here again, the Fed is getting cautious – it is not just us. Chart 9: US Growth Nowcaster’s Decomposition by Economic Sectors Source: Bloomberg, Unigestion (as of 27 March 2019) For these different reasons, we see a limited upside potential across equities. Markets have priced in an end to the slowdown, while low inflation will limit any further central bank tightening. Forecasting a recession is always difficult, yet we are seeing clouds accumulating above the Eurozone’s sky in particular. The Eurozone is no island and trades actively with many partners, exporting its slowdown. Even growth stabilisation would not make equity markets look attractive as they are increasingly likely to be dependent on market sentiment – typically a volatile component of market price action. With the rally observed so far, we are now underweight growth assets. Most of our underweight growth assets concentrates on credit where we expect the current slowdown to hit first should it continue in 2019: credit spreads are usually the first to widen in such a scenario. We also have a preference for government bonds as they still offer an appealing level of protection (especially US, Canadian and Australian bonds) in case of a downturn, while still offering positive carry. We have had a cautious stance for some time now, and in our view, our case is even stronger today than it was last December. Important Information This document is provided to you on a confidential basis and must not be distributed, published, reproduced or disclosed, in whole or part, to any other person. The information and data presented in this document may discuss general market activity or industry trends but is not intended to be relied upon as a forecast, research or investment advice. It is not a financial promotion and represents no offer, solicitation or recommendation of any kind, to invest in the strategies or in the investment vehicles it refers to. Some of the investment strategies described or alluded to herein may be construed as high risk and not readily realisable investments, which may experience substantial and sudden losses including total loss of investment. The investment views, economic and market opinions or analysis expressed in this document present Unigestion’s judgement as at the date of publication without regard to the date on which you may access the information. There is no guarantee that these views and opinions expressed will be correct nor do they purport to be a complete description of the securities, markets and developments referred to in it. All information provided here is subject to change without notice. To the extent that this report contains statements about the future, such statements are forward-looking and subject to a number of risks and uncertainties, including, but not limited to, the impact of competitive products, market acceptance risks and other risks. Data and graphical information herein are for information only and may have been derived from third party sources. Although we believe that the information obtained from public and third party sources to be reliable, we have not independently verified it and we therefore cannot guarantee its accuracy or completeness. As a result, no representation or warranty, expressed or implied, is or will be made by Unigestion in this respect and no responsibility or liability is or will be accepted. Unless otherwise stated, source is Unigestion. Past performance is not a guide to future performance. All investments contain risks, including total loss for the investor. Document issued: April 2019.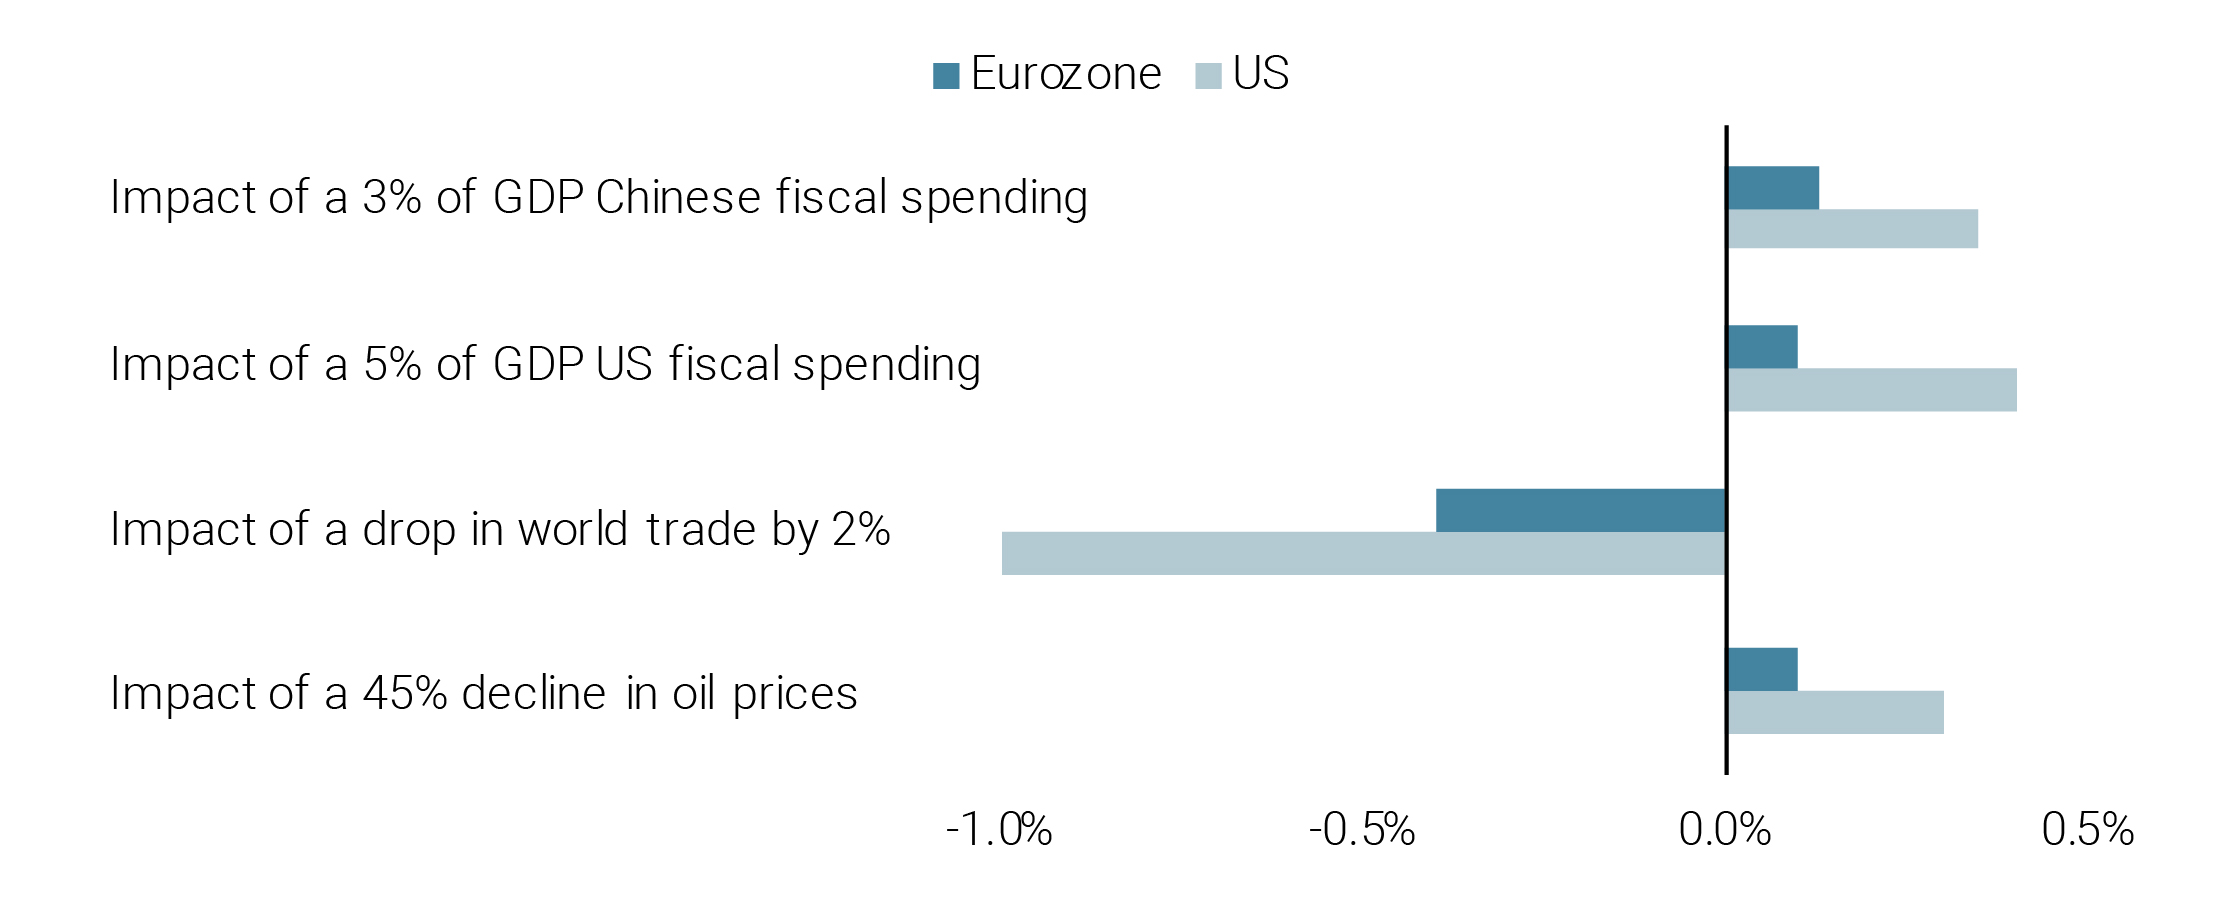
CAUTIOUSNESS IS THE BEST REMEDY FOR COMPLACENCY