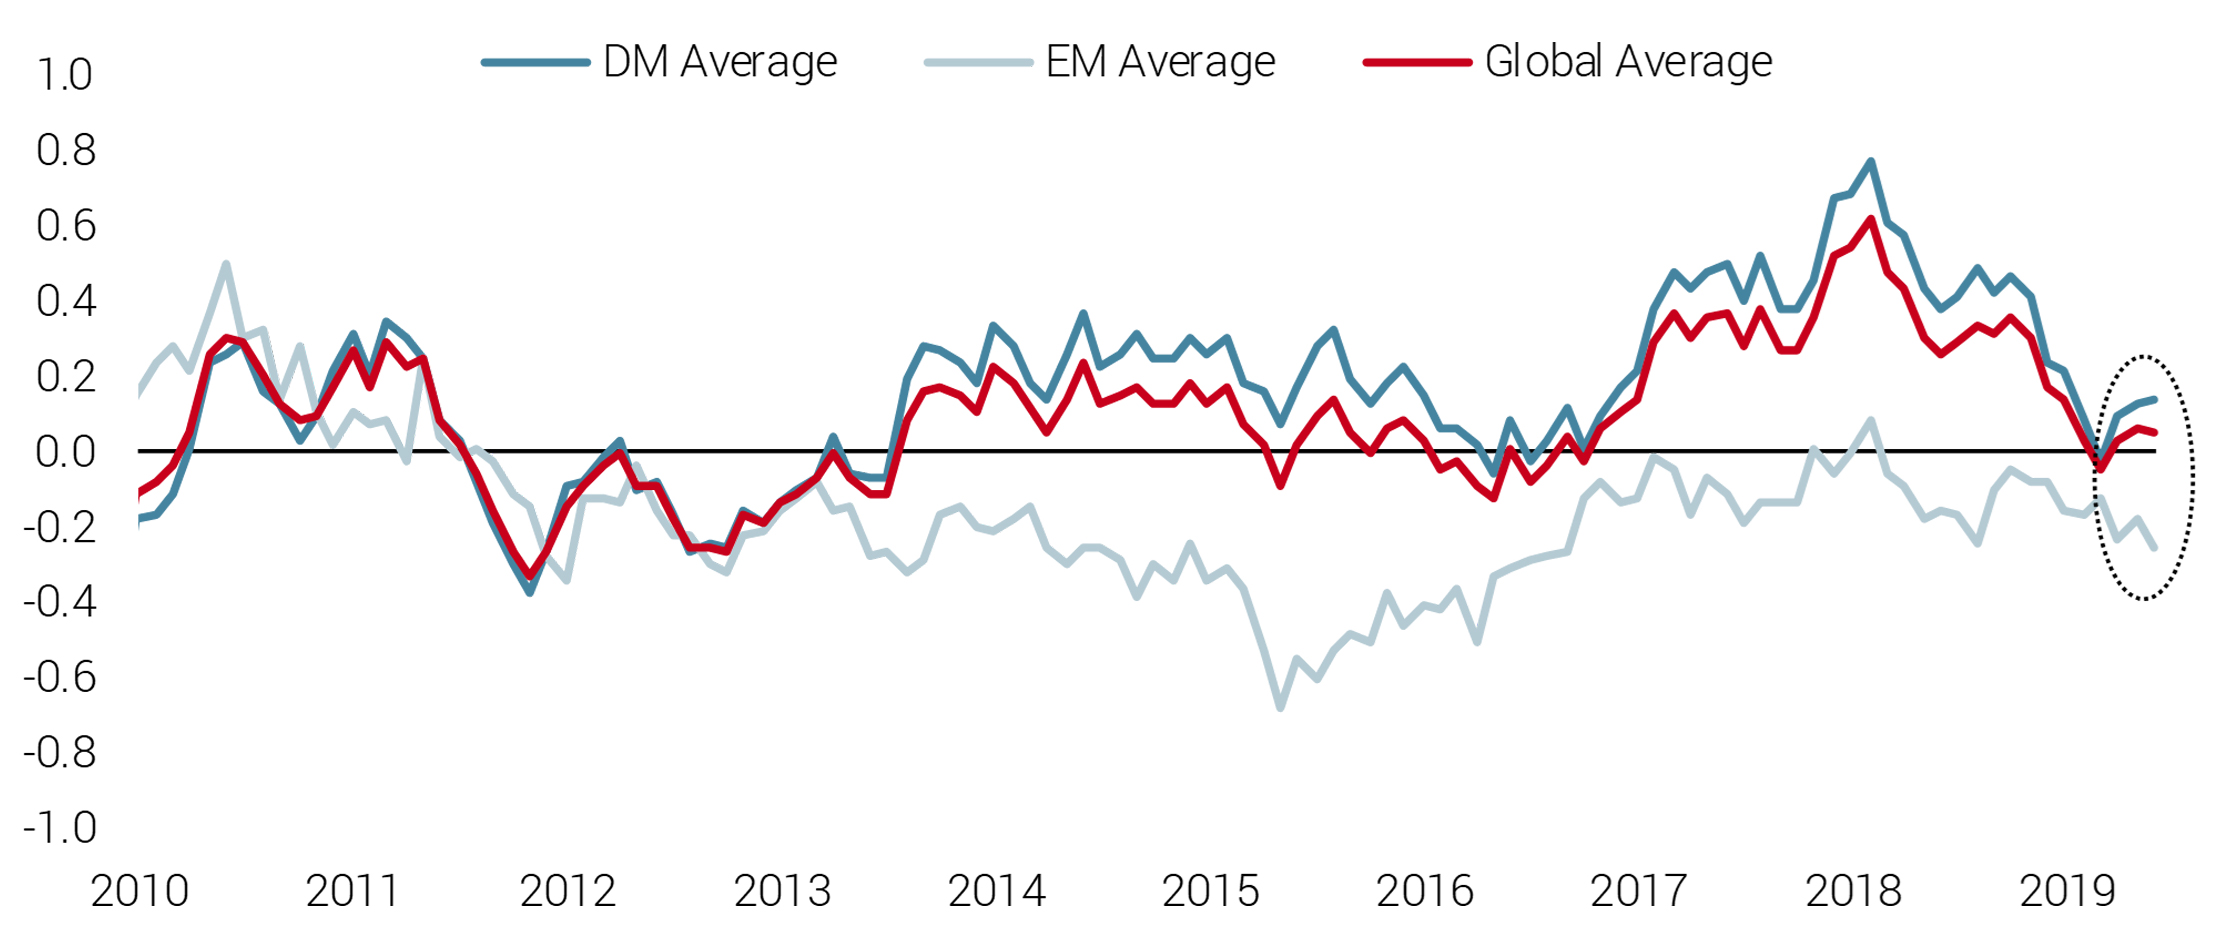
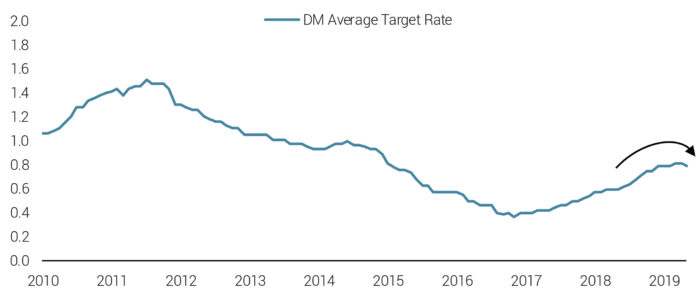
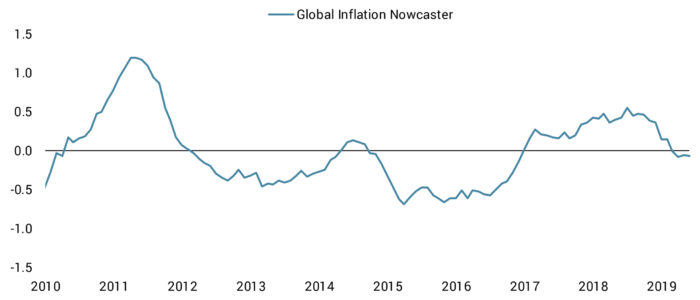
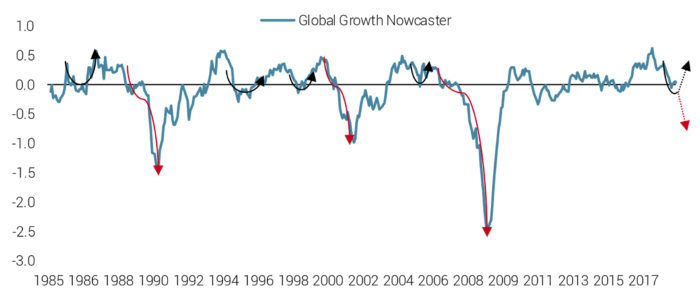
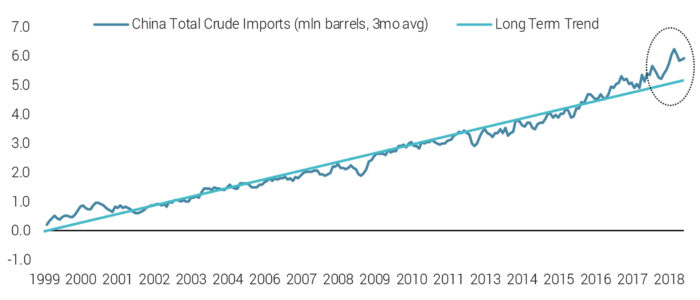
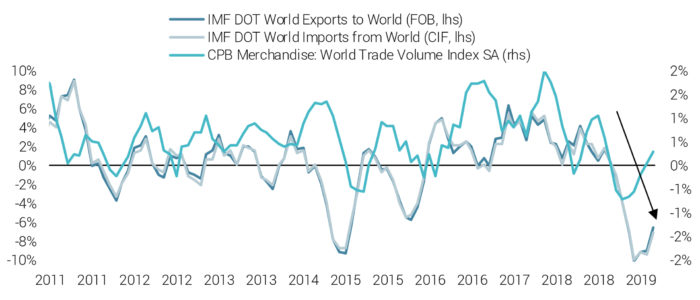
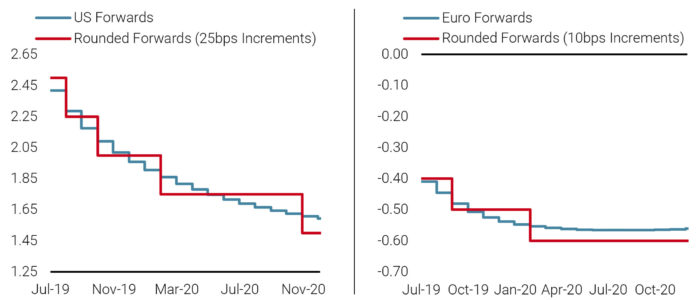
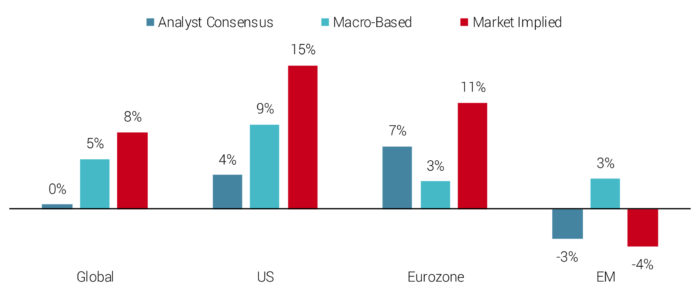
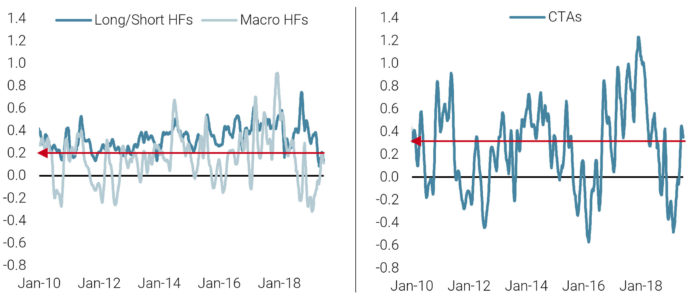
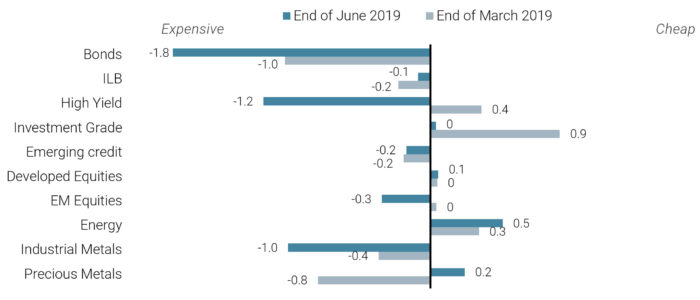
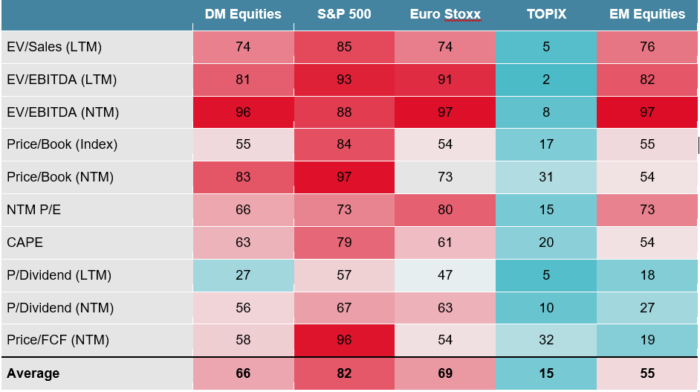
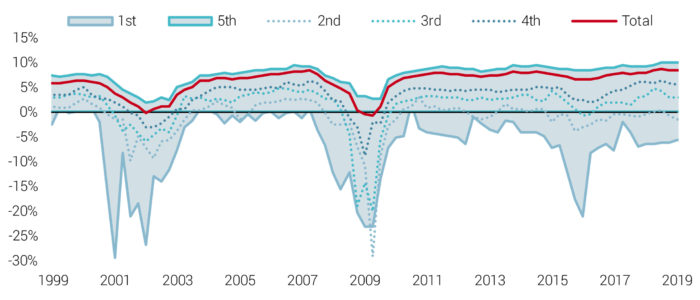
Risk is multidimensional and managing it effectively demands diversification of perspectives and metrics, as well as return sources. We believe there are three key drivers of risk for multi-asset investment portfolios: macroeconomic conditions, market sentiment, and asset valuation. Viewing global financial markets through this framework, we observe that some of the most concerning risks around macroeconomic slowdown have abated. Conditions have stabilised over the last few months and central banks have made it clear that they are ready to step in with their full suite of tools if needed. Nonetheless, geopolitical uncertainty, especially around US-China trade relations, are reminders that investors should remain alert and not be lulled into complacency in light of the recent market rally. Indeed, from a cross-asset valuation perspective, there are few obvious opportunities and traditional hedges like sovereign bonds are very expensive. Nonetheless, with few signs of imminent recession, muted inflation pressures, and accommodative monetary policy, the global expansion looks likely to continue, to the benefit of risky assets. One of our major themes of the last 12 to 18 months has been the slowdown in global economic growth. This perspective was based mainly on our proprietary set of economic indicators that assess in real-time the current risk of recession across more than 80% of the world’s GDP. These “Growth Nowcasters” aggregate and analyse more than 600 economic data series across 21 economies in both the developed and emerging world. Chart 1 shows the evolution of the Growth Nowcasters at a global level, as well as broken down by developed and emerging markets (DM and EM, respectively). After peaking in early 2018, global growth saw a sustained downward trend, hitting the zero level in March of this year. This indicated that the global economy had decelerated significantly and was growing around its potential. A continuation of this trend would have been quite concerning, as it would suggest the economy was tipping toward recession. However, since that low point in March, the global economy has shown signs of stabilisation around this potential level, not further deterioration, as highlighted by the circle region. While it is still too early to say the economy has bounced back and will likely re-accelerate into 2019, we can say that the likelihood of a global recession is much less probable than it seemed just a few months back. Chart 1: Growth Nowcasters Across Regions Source: Bloomberg, Unigestion (as of 28 June 2019). Importantly, this chart highlights the divergent growth dynamic between DM and EM economies: while DM economies broadly saw a strong resurgence of growth starting in early 2017 that has now fallen back to potential, growth in the EM world has been stagnant at just under potential over the same period. The developed world has central banks, led by the Federal Reserve (Fed) in the US, to thank for stemming the economic deceleration. After spending 2017 and 2018 tightening monetary policy, central banks pivoted in early 2019 to a more accommodative stance. As Chart 2 demonstrates, this shift in tone is now becoming evident in policy actions, with a levelling off and even a slight reduction in the average target rate across developed central banks. In mid-June, President of the European Central Bank (ECB) Mario Draghi made it clear that further interest rate cuts were available to policymakers if needed. This time last year, the ECB was talking about a possible rate hike toward the end of 2019. And following Draghi’s comments, the Fed made clear at their June meeting that the US tightening cycle is over and they are ready to cut interest rates to support the economy. Chart 2: Developed Central Bank Target Rates Reflect a More Accommodative Policy Stance Source: Bloomberg, Unigestion (as of 28 June 2019). Of course, a key reason that central banks can afford to make this shift is that inflation pressures have retreated significantly along with the growth deceleration. Chart 3 shows our global Inflation Nowcaster, which assesses the risk of inflation surprising to the upside or downside. In line with the stabilisation in the Growth Nowcaster, over the last couple of months our Inflation Nowcaster has stabilised around zero. This level indicates that inflationary and deflationary pressures are broadly offsetting each other, allowing central bankers to focus less on keeping prices stable and more on supporting the economic expansion. Chart 3: Developed Central Bank Target Rates Reflect a More Accommodative Policy Stance Source: Bloomberg, Unigestion (as of 28 June 2019). To be clear, the economy rarely stays at these potential levels for long. Looking over the last 35 years, we can see that in four cases (’97, ’95, ’99, ’05) the economy re-accelerated after decelerating to potential, while in three cases (’90, ’00, ’07), it fell into recession (see Chart 4). Monitoring the evolution of the economy from here in real-time will be critical in assessing which trajectory we are likely to be on in the months and years ahead. However, this economic stabilisation and a synchronised turn toward accommodative monetary policy should provide macro support to risky assets in the near-term. Chart 4: Historically, Growth at Potential is Not a Steady State for the Economy Source: Bloomberg, Unigestion (as of 28 June 2019). While the macro context is no longer a drag, fragile market sentiment is concerning and points us toward ensuring downside protection on our growth-oriented asset positions. The fragility is largely due to ongoing trade tensions between the US and its major trading partners, especially China. On the back of indications that a US-China trade deal was imminent, equity markets rallied strongly during the year with the S&P 500 hitting a new high of 2945 at the end of April. Alas, it seems that the more deeply entrenched differences were not fully addressed during the negotiations and these resurfaced to derail the agreement. These issues are at the core of the dispute: the role of state-owned enterprises (SOEs) in China’s economy, enforcement mechanisms to ensure compliance, and insistence by both sides on a fair deal (in their eyes) and respect. Until these thorny issues are addressed, tensions will persist and continue to roil markets. Interestingly, despite clear signs of slowing demand and restrictions on US crude oil imports, China has been accelerating its total oil imports, suggesting they may be stockpiling reserves and preparing themselves for a protracted conflict (see Chart 5). Chinese President Xi Jinping’s call for his country to prepare for a new “long march” further suggests that Chinese leaders do not see a resolution in the near term. The US is also sending a clear signal that they have other tools at their disposal in addition to tariffs, such as sanctions and export controls, and are willing to use trade to achieve other policy objectives (e.g., immigration). Chart 5: China Has Accelerated Crude Imports Source: Bloomberg, Unigestion (as of 28 June 2019). In the meantime, the impacts of the trade war are now evident in data. Until recently, soft data such as surveys and spending projections had shown the drag of trade tensions on sentiment. But over the last few months, hard data on world trade has sharply declined. Chart 6 shows the average three-month change for a few different measures of trade (import and export data from the IMF as well as trade volume data from the CBP), demonstrating the contraction in global trade over the last few months. This risk to external conditions is at the forefront many central bankers’ minds, justifying to a degree their policy stance. On a positive note, the CPB data is showing early signs of trade expansion again. Chart 6: Global Trade Has Contracted since the Third Quarter of 2018 Source: Bloomberg, Unigestion (as of 28 June 2019). While investors have been closely watching for any signals on US-China trade negotiations, other geopolitical risks have festered. In the UK, Boris Johnson has taken a commanding lead to replace Theresa May as Prime Minister. Johnson has made it clear that he aims to take the UK out of the European Union by October 31st, even if that means a ‘no-deal’ Brexit. While he may backtrack on that pledge and push back the deadline, the risk of a no-deal Brexit has risen significantly. In the Middle East, tensions between Iran and the US are boiling up as Iran threatens to breach the limit on the low-enriched uranium (used for nuclear power plants) it can stockpile under the 2015 deal. In response to this threat, as well as the attacks on oil tankers for which the US blames Iran, more US troops have been deployed to the region. While our core scenario for risky assets is supportive, sources of uncertainty such as these point us toward some cautiousness as we endeavour to provide smooth, consistent returns for our clients. In additional to geopolitics, two key dimensions of risk to assess market sentiment are pricing and investor positioning. Regarding pricing, money markets have priced in significant cuts in target interest rates, as Chart 7 shows for the Fed and the ECB. In the US, three cuts are expected by early 2020 and four by the end of the year. In the Eurozone, markets are expecting a more cautious ECB to cut rates this fall and again in late 2019 or early 2020. With the Eurozone hovering just above recessionary levels and uncertainty on tariffs and trade restrictions hanging over the region, one to two cuts seems reasonable to us. On the other hand, the pricing of 75bps in cuts in just over six months in the US looks stretched. At this point, the macro data is simply not supportive of such an aggressive policy shift. Rather, the uncertainty generated by the trade war is pushing the Fed’s hands to help smooth the economic impacts of this uncertainty. Thus, it seems to us that cuts from the Fed would be insurance cuts, which could be reversed if the uncertainty passes (the 1995 mid-cycle easing is the prototypical example). Until we see a significant deterioration in the US macro picture, it seems unlikely to us the Fed would pre-emptively cut rates to head off a potential recession. Indeed, if the Fed were to follow through with market expectations, we would be quite concerned about what sort of state the US economy would be in at that point. Chart 7: Market Pricing Aggressive Easing Cycle, Especially in the US Bloomberg, Unigestion (as of 28 June 2019). Equity markets, which have been buoyed by the central bank pivot, are pricing in significant earnings growth for the developed world, as shown in Chart 8. These expectations are at odds with the analyst consensus and our macro-based estimate, both of which see broadly muted earnings growth (mid-single digits). Interestingly, there is closer agreement between analysts, our estimates, and market pricing for EM equities, which are expected to see stable to slightly negative earnings growth over the next year. This suggests that if there were a resurgence of growth in the emerging world, driven possibly by further easing measures in China, a more accommodative Fed, or a trade deal, EM equities would strongly benefit as markets readjust their expectations to earnings expansion. Chart 8: Divergent Pricing in Developed Equity Markets but Agreement on EM Source: Bloomberg, Unigestion (as of 28 June 2019). A supportive sentiment factor is investor positioning, which remains relatively light despite a strong market rally. Chart 9 examines the implied beta to equities for a few key investor types as a proxy for their positioning. From this, we can see that Equity Long/Short Hedge Funds (HF) are at the lower end of their exposure to equities since 2010, while Macro HFs are relatively neutral. Commodity Trading Advisors (CTAs), which generally employ systematic trend-following strategies, have been active in increasing their equity exposure since the beginning of the year as markets rallied, but they remain far from overly-exposed at this point and seem to have room for additional buying if markets rise further. Chart 9: Implied Equity Betas Suggest Positioning is Light Source: Bloomberg, Unigestion (as of 28 June 2019). Finally, investment portfolios are exposed to valuation risk: “expensive” assets should underperform “cheap” assets, all else being equal. Our preferred measure to assess valuation across assets is carry, i.e., the return an asset holder receives if prices evolve in line with market expectations. By examining carry across assets, both with respect to each other and to their own histories, we can see that valuations right now are quite mixed, as shown in Chart 10. Bonds have continued to get even more expensive as yield curves flatten, while high yield credit and industrial metals are also looking rich. Most other growth-oriented assets, such as global equities, investment grade and EM credit, and energy commodities have fairly neutral valuations by this metric. Chart 10: Unigestion CAS’s Cross-Asset Valuation Indicator Source: Bloomberg, Unigestion (as of 28 June 2019) Looking closer at global equities via standard valuation measures, we see that, at the aggregate level, neither DM nor EM equities are particularly over-valued (Chart 11). Though some metrics are high, such as forward-looking Enterprise Value (EV) to Earnings Before Interest/Taxes/Depreciation/Amortisation (EBITDA), on average the metrics show these markets to be hovering a tad above their long-term levels. The case of the S&P 500 is more concerning, as nearly all valuation metrics are significantly elevated. Whether you consider the underlying assets, earnings, dividends, or cash flows you get for the price you pay for US stocks, you are getting much less today than you would have historically. On the other end of the spectrum, stocks in Japan’s TOPIX index are cheap by any measure we monitor, reflecting uncertainty around the planned consumption tax, trade tensions with the US, pressure on firms’ top-line due to the global economic slowdown, and tight labour markets squeezing margins. Chart 11: Unigestion CAS’s Cross-Asset Valuation Indicator Reading note: NTM denotes next twelve months, while LTM denotes last twelve months. CAPE is the cyclically adjusted P/E ratio. Source: Bloomberg, Unigestion (as of 28 June 2019) One justification for the high valuations of US firms is their strong profitability, especially after margins recovered in 2010 and then re-accelerated in 2016 to new highs. If we dig underneath the surface however, we see that there is strong dispersion between small, mid, and large-cap stocks. Chart 12 depicts the range of profit margins for firms in the Russell 3000 aggregated by market cap quintile (1st quintile are the smallest firms, 5th quintile are the largest firms), along with the total aggregate profit margin. Historically, it is not surprising to see the aggregate total close to the largest firms. However, what is interesting is how the spread, i.e., the range of margins between the smallest and largest firms, has grown since 2010 (shaded region of the chart). Typically, this band has remained narrow (around 10%) outside of recessions, when the spread widens significantly as small firms come under pressure and see their margins turn negative while large firms are able to ride out the storm. However, in the post-financial crisis recovery, the spread has widened. Indeed, 60% of firms currently have margins of 5% or below. Looking at balance sheets raises additional causes for concern: While we do not see this divergent corporate picture as an imminent risk since growth remains strong and monetary policy is easing, we are worried that when the cycle turns, this hidden dispersion will surface and reinforce the sell-off. Chart 12: The Spread of Profit Margins across US Firms Has Expanded Since 2010 Source: Bloomberg, Unigestion (as of 28 June 2019) For most of this year, we have maintained a cautious stance for a few key reasons: the pace and breadth of the macro deceleration, our doubts around the likelihood of a US-China trade deal, and the closing of the valuation gap that helped drive up markets at the beginning of the year. Taking a look where we are today, we believe the case for risky assets, or broad beta, is strong: the global economy is expanding in aggregate at around potential with little risk of an inflation overshoot and central banks ready to step in if (or even before) needed. Akin to the ‘goldilocks’ period of 2017 (though importantly at lower growth levels), the context should benefit equities, credit, and sovereign nominal bonds. Nonetheless, the skies are not completely clear and geopolitical uncertainty remains a primary source of risk. Market pricing and valuations are also not compelling, especially in bonds, the hedging asset of choice for most investors. Thus we continue to protect against an equity sell-off via options and make use of alternative return sources like low volatility equities and defensive FX strategies. Important Information This document is provided to you on a confidential basis and must not be distributed, published, reproduced or disclosed, in whole or part, The information and data presented in this document may discuss general market activity or industry trends but is not intended to be relied upon as a forecast, research or investment advice. It is not a financial promotion and represents no offer, solicitation or recommendation of any kind, The investment views, economic and market opinions or analysis expressed in this document present Unigestion’s judgement as at the date of publication without regard to the date on which you may access the information. There is no guarantee that these views and opinions expressed will be correct nor do they purport to be a complete description of the securities, markets and developments referred to in it. All information provided here is subject to change without notice. To the extent that this report contains statements about the future, such statements are forward-looking and subject to a number of risks and uncertainties, including, but not limited to, the impact of competitive products, market acceptance risks and other risks. Data and graphical information herein are for information only and may have been derived from third party sources. Although we believe that the information obtained from public and third party sources to be reliable, we have not independently verified it and we therefore cannot guarantee its accuracy or completeness. As a result, no representation or warranty, expressed or implied, is or will be made by Unigestion in this respect and no responsibility or liability is or will be accepted. Unless otherwise stated, source is Unigestion. Past performance is not a guide to future performance. All investments contain risks, including total loss for the investor. Unigestion SA is regulated by the Swiss Financial Market Supervisory Authority (FINMA). Unigestion (UK) Ltd is authorised and regulated by the Financial Conduct Authority (FCA) and SEC registered. Unigestion Asset Management (France) SA is regulated by the “Autorité des Marchés Financiers” (AMF). Unigestion (Luxembourg) SA is an Alternative Investment Fund Manager authorised by the Commission de Surveillance du Secteur Financier (CSSF) under the Luxembourg law of 12 July 2013 on AIFM. Unigestion Asset Management (Canada) Inc., with offices in Toronto and Montreal, is regulated in Canada by the securities regulatory authorities in Ontario, Quebec; Alberta, Manitoba, Saskatchewan, Nova Scotia, New Brunswick and British Columbia. Its principal regulator is the Ontario Securities Commission. Unigestion Asia Pte Ltd is regulated in Singapore by the MAS, as Capital Market Services (CMS) license holder and Exempt Financial Adviser under the Securities and Futures Act and Financial Advisers Act. Document issued: July 2019.MIVIEWS Q3 2019: AND THE BEAT GOES ON… FOR NOW
OVERVIEW
MACRO CONDITIONS ARE SHOWING SIGNS OF STABILISATION
GEOPOLITICAL TENSIONS CONTINUE TO WEIGH ON SENTIMENT
VALUATIONS PRESENT FEW OBVIOUS OPPORTUNITIES
WE ARE CONSTRUCTIVE BUT ATTENTIVE TO LATENT RISKS
to any other person.
to invest in the strategies or in the investment vehicles it refers to. Some of the investment strategies described or alluded to herein may be construed as high risk and not readily realisable investments, which may experience substantial and sudden losses including total loss of investment.
Your country:
The content of this website is published by Unigestion SA, Av. de Champel 8C, 1211 Geneva, Switzerland, a fund management company licensed by the Swiss Financial Market Supervisory Authority (FINMA).
Before continuing, please read the LEGAL INFORMATION below relating to the terms of use of the Unigestion website (the “Site”)
1. Access to the Site
Access to the Site is not allowed to persons coming under a jurisdiction (through their domicile, nationality or any other manner) in which its publication or availability would constitute a violation of the existing laws and regulations. If you come under such a jurisdiction, you are not authorised to continue and must leave the Site immediately. If you do not come under such a jurisdiction, you can access the Site after having read and accepted the following conditions and terms.
2. No recommendation
The information disseminated on the Site does not constitute a recommendation to make or liquidate an investment or carry out any other transaction. Any investment decision must be based on an analysis of the risks (including any legal, regulatory, tax or other consequence) related to the investment as well as on the relevant and specific advice of an independent professional.
The information provided on this website constitute an advertisement pursuant to the Swiss Financial Services Act (“FinSA”) and its implementing ordinance. The information provided on this website does not constitute an offer of any financial instrument. No financial services are provided through this website, such as an offer or a solicitation of an offer to purchase or sell financial instruments, or investment advice. All information is of a generic nature. Financial services, in the meaning of FinSA, may only be provided to you after you have established contact with us and we have identified you and classified you according to your investor status.
3. No guarantee
The information and opinions disseminated on the Site are provided by Unigestion based on public information, data developed internally as well as other reputedly reliable sources. Although Unigestion has endeavoured to ensure that this information is as accurate and comprehensive as possible at the time of its publication, no express or tacit guarantee is given in this respect. The content of the Site is likely to be modified at any time and without notice. Only the latest versions of the prospectuses, key investor information documents (KIID) as well as the annual and semi-annual reports of investment funds can be considered as an official fund publication on the basis of which investment decisions are taken.
4. Performances and risks
Past performance is no guarantee or indicator of future results. The value of investments may go up as well as down. Like any investment, an investment with Unigestion has risks, notably the risk of losing the amount invested.
The risk factors of the financial instruments presented on this Site are described in the fund prospectuses.
5. Local legal restrictions and specific information
The Site is not intended for persons residing in a country in which the distribution of the financial products presented therein would contravene local laws and/or regulations. Such persons must not access this Site. It is your responsibility to ensure that you are authorised to access it. This Site contains information relating to a large number of financial instruments registered and managed in different jurisdictions. Therefore, you will have to indicate your place of domicile before being able to access the information relating to the said products. Please take note of the fact that private investors’ access to the said information shall be limited to the financial instruments authorised for sale to the public in their country of domicile.
United States of America
None of the financial products mentioned on this Site are or shall be registered according to the “United States Securities Act” of 1933, as amended. Similarly, the investment funds mentioned on this Site are not registered according to the “United States Investment Company Act” of 1940, as amended, and are not destined to be registered. Consequently, the above-mentioned investment funds must under no circumstances be offered or distributed: (i) on the territory of the United States of America, in one of the States or in another political sub-division of the United States, or (ii) to, for the benefit or in favour of US nationals (as defined in Regulation S of the “United States Securities Act” of 1933).
Switzerland
The fund Contract, the Prospectus, the Key Investor Information Document(s) as well as the latest annual and semi-annual reports of Unigestion Swiss Equities, a Swiss collective investment scheme organized as a contractual fund under Swiss law, can be obtained free of charge and upon request from the fund’s management company, Unigestion SA, 8c Avenue de Champel, 1206 Geneva, and from the distributors of the fund.
The Prospectus, the Key Investor Information Document(s) as well as the latest annual and semi-annual reports of Uni-Global, a collective investment scheme organized under the laws of Luxembourg can be obtained free of charge and upon request from the fund’s management, the distributors or from the representative of the fund in Switzerland being Unigestion SA, 8c Avenue de Champel, 1206 Geneva. HSBC Private Bank (Suisse) SA, Quai des Bergues 9-17, 1201 Geneva acts as the paying agent in Switzerland of the fund.
Austria
The Prospectus, the Key Investor Information Documents, the Articles of Association as well as the latest annual and six-monthly reports of the Uni-Global mutual fund can be obtained free of charge and upon request from the management company, distributors or the local representative: Erste Bank der österreichischen Sparkassen AG, Brandstätte 7-9/1. Stock A-1010 Vienna.
United Kingdom
Unigestion (UK) Ltd fully supports the principles of the Stewardship Code (the “Code”) issued by the Financial Reporting Council in the United Kingdom. Unigestion recognises that the Code is a key component of sound corporate governance and reinforces the responsibilities incumbent on asset managers to ensure that they engage in an effective and constructive dialogue with portfolio management companies in order to best serve the interests of their clients.
Consult the document Unigestion (UK) Limited’s UK Stewardship Code
As a firm regulated by the FCA Unigestion (UK) Ltd is required to have a written procedure for the effective consideration and proper handling of complaints and conflicts of interests. Unigestion UK Limited’s Complaint Management and Conflicts of Interest Policies and the accompanying procedures are detailed in the following documents: Unigestion UK Complaints Policy and Unigestion UK Limited Conflicts of Interest Policy.
France
Under its legal and regulatory obligations, Unigestion Asset Management (France) SA has put in place a policy relating to the processing of complaints.
For more information on this policy, please refer to the document Complaint Handling Policy.
Canada
The Unigestion Group carries on business in Canada through Unigestion Asset Management (Canada) Inc. (UAMC) which is registered in every province of Canada (except Newfoundland and Labrador and Prince Edward Island) as a portfolio manager and exempt market dealer and in the provinces of Ontario and Quebec as an investment fund manager. The services and products described herein are offered only in those jurisdictions and to those persons where and to whom they may lawfully be offered.
In particular, if you access this Site and you are domiciled in Canada, you confirm to be an accredited investor or other prospectus exempt investor.
6. Taxation
Tax treatment depends on the personal situation of each investor and can be subject to changes. Before taking any investment decision, investors are recommended to resort to the specific advice of a tax professional.
7. Intellectual property
Unless indicated otherwise, Unigestion is the owner, or holder of the rights, of all the components that make up this Site, notably the data, charts and drawings. Any total or partial reproduction, representation, distribution or redistribution of the content of this Site through whatever process without the prior express authorisation of Unigestion is prohibited.
8. Links to other websites
This Site may contain hyperlinks to other websites. Navigation to such links is undertaken at your own risk. Unigestion refuses to accept any liability regarding the content and any potential damage caused during visits to sites to which this Site leads through hyperlinks. Users visit the other sites under their own responsibility and at their own risk.
9. Cookies
Users are informed that during their visits to the site, a cookie can be automatically installed and be stored temporarily in the memory or on their hard disk. A cookie is a component that cannot be used to identify the user but serves to record information relating to the user’s navigation on the website. Cookies are used on the Site solely to record information relating to the user’s navigation on the Site in particular browsing behavior for statistics purposes and to offer you targeted advertising.
Users of the site acknowledge that they have been informed of this practice and authorise Unigestion to use it. They can disable this cookie through parameters contained within their navigation software.
This website uses Google Analytics, a web analytics service provided by Google, Inc. (“Google”). Google Analytics uses “cookies”, which are text files placed on your computer to help the website analyse how visitors use the site. The information generated by the cookie about your use of the website (including your IP address) will be transmitted to and stored by Google on servers in the United States. Google will use this information for the purpose of evaluating your use of the website, compiling reports on website activity for website operators and providing other services relating to website activity and internet usage. Google may also transfer this information to third parties where required to do so by law, or where such third parties process the information on Google’s behalf. Google will not associate your IP address with any other data held by Google. You may refuse the use of cookies by selecting the appropriate settings on your browser, however please note that if you do this you may not be able to use the full functionality of this website. By using this website, you consent to the processing of data about you by Google in the manner and for the purposes set out above.
You can prevent Google’s collection and use of data (cookies and IP address) by downloading and installing the browser plug-in available under https://tools.google.com/dlpage/gaoptout?hl=en. Further information concerning the terms and conditions of use and data privacy can be found at http://www.google.com/analytics/terms/gb.html.
10. Terms and conditions
Users are informed that the personal data they share with Unigestion SA is used to provide the services to which they have enrolled or subscribed, and we do not use this data for any other purpose. To provide users with these services, we may share this data with third parties, including affiliated companies and third-party service providers, providing data processing, data storage, marketing, statistics or administrative services within Switzerland, European Union member states, and other foreign jurisdictions, including in jurisdictions whose legislation may not provide the same level of data protection as in Switzerland or in the European Union, such as the United States, Canada and Singapore. Unigestion SA, however, has implemented high-standard internal data protection rules so as to ensure compliance with applicable data protection laws and provide an adequate level of protection in relation thereto.
Users are informed that they can withdraw their consent at any time by using the UNSUBSCRIBE feature of the service, or by sending an email to: clients@unigestion.com.