So far, 2019 has been a very good year for most asset classes. Over the last 100 years, there has only been one instance, in 1986, when equities (+18%), long-term bonds (+25%) and gold (+22%) were all up 15% or more in the same year. In late 1985 and early 1986, the US economy shifted from a rapid recovery from the early 1980s recession to a slower expansion. The Federal Reserve’s accommodative monetary policy actions during 1986 (it cut the target rate from 8% to 5.875%) were influenced by indications of weak economic growth and moderate inflation. Despite many macroeconomic differences between the 80’s and today, our Nowcasters are indicating a similar economic environment – one in which global growth continues to slow and inflation surprises on the downside, allowing central banks to lean on the dovish side. The last ten years of monetary stimulus created a highly correlated “everything rally” and with this still in mind, investors are trying to front-run central banks which are expected to do “more of the same”. The strong belief in the “central bank put” has pushed investors up the risk ladder in a desperate search for yield. The Q4 2018 sell-off, and the subsequent reaction, reinforced once more the perception that central banks will always be there to save the day. With cash trading at zero or negative yields in many parts of the world, complacency and a lot of creativity is needed in order to reach target yields (which are set far too high for the current environment). With the expectation of even lower rates, a new round of aggressive central bank front-running has started. In anticipation of more monetary stimulus, the most effective and most straightforward trade is to increase duration in portfolios. The unbelievable price appreciations of long-dated bonds (e.g. Austria 100-year bond is up 75% year-to-date) show how aggressive investors have been in allocating to longer maturities as they try to escape negative yields. With 50-year Swiss bonds at -44bps and 30-year Bunds at -16bps, the risk/reward dynamics of this trade have changed dramatically.“More of the Same” – Caroline Rose, 2018
What’s Next?
Valuation: falling interest rates raise asset prices…
Consequently, this wall of money has been forced into the corporate bond market. Negatively yielding corporate debt rose from USD 20bn in January 2019 to the USD 1tn mark recently. At the same time, covenant protections, which buffer investors in the case of default, are at record lows. Besides the direct impact, there are also indirect effects of lower yields and lower credit spreads.
Debt instruments are key to calculating the opportunity cost of owning equities. As bond yields go down, the opportunity cost of holding equities goes down. Consequently, equity investors are ready to pay a higher price/earnings multiple. Due to the combination of low financing costs, corporate tax cuts, subdued economic growth and a lack of investment opportunities in the real economy, enormous amounts of cash has been pushed into the financial system, kickstarting a new wave of stock buybacks and mergers and acquisitions.
All these factors have driven up public equity valuations to expensive levels. With many investors concerned about the sustainability of these valuations, market participants are looking for cheaper alternatives. A lot of money has therefore gone into private equity and private debt to harvest the liquidity premium. With all this money waiting to be invested, buyout values have been pushed higher to levels not seen since the financial crisis. In addition, leverage has been used so aggressively that Janet Yellen, former Fed chair, said that she was worried by a huge deterioration in corporate lending standards, particularly for leveraged loans. The “everything rally” that has been going on for a long time is pushing all asset classes to very expensive valuations, but “more of the same” means that valuations will only get more expensive before they get cheaper.
…but simultaneously lower the future returns of assets
Monetary stimulus runs up against the law of diminishing returns in the financial market and diminishing effects on the economy. As long as economic growth doesn’t pick up and real investment opportunities remain limited, the additional money will end up in the hands of investors. This will drive up financial asset prices even more, reducing the future expected nominal and real returns and risk premiums will progressively move toward cash returns. It will be even more difficult to reach target yields and the only solution will be to take even more risk in the form of increasing illiquidity and/or leverage.
Macro: short-term gain vs. long-term pain
Negative rates have distorted the most important factor in economic decision making – the pricing of risk. If central banks push rates below zero, this essential function does not work anymore. The consequences are overproduction and overcapacity driven by over investment and poor decision making. This keeps inflation in check and opens the way for more stimulus, and the debt spiral keeps on enforcing itself. It is also well understood that negative rates crush the player that is supposed to be responsible for the monetary policy transmission effect – i.e. the banks. Their margins are compressed due to low long-term rates and flat term structures. The decline in profits erode bank capital bases and further limit credit growth. “More of the same” will not do the trick for the economy, but the avoidance of any necessary short-term pain at the expense of prudent long-term thinking should be supportive for the economy and especially for financial markets in the short term.
Sentiment: the pain trade is to the upside
If there is going to be a recession, it will be the most telegraphed recession in history, with every investor preparing for it. Google searches for the term “recession” have surged to levels not seen since the financial crisis mainly due to one of the most reliable indicators, the yield curve inversion, pointing to an economic recession. We clearly pay close attention to the signals the yield curves are providing, but an inversion by itself is not a reason to reduce growth assets. First, when long-term bond yields fall below short-term yields, on average it takes 12 months before the recession arrives. This period is usually extremely good for growth assets. Second, during this first phase we interpret the inversion as a telling gauge of the negative market sentiment. Another indicator flagging the over bearish sentiment in financial markets is the recent high correlation between hedging assets, which indicates heavy crowding in defensive positions.

Asset allocation: exposed with hedges
Our Nowcasters are pointing to slower growth, but not a recession, and due to heavy disinflationary pressures, we expect increasing support from key central banks. On the back of that, we are overweight carry-related risk premia such as high yield, emerging credit and volatility. Further, relatively light positioning in pro-growth assets supports our constructive view on risk-on assets relative to hedging assets. The biggest risk to our upbeat market view is the considerable optimism about central bank easing. This could trigger a highly correlated market unwind/reversal of the “everything rally”. We are therefore maintaining hedges via optional structures to protect against a short-term correlation shock.

More of the Same

Our medium-term view is currently more constructive, as we are still overweight growth assets and underweight real assets. We are also complementing our exposures with options to protect the portfolio in the case of equity drawdowns. Over September to date, the Multi Asset Risk Targeted Strategy is up 0.86% versus 1.99% for the MSCI AC World Index, while the Barclays Global Aggregate (USD hedged) is down 0.25%. Year-to-date, the Multi Asset Risk Targeted Strategy has returned 10.07% versus 16.07% for the MSCI AC World index and 8.99% for the Barclays Global Aggregate (USD hedged) index. * The Multi Asset Risk Targeted Strategy performance is shown in USD net of fees for the representative account of the Multi Asset Risk Targeted (Medium) USD Composite and reflects the deduction of advisory fees and brokerage commission and the reinvestment of all dividends and earnings. Past performance is not indicative of future performance. This information is presented as supplemental information only and complements the GIPS compliant presentation provided on the following page.Strategy Behaviour
Performance Review
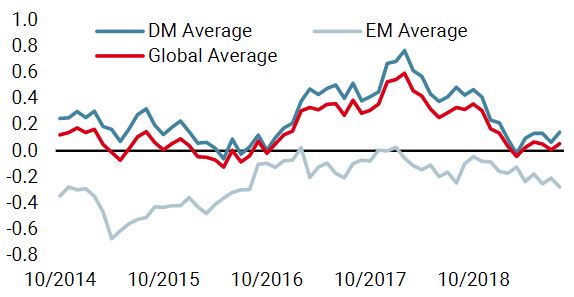
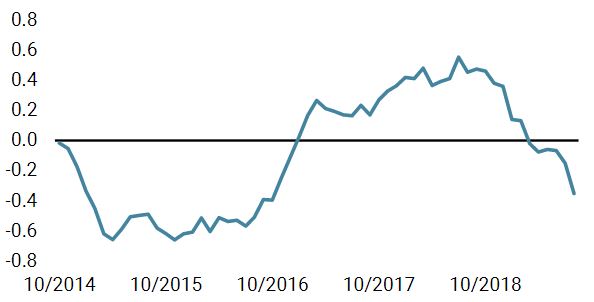
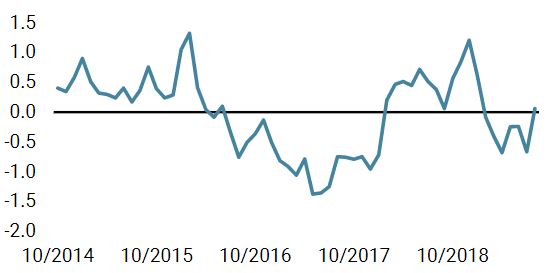
Unigestion Nowcasting
World Growth Nowcaster
World Inflation Nowcaster
Market Stress Nowcaster
Weekly Change
- Our world Growth Nowcaster declined last week, as a majority of economies started posting disappointing figures. Interestingly, the Eurozone, the UK and Japan are the only three with an improving situation.
- Our world Inflation Nowcaster declined again last week across all economies.
- Market stress decreased last week, as volatility and credit spreads decreased.
Sources: Unigestion. Bloomberg, as of 09 September 2019.
Important Information
Past performance is no guide to the future, the value of investments can fall as well as rise, there is no guarantee that your initial investment will be returned. This document has been prepared for your information only and must not be distributed, published, reproduced or disclosed by recipients to any other person. This is a promotional statement of our investment philosophy and services only in relation to the subject matter of this presentation. It constitutes neither investment advice nor recommendation. This document represents no offer, solicitation or suggestion of suitability to subscribe in the investment vehicles it refers to. Please contact your professional adviser/consultant before making an investment decision. Where possible we aim to disclose the material risks pertinent to this document, and as such these should be noted on the individual document pages. Please contact Unigestion for a complete list of all the applicable risks. Some of the investment strategies described or alluded to herein may be construed as high risk and not readily realisable investments, which may experience substantial and sudden losses including total loss of investment. These are not suitable for all types of investors. To the extent that this report contains statements about the future, such statements are forward-looking and subject to a number of risks and uncertainties, including, but not limited to, the impact of competitive products, market acceptance risks and other risks. As such, forward looking statements should not be relied upon for future returns. Data and graphical information herein are for information only and may have been derived from third party sources. Unigestion takes reasonable steps to verify, but does not guarantee, the accuracy and completeness of this information. As a result, no representation or warranty, expressed or implied, is or will be made by Unigestion in this respect and no responsibility or liability is or will be accepted. All information provided here is subject to change without notice. It should only be considered current as of the date of publication without regard to the date on which you may access the information. Rates of exchange may cause the value of investments to go up or down. An investment with Unigestion, like all investments, contains risks, including total loss for the investor.
This information is issued by Unigestion (UK) Ltd (“Unigestion”), which is authorised and regulated by the UK Financial Conduct Authority (“FCA”). Unigestion is also registered as an investment adviser with the U.S. Securities and Exchange Commission (“SEC”). This information is intended only for professional clients, institutional clients and eligible counterparties, as defined by the FCA, and qualified purchasers as defined by the SEC and has therefore not been adapted to retail clients.
Unigestion Multi Asset Risk-Targeted (USD): 31 December 2014 to 30 June 2019
| Year | Composite Return Gross of Fees |
Composite Net Return | Benchmark Return | Number of Accounts | Internal Dispersion | Composite 3-Yr Std Dev | Benchmark 3-Yr Std Dev | Composite AUM (M) | Firm AUM (M) |
| 2015 | -1.61% | -2.80% | – | 1 | – | – | – | 127.24 | 15,550.31 |
| 2016 | 5.05% | 3.79% | – | 1 | – | – | – | 129.66 | 18,144.46 |
| 2017 | 11.16% | 9.82% | – | 1 | – | – | – | 169.51 | 22,340.80 |
| 2018 | -2.91% | -4.08% | – | 1 | – | – | – | 286.93 | 21,403.49 |
| 20191 | 7.45% | 6.80% | – | 1 | – | – | – | 364.46 | 21,692.55 |
1: This year is incomplete, it stops in June.
Special Disclosure: For presentations prior to 31.03.2018 the strategy was measured against the LIBOR 3M USD + 4%. Beginning April 2018 the firm determined that the benchmark did not accurately reflect the strategy mandate and the benchmark was removed. Definition of the Firm: For the purposes of applying the GIPS Standards, the firm is defined as Unigestion. Unigestion is responsible for managing assets on the behalf of institutional investors. Unigestion invests in several strategies for institutional clients: Equities, Hedge Funds, Private Assets and the solutions designed for the clients of our Cross Asset Solution department. The GIPS firm definition excludes the Fixed Income Strategy Funds, which started in January 2001 and closed in April 2008, and the accounts managed for private clients. Unigestion defines the private clients as High Net Worth Families and Individual investors. Policies: Unigestion policies for valuing portfolios, calculating performance, and preparing compliant presentations are available upon request. Composite Description: The Multi Risk Targeted (Medium) composite was defined on 15 December 2014. It consists of accounts which aim to deliver consistent smooth returns of cash + 5% gross of fees across all market conditions over a 3-year rolling period. It seeks to achieve this by capturing the upside during bull markets while protecting capital during market downturns. Benchmark: Because the composites strategy is absolute return and investments are permitted in all asset classes, no benchmark can reflect this strategy accurately. Fees: Returns are presented gross of management fees, administrative fees but net of all trading costs and withholding taxes. The maximum management fee schedule is 1.2% per annum. Net returns are net of model fees and are derived by deducting the highest applicable fee rate in effect for the respective time period from the gross returns each month. List of Composites: A list of all composite descriptions is available upon request. Minimum Account Size: The minimum account size for this composite is 5’000’000.- USD. Valuation: Valuations are computed in US dollars (USD). Performance results are reported in US dollars (USD). Internal Dispersion & 3YR Standard Deviation: The annual composite dispersion presented is an asset-weighted standard deviation calculated for the accounts in the composite the entire year. When internal dispersion is not presented it is as a result of an insufficient number of portfolios in the composite for the entire year. When the 3 Year Standard Deviation is not presented it is as a result of an insufficient period of time. Compliance Statement Unigestion claims compliance with the Global Investment Performance Standards(GIPS®) and has prepared and presented this report in compliance with the GIPS standards. Unigestion has been independently verified for the periods 1 January 2003 to 31 December 2016. The verification report(s) is/are available upon request. Verification assesses whether (1) the firm has complied with all the composite construction requirements of the GIPS standards on a firm-wide basis and(2) the firms policies and procedures are designed to calculate and present performance in compliance with the GIPS standards. Verification does not ensure the accuracy of any specific composite presentation.