Across the three dimensions of our dynamic asset allocation process, we are now observing a better balance of positive and negative elements. The macro picture is dire with multiple standard deviation collapses in economic time series, but the response from central banks and governments to alleviate a substantial part of the shock has been massive. Sentiment was fragile but has improved, reflecting a normalisation in the liquidity situation. Both implied and realised volatility have come down significantly across many markets. Valuations were low but have now recovered half the ground they lost since the start of the crisis. This normalisation is a breather for many but the earnings season will be the judge, deciding whether these valuations are fair or not. This better balance across macro, sentiment and valuations warrants a move towards a more neutral dynamic asset allocation across our portfolios. Here is why.Neutral Is the New Black

Shake It Off

If there is one conviction we have been holding on to over the past couple weeks, it is our understanding of the macro situation. When analysing Chinese, Eurozone and US economic data, the picture beomes clear. Since the implementation of the lockdowns, the Chinese production expectations survey has taken a hit like it’s never seen before, followed closely by a deterioration in the consumption-related surveys and hard data series. According to this week’s estimates, Chinese GDP contracted by 9.8% non-annualised over Q1, dwarfing any previous contraction. Initally, China alone was a large yet confined problem. But when the virus spread to its best customers, Chinese macro data was unlikely to remain unaffected. 38% of Chinese GDP is due to exports to the rest of the world: 17% to the US, 15% to Europe and 5% to Japan. For each of these trading partners, the macro data we are currently gathering reveals an extreme contraction on a scale that has yet to be quanitfied. Our Growth Nowcasters are computed in terms of z-scores, meaning that their scale is standard deviations. An event with a standard deviation lower than -1 should happen on average about 15% of the time. For standard deviations of -2, this number becomes about 2%. Our US Growth Nowcaster has reached -1.52 standard deviation, while the Canadian one is at -1.73. The Eurozone one is currently at -0.57 and the Chinese one at -0.77. Taken individually, each of these numbers are signs of recession. Taken together, the situation is even worse. In three months, the situation has evolved from a China-contained epidemic to a worldwide pandemic and recession. But there is more. A couple of weeks ago, only a handful of data series were showing extreme readings (the Philadelphia Fed index, the US jobless claims, the German IFO survey and the Chinese PMI). Now, 65% of data from across the 21 economies that we monitor is deteriorating. These are levels that were observed globally in early 1990, 2001 and late 2007, and early 2011 in Europe. This recession is rapid and has ripple effects that have yet to be measured. No wonder cyclical commodities are still struggling in spite of production cuts, with the epicenter of the storm focusing on WTI crude oil. Governments and central banks have probably reached a similar conclusion. Both have made the decision to stimulate their economy and markets with packages of unprecedented scale. The US government passed a bill triggering a fiscal package worth 10% of its GDP. The Fed made it clear it would do whatever is necessery to maintain market liquidity and cap any rise in Treasury yields. Its balance sheet increased by 65% in a month, with an spectacular USD 1.3tn increase in Treasuries held and a USD 200bn increase in MBS. Until this month, USD 330bn in April 2009 was the largest increase in the Fed‘s balance sheet. The Fed’s current actions are in line with the scale of the shock. The growth rate of M2 money supply in the US reflects the magnitude of the stimulation and is a factor not to be understated: abundant money supply is historically a positive medium-term factor for markets. European governments and the ECB are also actively engaging in pushing the macro shock back. The ECB’s balance sheet increased by 12% between February and March as goverments ramped up their respective programmes. The Fed and the ECB are currently running a USD 6tn and EUR 5tn balance sheet, respectively, which, when combined, amounts to 13% of the world’s GDP. This number will rise because governments around the world will need a low rate environment for an extended period of time. That, in our view, could offset a significant chunk of the recession signs we are witnessing. Consistent with the extent of the recession, market sentiment significantly deteriorated in March. Our Market Stress Nowcaster reached a +2.3 standard deviation: our indicator reaches values higher than this only about 1% of the time. However, this element has notably improved, reflecting two significant factors. First, the rate of virus transmission has decreased significantly: this number reached a peak of 15% on 27 March and has decreased significantly since then. It currently ranges around 5%. Second, Fed action has led to an improvement in the liquidity situation. The 3-month Treasury EuroDollar spread (TED spread), a typical measure of the interbank liquidity market, peaked at 137 bps on 27 March, as the first apocalyptic jobless claims number was published. After three rounds of Fed intervention and the launch of two liquidity targeting programmes, this number has come down to 105 bps. For the sake of comparison, this spread reached 102 bps in December 2007 and 364 bps in October 2008: the current situation has improved, but liquidity remains tense. The commercial paper market is also showing signs of easing liquidity tensions: 3-month commercial paper for non-financial corporates trades with a current yield of 188 bps above OIS swap rates thanks to Fed interventions, having peaked at 386 bps on 27 March. This spread reached a peak of 606 bps in the first week of December 2008, as Fed liquidity programmes back then targeted more financial institutions. We have not yet seen similar levels. Liquidity conditions have been bad, but are now improving. In its wake, volatility and positioning have also improved. As explained in last week’s Macro Views, credit and equity volatilities have declined alongside liquidity spreads. Interestingly, both implied volatility (reflecting the scale of the insurance demand) and realised volatility (reflecting the panic across market participants) have improved everywhere we look. Consistent with this, half of the surge in the equity option implied skew retraced. This translated into the portolio positioning of many participants. When looking at the average equity beta of a large spectrum of multi asset funds, it was around 0.34 at the beginning of the last week of Februrary but has been largely cut to 0.18. This beta evolution – necessarily a backward-looking indication – has stopped dropping since the second week of April, without showing much signs of increasing. This corroborates our market positioning analysis: the current rally occured with unusually low volume and liquidity. However, the positioning situation has stopped deteriorating. We could summarise the sentiment data we are monitoring as follows: sentiment was bad, the Fed intervened and now it is clearly better without being perfect. In order to know whether we can definitely “shake it off”, the earnings seasons will be key. With the improvement in sentiment, equity and credit markets posted strong returns, reaching higher grounds. Many have questioned whether this rally is a “bear market rally” or not. Here is our take on valuation. Trailing PE ratios are about to enter a more neutral zone following an improvement on the “P” side. In the case of the S&P 500, the trailing PE is marginally higher than 20 (down from 28) while its Shiller’s cyclically adjusted ratio has dropped from 33 to 25. Both are not indicative of a recession. The earnings season that is starting should help judge the sanity of these numbers: should the “E” lose some ground, forward-looking PEs will take the elevator, no longer placing equities in the cheap zone. Analysts are currently expecting an 18% year-on-year earnings contraction for S&P 500 companies, a 22% contraction in the case of the Stoxx 600 and a 19% contraction for the MSCI World. Markets are not expecting this collapse to persist, with current trading levels indicating – according to our estimates – a 0% growth in earnings in 2020 for the S&P 500. This could happen if the current shock is temporary and followed by a strong recovery period. Our analysis of credit markets is similar, as spreads are pricing a contained shock in 2020, but with a notable difference: spreads are supported by central banks, explaining our current preference for credit over equities. The consequences of the recession are being significantly offset by authorities. Sentiment has recovered in the wake of their action and with the pandemic apparently coming under control. Valuations are entering neutral territories, with the approaching earnings season potentially bringing more clarity. Wherever we look, we see a mixture of positive and negative factors combined with uncertainties. When faced with this situation, we favour moving towards a more neutral dynamic asset allocation positioning, maintaining a trimmed underweight for equities. Our biggest convictions are the following: first, an overweight for credit as we remain confident in central bank support for this asset class; second, an overweight for precious metals as a hedge against uncertainty and the potential ripple effects of another period of monetary activism.What’s Next?
Recession signs could be offset by stimulation
Sentiment has improved
Valuations vs. earnings season
A better balance warrants neutrality
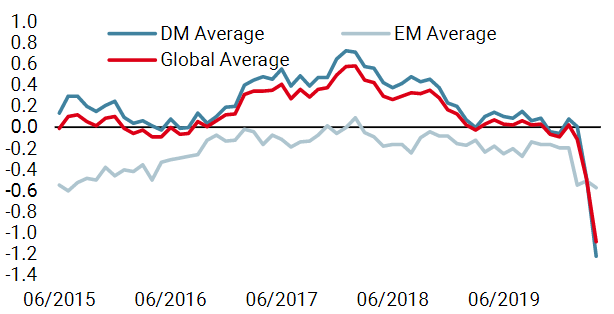
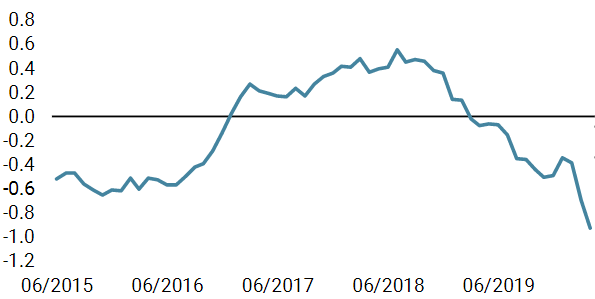
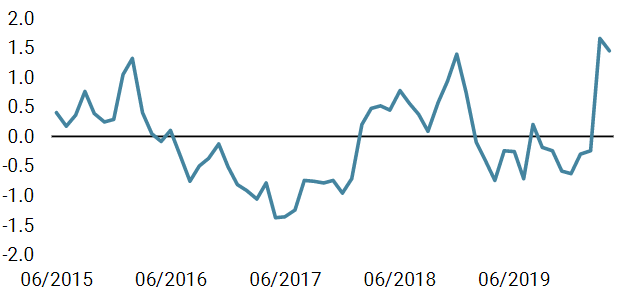
Unigestion Nowcasting
World Growth Nowcaster
World Inflation Nowcaster
Market Stress Nowcaster
Weekly Change
- Our world Growth Nowcaster decreased again last week. This week’s sharpest decline is again in the US and Canada where data was particularly poor. According to our indicators, the risk of a world recession is currently very high.
- Our world Inflation Nowcaster also fell, with the US and Canada again showing the largest decline.
- Our Market Stress Nowcaster remains elevated but continued to retreat last week as all three components improved.
Sources: Unigestion. Bloomberg, as of 17 April 2020.
Important Information
This document is provided to you on a confidential basis and must not be distributed, published, reproduced or disclosed, in whole or part, to any other person.
The information and data presented in this document may discuss general market activity or industry trends but is not intended to be relied upon as a forecast, research or investment advice. It is not a financial promotion and represents no offer, solicitation or recommendation of any kind, to invest in the strategies or in the investment vehicles it refers to. Some of the investment strategies described or alluded to herein may be construed as high risk and not readily realisable investments, which may experience substantial and sudden losses including total loss of investment.
The investment views, economic and market opinions or analysis expressed in this document present Unigestion’s judgement as at the date of publication without regard to the date on which you may access the information. There is no guarantee that these views and opinions expressed will be correct nor do they purport to be a complete description of the securities, markets and developments referred to in it. All information provided here is subject to change without notice. To the extent that this report contains statements about the future, such statements are forward-looking and subject to a number of risks and uncertainties, including, but not limited to, the impact of competitive products, market acceptance risks and other risks.
Data and graphical information herein are for information only and may have been derived from third party sources. Although we believe that the information obtained from public and third party sources to be reliable, we have not independently verified it and we therefore cannot guarantee its accuracy or completeness. As a result, no representation or warranty, expressed or implied, is or will be made by Unigestion in this respect and no responsibility or liability is or will be accepted. Unless otherwise stated, source is Unigestion. Past performance is not a guide to future performance. All investments contain risks, including total loss for the investor.
Unigestion SA is authorised and regulated by the Swiss Financial Market Supervisory Authority (FINMA). Unigestion (UK) Ltd. is authorised and regulated by the UK Financial Conduct Authority (FCA) and is registered with the Securities and Exchange Commission (SEC). Unigestion Asset Management (France) S.A. is authorised and regulated by the French “Autorité des Marchés Financiers” (AMF). Unigestion Asset Management (Canada) Inc., with offices in Toronto and Montreal, is registered as a portfolio manager and/or exempt market dealer in nine provinces across Canada and also as an investment fund manager in Ontario and Quebec. Its principal regulator is the Ontario Securities Commission (OSC). Unigestion Asia Pte Limited is authorised and regulated by the Monetary Authority of Singapore (MAS). Unigestion Asset Management (Copenhagen) is co-regulated by the “Autorité des Marchés Financiers” (AMF) and the “Danish Financial Supervisory Authority” (DFSA). Unigestion Asset Management (Düsseldorf) SA is co-regulated by the “Autorité des Marchés Financiers” (AMF) and the “Bundesanstalt für Finanzdienstleistungsaufsicht” (BAFIN).