The deterioration in US macro data weighed on market sentiment last week, triggering a large risk aversion move. Consequently, markets are now pricing in an increased likelihood of a US recession. While market sentiment is a key driver for asset returns, it can be affected by human behaviour patterns, which tend to 1) overestimate short-term events relative to broader perspectives, 2) follow the trend without discriminating between noise and fundamentals, and 3) focus more on negatives than positives when confidence is weak. We believe that we are in this kind of an environment, with investors overreacting and amplifying the nature of risks that are on the horizon. We are not saying that there are no risks, rather that the current situation warrants a thorough analysis of the facts to see if market pricing reflects reality and to avoid crying for nothing. For the second month in a row, the ISM manufacturing reading in the US came in below the key threshold of 50, which historically highlights a slowdown in the economy. The last time we had such an occurrence was at the end of 2015. In 2016, the situation improved thanks to delayed monetary policy normalisation from the Fed. Today, in an environment of inversed yield curves, a sharp slowdown in global trade and increased uncertainties surrounding the trade war, the US political situation and Brexit, the negative macro momentum has led to higher recession pricing. US bond yields are pricing in between one and two cuts from the Fed before the end of the year, while both implied volatility and volatility of volatility have increased sharply, and safe haven assets such as defensive FX and gold have also performed well recently. Reflecting this negative mood, the New York Fed’s probability of a recession within twelve months hit 38%, its highest level seen since 2008. Based on this, perhaps our song of choice should have been “Paint It, Black”. However, if black is the colour of current market sentiment, the facts are a bit less dark. Despite the current economic slowdown, we are far from recession. Firstly, recession historically means negative GDP growth, falling employment, muted wage growth and poor housing investment. Secondly, recession typically comes from two key elements: 1) An economic unbalance between supply and demand. This can come from monetary policy tightening which aims to prevent economic overheating by controlling the demand side, or from a shock in supply which pushes inflation to unsustainable levels. 2) An asset bubble that bursts because financial pricing has diverged from the real economy. Thirdly, when recession does kick in, the macro economic deterioration is broad, reaching all components of GDP, including housing, consumption, production, investment and employment. Does the current situation tick all of these boxes? The answer is a clear cut no. Since 1979, the National Bureau of Economic Research has identified four recessions in the US. On average, the ISM Manufacturing reading has been 42 during these periods, while Non-manufacturing was a bit higher at 46. One year before the official start of a recession, these figures were 49 and 53 respectively. Today, these numbers are at 47.8 and 52.6, far from recession levels but in line with 12-month forward ones, which would tend to confirm market expectations.“No Use in Crying” – Rolling Stones, 1981
What’s Next?
Did You Say “Recession”?
What is a Recession?
Where Are We Today?
However, the situation is very different in other key sectors of US economy. During recessionary periods, the consumer confidence reading from the Michigan University was, on average, at 70 and, one year before an official recession, it was at 84. We are currently at 93.2. The picture is similar for retail sales and household disposable income, which are at levels far from recession averages or one-year forward readings. Employment is a key component of US GDP and this remains solid, as reflected by the large employment creation numbers in September. During recessions, non-farm payrolls are negative (-225k on average since 1979) and at 88k one year before recessions. The latest number, released last week, was 136k and the average over the last twelve months has been 170k. Consequently, it would be difficult for us to agree with market sentiment about the high probability of recession in US within the next year.
That view is confirmed by our proprietary US Nowcaster, which tracks the US economy in real time by monitoring a large spectrum of data across the sub components of GDP: housing, durable goods consumption, production expectations, non-durable consumption, employment, financing conditions and investment. Currently, all components are in positive territory except for durable goods consumption, which is slightly negative. Historically, these components are all in negative territory one year ahead of a recession. To conclude, in terms of macro risks, there are currently few elements that validate the imminence of a negative outcome for the US economy. This view is also shared by the Fed, as illustrated by their economic forecasts for the coming years, which show US GDP close to its potential.

Risks Exist, But Investors Are Prepared
Risk is multidimensional and, beside macro risks, we monitor market sentiment and valuation, which can also drive asset returns over the short and medium term. Regarding these two dimensions, the global picture is more mixed. On the market sentiment side, confidence has been affected by negative news flow about impeachment and the unresolved situations around the trade war and Brexit. This has driven the recent risk aversion move and will continue to weigh on markets, with a worst-case scenario being a vicious cycle driven financial panic, freezing any investment decisions from corporates and households.
However, we believe that the surprise could be more on the upside than on the downside. Positioning in favour of risky assets is small and demand for hedging has been large. Consequently, any rally in the equity and credit space could trigger an unwinding of hedges and amplify the positive trend, which could lead to equity indices testing previous highs. It is not our central case scenario, but the odds for this are much higher than market expectations suggest.
Finally, contrary to 2001 or 2008, we do not see any bubble in the pricing of risky assets. Carry delivered by equity and credit spreads remains attractive
and is not disconnected from fundamentals, as shown by the continued growth in earnings over the last few years.
After 10 years of positive economic growth in the US, it is odd to bet on an end to this cycle. However, big data development and systematic signals are there to help investors to put the facts into perspective and then take advantage of markets overshooting. The robots are saying there is no recession on the horizon and we are listening to them, not crying, and maintaining our growth-oriented asset tilt in our dynamic asset allocation.

No Use in Crying

Our medium-term view is currently more constructive, as we are still overweight growth assets and underweight real assets. Given the current cost of hedging, we are using forex-based strategies exposures to hedge ourselves against adverse market conditions. Over October to date, the Multi Asset Risk Targeted Strategy is down 0.6% versus a fall of 1.1% for the MSCI AC World Index, while the Barclays Global Aggregate (USD hedged) is down 0.4%. Year-to-date, the Multi Asset Risk Targeted Strategy has returned 9.6% versus 14.9% for the MSCI AC World index and 9.2% for the Barclays Global Aggregate (USD hedged) index. * The Multi Asset Risk Targeted Strategy performance is shown in USD net of fees for the representative account of the Multi Asset Risk Targeted (Medium) USD Composite and reflects the deduction of advisory fees and brokerage commission and the reinvestment of all dividends and earnings. Past performance is not indicative of future performance. This information is presented as supplemental information only and complements the GIPS compliant presentation provided on the following page.Strategy Behaviour
Performance Review
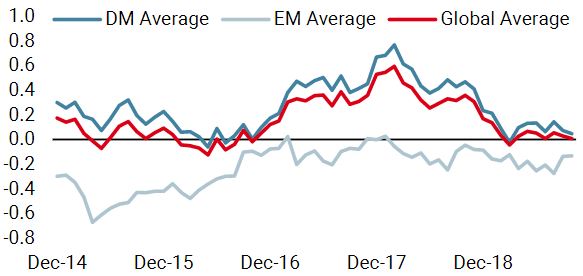
Unigestion Nowcasting
World Growth Nowcaster
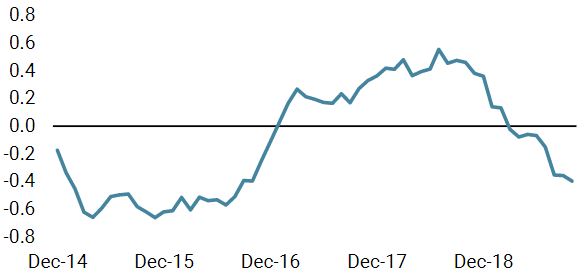
World Inflation Nowcaster
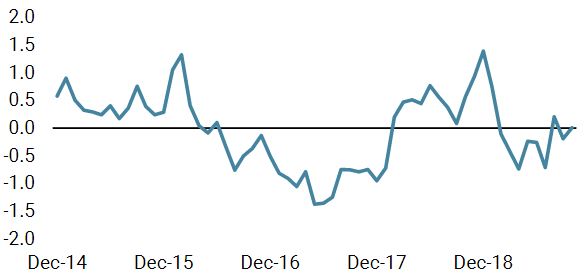
Market Stress Nowcaster
Weekly Change
- Our world Growth Nowcaster marginally decreased last week, essentially driven by weaker US data.
- Our world Inflation Nowcaster continued to stabilise last week, after a long period of decline.
- Market stress increased last week as volatility rose.
Sources: Unigestion. Bloomberg, as of 07 October 2019.
Important Information
Past performance is no guide to the future, the value of investments can fall as well as rise, there is no guarantee that your initial investment will be returned. This document has been prepared for your information only and must not be distributed, published, reproduced or disclosed by recipients to any other person. This is a promotional statement of our investment philosophy and services only in relation to the subject matter of this presentation. It constitutes neither investment advice nor recommendation. This document represents no offer, solicitation or suggestion of suitability to subscribe in the investment vehicles it refers to. Please contact your professional adviser/consultant before making an investment decision. Where possible we aim to disclose the material risks pertinent to this document, and as such these should be noted on the individual document pages. Please contact Unigestion for a complete list of all the applicable risks. Some of the investment strategies described or alluded to herein may be construed as high risk and not readily realisable investments, which may experience substantial and sudden losses including total loss of investment. These are not suitable for all types of investors. To the extent that this report contains statements about the future, such statements are forward-looking and subject to a number of risks and uncertainties, including, but not limited to, the impact of competitive products, market acceptance risks and other risks. As such, forward looking statements should not be relied upon for future returns. Data and graphical information herein are for information only and may have been derived from third party sources. Unigestion takes reasonable steps to verify, but does not guarantee, the accuracy and completeness of this information. As a result, no representation or warranty, expressed or implied, is or will be made by Unigestion in this respect and no responsibility or liability is or will be accepted. All information provided here is subject to change without notice. It should only be considered current as of the date of publication without regard to the date on which you may access the information. Rates of exchange may cause the value of investments to go up or down. An investment with Unigestion, like all investments, contains risks, including total loss for the investor.
This information is issued by Unigestion (UK) Ltd (“Unigestion”), which is authorised and regulated by the UK Financial Conduct Authority (“FCA”). Unigestion is also registered as an investment adviser with the U.S. Securities and Exchange Commission (“SEC”). This information is intended only for professional clients, institutional clients and eligible counterparties, as defined by the FCA, and qualified purchasers as defined by the SEC and has therefore not been adapted to retail clients.
Unigestion Multi Asset Risk-Targeted (USD): 31 December 2014 to 30 June 2019
| Year | Composite Return Gross of Fees |
Composite Net Return | Benchmark Return | Number of Accounts | Internal Dispersion | Composite 3-Yr Std Dev | Benchmark 3-Yr Std Dev | Composite AUM (M) | Firm AUM (M) |
| 2015 | -1.61% | -2.80% | – | 1 | – | – | – | 127.24 | 15,550.31 |
| 2016 | 5.05% | 3.79% | – | 1 | – | – | – | 129.66 | 18,144.46 |
| 2017 | 11.16% | 9.82% | – | 1 | – | – | – | 169.51 | 22,340.80 |
| 2018 | -2.91% | -4.08% | – | 1 | – | – | – | 286.93 | 21,403.49 |
| 20191 | 7.45% | 6.80% | – | 1 | – | – | – | 364.46 | 21,692.55 |
1: This year is incomplete, it stops in June.
Special Disclosure: For presentations prior to 31.03.2018 the strategy was measured against the LIBOR 3M USD + 4%. Beginning April 2018 the firm determined that the benchmark did not accurately reflect the strategy mandate and the benchmark was removed. Definition of the Firm: For the purposes of applying the GIPS Standards, the firm is defined as Unigestion. Unigestion is responsible for managing assets on the behalf of institutional investors. Unigestion invests in several strategies for institutional clients: Equities, Hedge Funds, Private Assets and the solutions designed for the clients of our Cross Asset Solution department. The GIPS firm definition excludes the Fixed Income Strategy Funds, which started in January 2001 and closed in April 2008, and the accounts managed for private clients. Unigestion defines the private clients as High Net Worth Families and Individual investors. Policies: Unigestion policies for valuing portfolios, calculating performance, and preparing compliant presentations are available upon request. Composite Description: The Multi Risk Targeted (Medium) composite was defined on 15 December 2014. It consists of accounts which aim to deliver consistent smooth returns of cash + 5% gross of fees across all market conditions over a 3-year rolling period. It seeks to achieve this by capturing the upside during bull markets while protecting capital during market downturns. Benchmark: Because the composites strategy is absolute return and investments are permitted in all asset classes, no benchmark can reflect this strategy accurately. Fees: Returns are presented gross of management fees, administrative fees but net of all trading costs and withholding taxes. The maximum management fee schedule is 1.2% per annum. Net returns are net of model fees and are derived by deducting the highest applicable fee rate in effect for the respective time period from the gross returns each month. List of Composites: A list of all composite descriptions is available upon request. Minimum Account Size: The minimum account size for this composite is 5’000’000.- USD. Valuation: Valuations are computed in US dollars (USD). Performance results are reported in US dollars (USD). Internal Dispersion & 3YR Standard Deviation: The annual composite dispersion presented is an asset-weighted standard deviation calculated for the accounts in the composite the entire year. When internal dispersion is not presented it is as a result of an insufficient number of portfolios in the composite for the entire year. When the 3 Year Standard Deviation is not presented it is as a result of an insufficient period of time. Compliance Statement Unigestion claims compliance with the Global Investment Performance Standards(GIPS®) and has prepared and presented this report in compliance with the GIPS standards. Unigestion has been independently verified for the periods 1 January 2003 to 31 December 2016. The verification report(s) is/are available upon request. Verification assesses whether (1) the firm has complied with all the composite construction requirements of the GIPS standards on a firm-wide basis and(2) the firms policies and procedures are designed to calculate and present performance in compliance with the GIPS standards. Verification does not ensure the accuracy of any specific composite presentation.