What Machine Learning Likes Q2 2022: Not All Value Metrics Are Created Equal
Client Portfolio Manager, Equities
Head of Equity Risk Premia
Key Points
- In developed markets, the correlation of our ML signal’s scores to Quality, Momentum and Low Vol were all positive and above their long-term average.
- In emerging markets, ML signals exhibited a positive correlation to Low Vol and Value, while Quality has become less favoured.
- Combining metrics with ML algorithms can achieve a more consistent risk-return profile and better capture the Value factor premium.
Executive Summary
Knowing the cyclicality of the different factors and signals, investors would do well to combine metrics with Machine Learning (ML) algorithms to achieve a more consistent risk-return profile and better capture the Value factor premium over the medium to long term. In developed markets, the ML model continues showing its preference for the Low Vol, Quality and Momentum styles. The Value factor is also continuing a renaissance that kicked off over a year ago and has enjoyed another powerful rise during the first half of 2022. ML algorithms have not neglected this return to form – their preference for Value has reverted back to neutral levels, even showing a small positive tilt. In emerging markets, the ML model continues to exhibit a strong positive correlation to Low Vol and Value, whilst Quality has become less and less desirable in recent months and currently sits at a neutral level today, significantly below its long-term average.
Market Review
Global equity markets finished lower in June and notched up big first-half falls, with US stocks suffering their steepest drop for the first six months since 1970. Central banks continue to be determined to fight inflation, although it may lead to lower growth which is strengthening investor concerns over stagflation. The Fed (+0.75%) and the BOE (+0.25%) continued to hike interest rates, while the SNB started along the same path with a 0.50% rate increase. On the other hand, the BOJ kept its super accommodative monetary policy and the ECB announced plans for a rate hike in July, along with asset purchases from peripheral countries as an anti-fragmentation tool. European inflation reached new highs, and European stocks decreased throughout the month, closing H1 with the worst six-month performance since 2008.
Emerging market equities also fell amid recession fears and a surging US dollar and experienced their largest first-half drop since the Asian financial crisis. Among emerging markets, Indian shares finished June in the red, recording their worst quarter since the pandemic amid fears of more aggressive central bank policies and slower growth. Taiwanese stocks also finished lower driven by the underperformance of semiconductor stocks given the slump in demand and consumer weakness. In contrast, Chinese stocks outperformed following PMIs that showed expansion. The China manufacturing and non-manufacturing PMIs came in better-than-expected with factory activity returning to expansion for the first time in four months.
Looking at the traditional risk premium factors, we saw a huge dispersion between developed and emerging markets. With the big swings in the market, we saw Lower Volatility stocks outperform in most developed markets as investors evaluated the macro environment and market dynamics, whilst the difference in performance between lower and higher volatility stocks in emerging markets was more muted. The Value factor, which has worked well for most of 2022 in both developed and emerging markets, was also more muted in June. In particular, it lagged Growth for the first time this year in emerging markets.
Not All Value Metrics are Created Equal
After a decade of disappointing performance, the Value factor has made a strong comeback since late 2020 following the breakthrough with the Covid vaccine. This has provided investors with some shelter to navigate a turbulent year-to-date. However, investors looking to capture this trade must be aware that not all value metrics are equal. Our ML algorithm gathers ~150 indicators across the spectrum of fundamental, technical, sentiment and alternative data sets to uncover the non-linear relationships between those indicators and the expected returns. When navigating the factor zoo within the Value factor category, we can see that not all value metrics are favoured by the ML algorithms. As illustrated in Figure 1, whilst the EBITDA to Enterprise Value, a ratio of a common proxy for operating cash flow, has gradually started to be favoured by the ML output, the Free Cash Flow to Book Value, which indicates the value the market places on the company’s ability to generate cash, has been the most positively correlated metric with the output from our ML stock selection model in the first half of 2022. Conversely, traditional price multiples such as Book to Price and Sales to Price are unfavoured value signals.
In a rising interest rate environment where inflation over the past 12 months has exceeded 8%, a level that brings back memories of America’s Great Inflation of the 1960s and ’70s, the choice from ML makes perfect sense as companies with high free cash flow have strong balance sheets and cash reserves enabling them to grow even in a more hawkish environment. They have traditionally outperformed peers when rates are rising given such companies can continue to expand businesses, pay debts, pay dividends, buy back stock, and even make acquisitions.
Paraphrasing Buffett again from his 2000 Annual Letter, “Common yardsticks such as dividend yield, the ratio of price to earnings or to book value, and even growth rates have nothing to do with valuation except to the extent they provide clues to the amount and timing of cash flows into and from the business.”, further shows the importance of this signal.
Figure 1: Value Component’s Correlation with ML Output
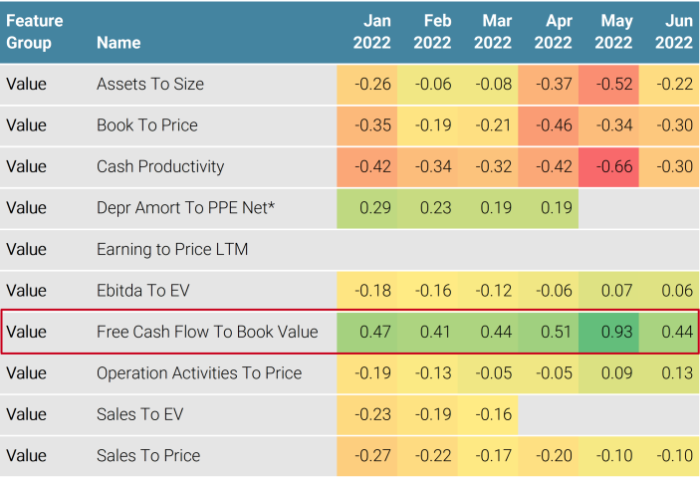
Source: Unigestion, S&P Capital IQ, and MSCI. Data as at June 2022.
Reading notes: *Amortization and depreciation to Property, Plant, and Equipment.
Knowing the cyclicality of the different factors and signals, investors could combine metrics to achieve a more consistent risk-return profile and better capture the Value factor premium over the medium to long term. Using multiple metrics with various weighting schemes would also provide a diversification benefit. While the correlation of returns to those metrics might be highly positive, they aren’t perfectly so over a certain period. We try to exploit this by using ML’s predictive power, handling a large amount of data, detecting non-linear relationships, discovering and learning patterns in various metrics, and subsequently constructing mathematical models to enable predictions on future data.
As illustrated in Figure 2A, we apply the dynamic weighting scheme using the ML algorithm, which aims to overweight the metrics which are favoured by the ML stock selection model and share more common ground with others and underweight (or even eliminate) the undesired ones. By doing so, the ML Dynamic Value composite has improved the Value factor’s risk-adjusted performance and reduced the maximum drawdown at a reasonable tracking error level and turnover.
Figure 2A: ML – Driven Allocations to Value Metrics
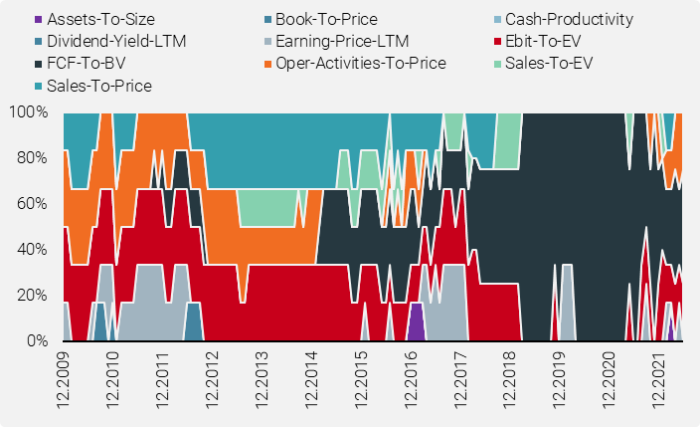
Source: Unigestion, S&P Capital IQ, and MSCI. Data as at June 2022.
Figure 2B: ML Weighted Value Factor Performance
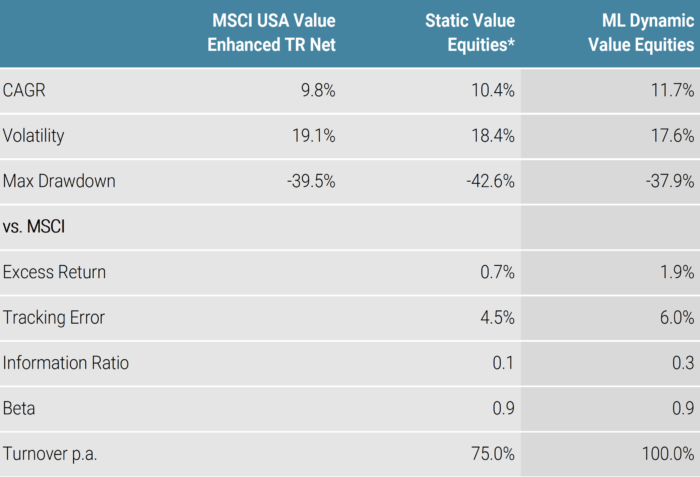
Source: Unigestion, S&P Capital IQ, and MSCI. Dec 2009 – Jun 2022.
Reading note:*A mix of P/E, P/S, P/B and EV/EBIT with equal weighting.
Navigating the Factor Zoo: Low Vol Continues to Go full Steam Ahead in Developed Markets
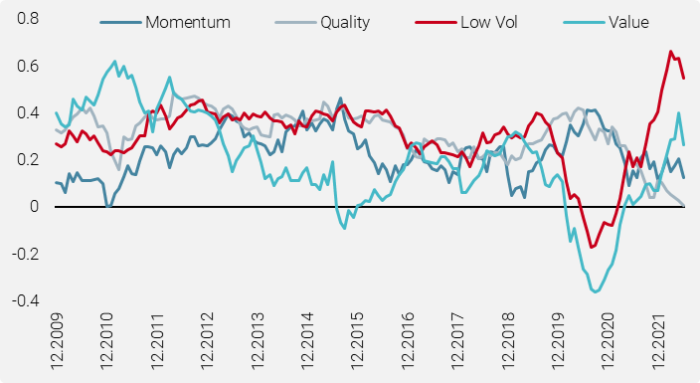
In developed markets, lower US Treasury rates do not just represent falling inflation expectations as investors priced in the likelihood the Fed will force inflation down to near its target rate, but also reflect a risk-off sentiment among investors as well as the risk of recession. This has been learnt by the ML model, and the model continued showing its preference for the Low Vol factor with a positive correlation, as shown in Figure 3. Quality and Momentum were also favoured in June, and throughout H1 2022, given the positive correlations with ML signals’ score. Despite Quality lacking its lucrative performance in recent quarters, we believe the rationale behind the ML signal’s fondness for it comes from two fronts. Firstly, companies with higher quality features tend to fare better during times of economic slowdown, and, as our proprietary macro Nowcasters are indicating, this is exactly what we are experiencing now. Secondly, given the current inflationary regime is expected to be with us for a while, companies with higher profitability are better placed to digest and absorb these cost increases than lower quality (or non-profitable) companies.
The Value factor has continued its renaissance, enjoying another powerful rise during the first half of 2022. ML algorithms have not neglected this trend and their preference for Value (as measured by correlation) has reverted back to neutral levels, even showing a small positive tilt.
Figure 3: ML Score Correlations in Developed Markets
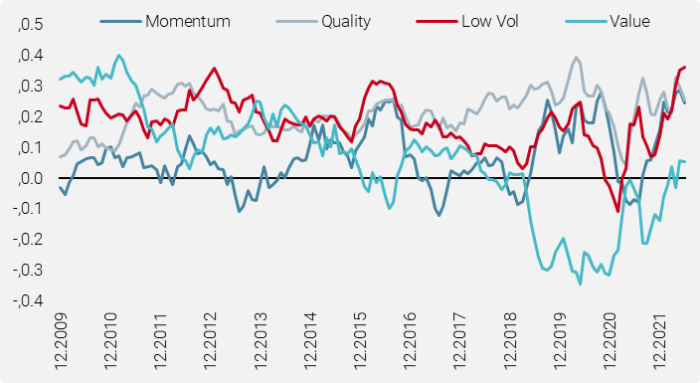
Source: Unigestion, Compustats, CiQ. Data as at June 2022.
With the risk-off sentiment and recession risk concerns, the ML model is leaning even more towards traditional defensive sectors, notably on Utilities (up 3.8%), Health Care (up 3%) and Consumer Stables (up 2.1%), as shown in Figure 4.
Figure 4: : ML Model Portfolio’s Sector Allocation in Developed Markets
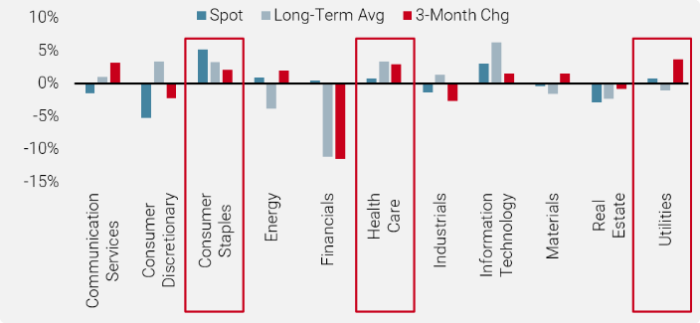
Source: Unigestion, Compustats, CiQ. Data as at June 2022.
ML Cautious of Quality in Emerging Markets
In emerging markets, ML signals continue to exhibit a strong positive correlation to Low Vol and Value after a dip from 2020 to early 2021. In contrast to the broad risk aversion mode in developed markets, ML signals did recognise the recent divergence in emerging markets with higher beta and more volatile stocks outpacing, and went down from its all-time high readings of 0.67 over the past 13 years. Notably, Quality has become less and less desirable in recent months, currently sitting at a neutral level today, significantly below its long-term average, as shown in Figure 5.
Figure 5: ML Score Correlations in Emerging Markets
Source: Unigestion, Compustats, CiQ. Data as at June 2022.
Despite the decreasing correlation between ML signals and the Quality factor, when navigating through the factor zoo, we found that Quality-anchored metrics still dominated the top 20 most important features that derive the ML signal forecast scores. As shown in Figure 6, both profitability-related metrics, such as Operating Cash Flow on Total Assets, EBITDA Margin and Free Cash Flow to Equity, exhibited a positive correlation with the ML signal. The highly volatile market environment ensured a spot routinely occupied by the risk features. The strong negative correlation between high-risk features and the ML signal further implied the preference for low volatility characteristics in emerging markets.
Figure 6: ML Score Correlations by Factor
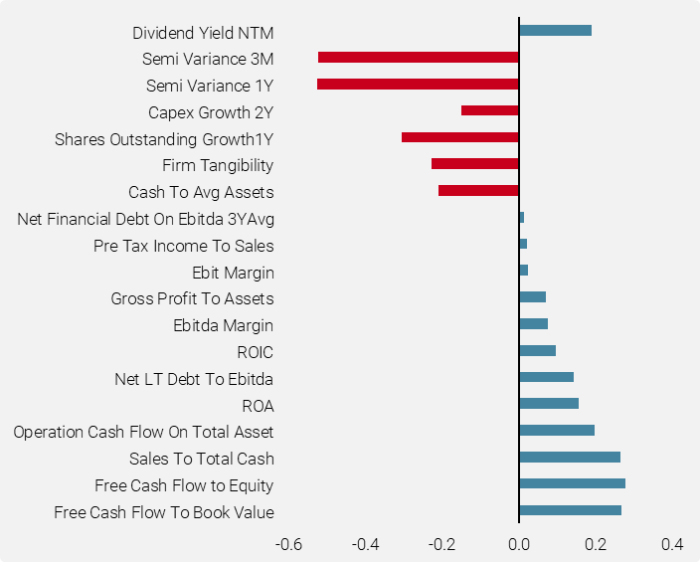
Source: Unigestion, Compustats, CiQ. Data as at June 2022.
Important information
Past performance is no guide to the future, the value of investments, and the income from them change frequently, may fall as well as rise, there is no guarantee that your initial investment will be returned. This document has been prepared for your information only and must not be distributed, published, reproduced or disclosed by recipients to any other person. It is neither directed to, nor intended for distribution or use by, any person or entity who is a citizen or resident of, or domiciled or located in, any locality, state, country or jurisdiction where such distribution, publication, availability or use would be contrary to law or regulation.
This is a promotional statement of our investment philosophy and services only in relation to the subject matter of this presentation. It constitutes neither investment advice nor recommendation. This document represents no offer, solicitation or suggestion of suitability to subscribe in the investment vehicles to which it refers. Any such offer to sell or solicitation of an offer to purchase shall be made only by formal offering documents, which include, among others, a confidential offering memorandum, limited partnership agreement (if applicable), investment management agreement (if applicable), operating agreement (if applicable), and related subscription documents (if applicable). Please contact your professional adviser/consultant before making an investment decision.
Where possible we aim to disclose the material risks pertinent to this document, and as such these should be noted on the individual document pages. The views expressed in this document do not purport to be a complete description of the securities, markets and developments referred to in it. Reference to specific securities should not be considered a recommendation to buy or sell. Unigestion maintains the right to delete or modify information without prior notice. Unigestion has the ability in its sole discretion to change the strategies described herein.
Investors shall conduct their own analysis of the risks (including any legal, regulatory, tax or other consequences) associated with an investment and should seek independent professional advice. Some of the investment strategies described or alluded to herein may be construed as high risk and not readily realisable investments, which may experience substantial and sudden losses including total loss of investment. These are not suitable for all types of investors.
To the extent that this report contains statements about the future, such statements are forward-looking and subject to a number of risks and uncertainties, including, but not limited to, the impact of competitive products, market acceptance risks and other risks. Actual results could differ materially from those in the forward-looking statements. As such, forward looking statements should not be relied upon for future returns. Targeted returns reflect subjective determinations by Unigestion based on a variety of factors, including, among others, internal modeling, investment strategy, prior performance of similar products (if any), volatility measures, risk tolerance and market conditions. Targeted returns are not intended to be actual performance and should not be relied upon as an indication of actual or future performance.
No separate verification has been made as to the accuracy or completeness of the information herein. Data and graphical information herein are for information only and may have been derived from third party sources. Unigestion takes reasonable steps to verify, but does not guarantee, the accuracy and completeness of information from third party sources. As a result, no representation or warranty, expressed or implied, is or will be made by Unigestion in this respect and no responsibility or liability is or will be accepted. All information provided here is subject to change without notice. It should only be considered current as of the date of publication without regard to the date on which you may access the information. Rates of exchange may cause the value of investments to go up or down. An investment with Unigestion, like all investments, contains risks, including total loss for the investor.
Legal Entities Disseminating This Document
UNITED KINGDOM
This material is disseminated in the United Kingdom by Unigestion (UK) Ltd., which is authorized and regulated by the Financial Conduct Authority (“FCA”). This information is intended only for professional clients and eligible counterparties, as defined in MiFID directive and has therefore not been adapted to retail clients.
UNITED STATES
This material is disseminated in the United States by Unigestion (UK) Ltd., which is registered as an investment adviser with the U.S. Securities and Exchange Commission (“SEC”). All inquiries from investors present in the United States should be directed to Clients@unigestion.com at Unigestion (UK) Ltd. This information is intended only for institutional clients and qualified purchasers as defined by the SEC and has therefore not been adapted to retail clients.
EUROPEAN UNION
This material is disseminated in the European Union by Unigestion Asset Management (France) SA which is authorized and regulated by the French “Autorité des Marchés Financiers” (“AMF”).
This information is intended only for professional clients and eligible counterparties, as defined in the MiFID directive and has therefore not been adapted to retail clients.
CANADA
This material is disseminated in Canada by Unigestion Asset Management (Canada) Inc. which is registered as a portfolio manager and/or exempt market dealer in nine provinces across Canada and also as an investment fund manager in Ontario, Quebec and Newfoundland & Labrador. Its principal regulator is the Ontario Securities Commission (“OSC”). This material may also be distributed by Unigestion SA which has an international advisor exemption in Quebec, Saskatchewan and Ontario. Unigestion SA’s assets are situated outside of Canada and, as such, there may be difficulty enforcing legal rights against it.
SWITZERLAND
This material is disseminated in Switzerland by Unigestion SA which is authorized and regulated by the Swiss Financial Market Supervisory Authority (“FINMA”).
Document issued July 2022.