Raw materials, especially oil, have had a strong start to the year, in line with our scenario of reflation followed by inflation. Last week, we focused on the bond world but this week it is oil’s turn to take centre stage. We are seeing an alignment of planets in this market. Demand is rising and should continue to do so but the market still lacks conviction, leaving an interesting way to gain exposure to the inflation theme.

The Crude Oil Blues

What’s Next?
The law of supply and demand – but mostly demand
It is customary to analyse fluctuations in the price of raw materials through two prisms: supply and demand. In 2015, the drop in oil prices was partly explained by the increase in US production, according to a study by the BIS1 (2018). In 2020, weak demand following the temporary closure of the world economy was accompanied by a fall in prices, according to a study by the ECB2 (2020). An analysis of the extent of the role of demand and supply based on the performance of the Consumer and Energy sectors of the MSCI World index attributes much of this performance to the recent oil price recovery. Our estimates show that most of the recent rise in oil prices – approximately +30% since the beginning of the year – seems to stem from a significant demand effect, as supply has remained relatively insensitive to price fluctuations. The same was true, according to the same estimates, during the recoveries in 2003 and 2009. This time, supply may also be lagging as (1) shale oil producers have not ramped up their production on still-low forward prices and (2) energy companies have been using cash for buy-backs rather than investment, explaining the lower production capacity.
The lesson here from these historical analyses is that investor attention should focus more on supply than on demand during recoveries. Another way to see this is to compare the evolution of oil demand and supply figures since the beginning of the year, published by the US Department of Energy. The supply of oil reached a low point of 88m barrels per day, but has only marginally recovered and now stands at around 93m barrels. What about demand? In April 2020, demand collapsed to 81m barrels but returned to 96m last December and stands at 93m today. Unsurprisingly, oil stocks have fallen since June 2020 by 80m barrels: stocks remain high, but their trend is further evidence that it is demand that leads the way.
What kind of demand are we talking about?
Demand explains a large part of the rise in oil prices, but what is its trajectory? If demand continues to do well while supply seems relatively insensitive in the short term, it seems logical to anticipate that oil prices will continue to rise. Our growth indicators (“Growth Nowcasters” and “Growth Newscasters”) have recently shown some volatility, reflecting the uncertainty generated by the tail end of the current pandemic. Over the last two weeks, their indications have become clearer: in the US, Europe and China, economic growth looks good to very good. In the US, 53% of the data in our Growth Nowcaster is improving, after a shift to around 40% in early February. All components of our US indicator are up, with the exception of consumption of durable and non-durable goods. The same applies to China and the Eurozone. We do not believe that this macro trend is ready to weaken in the immediate future, given the significant household savings that have yet to be invested into the global economy.
Beyond the trend in demand, it also seems necessary to analyse which country or economic zone has the greatest demand that can influence oil prices. When analysing the beta of oil prices to our Growth Nowcasters, we draw two important conclusions. First, over the period 2009-2021, China is the economic zone to which oil prices have the highest beta. Secondly, if the relative importance of the Eurozone and the US seemed to have decreased between 2009 and 2016, this is no longer the case. The Eurozone takes second place on the podium of these beta, and while the US is last, it remains a zone likely to exert pressure on the price per barrel. This ranking blends quite well with the relative levels of our Nowcasters: our Chinese indicator is positive (+0.20 standard deviations), our US indicator is at zero standard deviations while our indicator for the Eurozone is marginally negative (-0.20). The strong Chinese macro picture suggests that the future direction of oil prices is up and not down. Is this the consensus in the market?
Markets are hard to convince
This scenario of rising oil prices is evident in the macro data but not in the market. We observe this in three different ways. First, while it is clear that the spot prices of the black gold have risen since the beginning of the year, they have still not returned to their pre-pandemic levels. The year-on-year change in the Bloomberg Energy index thus remains negative (-18%). Secondly, this price increase was achieved by translating the term structure of futures upwards in an almost homothetic manner: the oil price curve remains in backwardation. The market thus anticipates that this rise in oil prices will likely not be permanent. The December 2021 future stands at USD 59 for a spot price of USD 63, indicating that the market does not anticipate a price increase between now and the end of the year but rather a limited decrease. It is precisely the continuation of this backwardation situation that leads our valuation indicators to contrast (cheap) raw materials with (expensive) growth assets. Finally, the last element that, in our opinion, reveals the market’s lack of conviction regarding the rise in oil prices is the situation with “commodity currencies”. While these have performed remarkably well since the beginning of the year, a comparison of their current performance against the evolution of spot commodity prices shows a lag. Here again, sentiment lacks positivity, leaving – it seems to us – an interesting relative valuation opportunity.
From reflation to inflation, oil is part of the next step
Our core scenario is unchanged: steadily rising inflation over the year, with higher-than-expected inflation as the main risk. If the market decides that demand can drive raw materials to higher levels on a sustainable basis, that risk gains credibility. While we have moderated our dynamic positioning only slightly for the moment, we see commodities and the currencies attached to them as a way of hedging against the risks that inflation poses to markets.
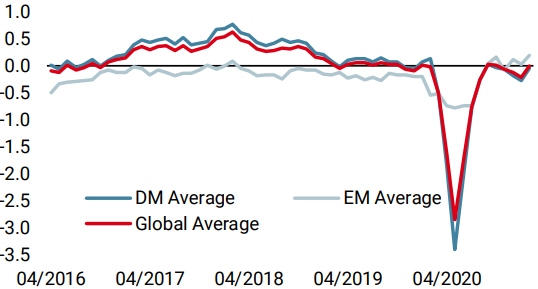
Unigestion Nowcasting
World Growth Nowcaster
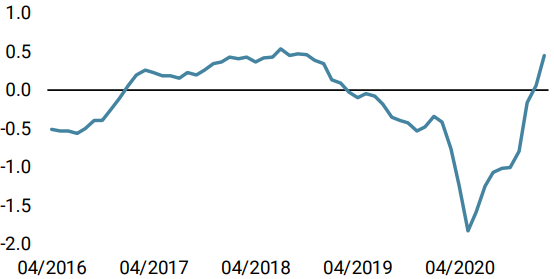
World Inflation Nowcaster
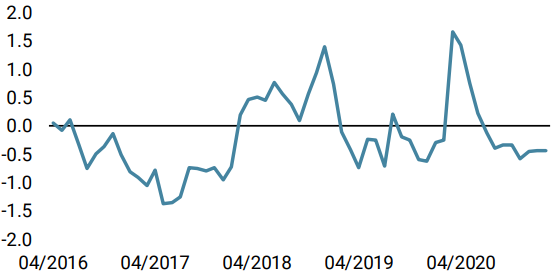
Market Stress Nowcaster
Weekly Change
- Last week, our World Growth Nowcaster increased as US data improved significantly. Recession risk is low.
- Our World Inflation Nowcaster increased again, especially on the US front. Inflation risk is very high.
- Our Market Stress Nowcaster increased slightly as its volatility component edged higher.
Sources: Unigestion. Bloomberg, as of 26 February 2021.
1Identifying oil price shocks and their consequences: the role of expectations in the crude oil market, Takuji Fueki, Hiroka Higashi, Naoto Higashio, Jouchi Nakajima, Shinsuke Ohyama and Yoichiro Tamanyu, 2018.
2Global financial markets and oil price shocks in real time. Fabrizio Venditti and Giovanni Veronese. ECB Working Paper 2020.
Important Information
This document is provided to you on a confidential basis and must not be distributed, published, reproduced or disclosed, in whole or part, to any other person.
The information and data presented in this document may discuss general market activity or industry trends but is not intended to be relied upon as a forecast, research or investment advice. It is not a financial promotion and represents no offer, solicitation or recommendation of any kind, to invest in the strategies or in the investment vehicles it refers to. Some of the investment strategies described or alluded to herein may be construed as high risk and not readily realisable investments, which may experience substantial and sudden losses including total loss of investment.
The investment views, economic and market opinions or analysis expressed in this document present Unigestion’s judgement as at the date of publication without regard to the date on which you may access the information. There is no guarantee that these views and opinions expressed will be correct nor do they purport to be a complete description of the securities, markets and developments referred to in it. All information provided here is subject to change without notice. To the extent that this report contains statements about the future, such statements are forward-looking and subject to a number of risks and uncertainties, including, but not limited to, the impact of competitive products, market acceptance risks and other risks.
Data and graphical information herein are for information only and may have been derived from third party sources. Although we believe that the information obtained from public and third party sources to be reliable, we have not independently verified it and we therefore cannot guarantee its accuracy or completeness. As a result, no representation or warranty, expressed or implied, is or will be made by Unigestion in this respect and no responsibility or liability is or will be accepted. Unless otherwise stated, source is Unigestion. Past performance is not a guide to future performance. All investments contain risks, including total loss for the investor.
Unigestion SA is authorised and regulated by the Swiss Financial Market Supervisory Authority (FINMA). Unigestion (UK) Ltd. is authorised and regulated by the UK Financial Conduct Authority (FCA) and is registered with the Securities and Exchange Commission (SEC). Unigestion Asset Management (France) S.A. is authorised and regulated by the French “Autorité des Marchés Financiers” (AMF). Unigestion Asset Management (Canada) Inc., with offices in Toronto and Montreal, is registered as a portfolio manager and/or exempt market dealer in nine provinces across Canada and also as an investment fund manager in Ontario and Quebec. Its principal regulator is the Ontario Securities Commission (OSC). Unigestion Asset Management (Copenhagen) is co-regulated by the “Autorité des Marchés Financiers” (AMF) and the “Danish Financial Supervisory Authority” (DFSA). Unigestion Asset Management (Düsseldorf) SA is co-regulated by the “Autorité des Marchés Financiers” (AMF) and the “Bundesanstalt für Finanzdienstleistungsaufsicht” (BAFIN).