Despite the confirmation of a strong global economic recovery, interest rates fell last month. This decline is the result of both a fall in the inflation premium and a decline in the growth premium embedded in the nominal rates of sovereign bonds. This easing in interest rates has led to a reversal in the trends observed during the first three months of the year in terms of sector, factor and asset rotation. Despite this reverse rotation, we believe that the scenario of a sustainable and global reflation remains intact and we continue to hold a tilt in favour of the most cyclical assets in our portfolios in order to benefit from the acceleration in global growth that we anticipate over the coming months.

Running Up that Hill

What’s Next?
Reverse rotation
On the surface, the past month has confirmed its positive seasonality. Global equity indices posted their best monthly performance for 2021: the MSCI AC index rose 4.4% in April, high yield credit spreads tightened by about 20 basis points (bps) and commodities continued to rise with new highs for copper and Brent oil. However, beneath the surface, dispersion within asset returns across sectors and styles remained very high – but in the opposite direction to that observed in Q1. The fall in bond yields, particularly in the US (-12bps for the 10-year US bond), affected the “pair trades” playing the reflation theme. Thus, cyclical assets underperformed defensive or “quality” assets. The most representative element of this reverse rotation is the outperformance of the Nasdaq (+5.4%) versus the Russell 2000 (+2.1%) and monthly performance differential between the MSCI Energy sector (0.3%), which was the best performer in Q1, and the Technology sector (+5.4%). Unsurprisingly, in this context of bond yield decline, the MSCI Value factor (+3.0%) underperformed the MSCI Momentum factor (+6.8%). Within the bond market, performance differences were also significant. Thus, spreads on US rates narrowed significantly, by about 10bps for bunds and 8bps for gilts. The yield curve also flattened by 12bps in the US, having steepened continuously by more than 145bps since mid-2020. The reverse rotation extended to currencies as the US dollar’s rise in the first few months of the year was halted by a strengthening in emerging currencies and most developed country currencies against the greenback.
We see this as short lived
However, it is important to note that despite this “reverse rotation” seen in April, the ranking of performances by asset, sector or factor remains unchanged since the beginning of the year with a clear leadership in cyclical assets. In our view, this trend is therefore more an adjustment of expectations through profit-taking than a radical change of theme and market drivers. Different factors have driven the decline in bond yields:
- The Japanese fiscal new year starting in April and resulting in the buying of bonds (after the sell-off in March), as well as some pension funds rebalancing out of equities into fixed income assets.
- CTA short-covering is also thought to have exacerbated the rally.
- Money-market funds have seen cash inflows over the last few weeks.
- Trades going through the rates options market recently are also sending signals that this summer may see a sell-off in risk assets with a flight to quality.
Although these elements matter and should be monitored closely, we view them as technical and short term. Consequently, we continue to believe that the Reflation / Rotation / Dispersion sequence will continue over the next few months and even increase as lockdown measures ease and economies reopen. Our macro risk-based process, which is based on a regular and disciplined monitoring of the different risk dimensions, leads us to remain overexposed to cyclical assets such as cyclical commodities, inflation breakevens and the most cyclically sensitive equity indices such as the Topix or the Russell 2000.
Our Nowcasters point to an expansion phase on the horizon
This positioning is based primarily on our Nowcaster and Newscaster indicators, which point to a significant acceleration in the global economic cycle. Our Growth Nowcasters for the US, China and Europe are all up and close to their highest levels since 2015. An analysis of the components reinforces the message of a change in economic pace as the most cyclical ones are all up sharply. The “Production Expectations” component, which is the most advanced element, is at record levels for the US and the Eurozone, while the “External Demand” component for China sends a similar message of accelerating growth. Only the “Non-Durable Consumption” component remains in negative territory. But it is expected to rise sharply in the coming weeks as the European and US economies open up completely. This message is also confirmed by our Inflation Nowcasters and Newscasters. All the elements, including “Imported Prices”, “Cost” and “Supply Effect”, reflect both a marked increase in demand for sub-components of consumer goods and supply constraints due to shortages of many products and components.
All of these macroeconomic elements are supportive for growth and real assets, and are coupled with a very accommodative monetary environment as evidenced by the latest messages from the ECB, Fed and BoJ over the past few days. With the exception of the BoC, which announced a gradual withdrawal of monetary support in 2021, the majority of central banks have demonstrated their patience with the pace of economic normalisation and tolerance for what they perceive to be a temporary inflation shock.
Market sentiment looks more supportive for cyclical assets
If the fundamentals seem solid and improving, what about market sentiment? Our various indicators developed to track the level of investors’ current risk appetite and to monitor investors’ positioning indicate a more favorable and stable situation than at the beginning of the year. On the one hand, this is because the pockets of exuberance have mostly been partially adjusted downwards. The “Renewable” theme as a whole has corrected by about 30% since our warning at the end of January, and the SPAC complex has also corrected by between 15% and 20% depending on the segment since its February high. Finally, leadership is more even among equity indices, as highlighted by the strong performance of equal-weighted indices versus their market cap counterparts. Our “Market Stress” indicator is currently at the “very low” level versus “neutral” at the end of January. Historically, our analysis shows that growth assets deliver better risk-adjusted performance on average in this type of regime. Our study of the beta of the most flexible and active players also shows that, although rising, their beta to equities remains far from their highs and, above all, their exposure to real assets, which historically benefit most from periods of inflation surprise, is still low. Combined with a still steep VIX curve and a very high implied realised volatility spread, these elements also highlight a preference for assets that are more sensitive to the global cycle and inflation at the expense of defensive or so-called “income” assets.
Valuation could be an issue
Within our analysis framework, only the “valuation” part is a negative factor for these cyclical assets. Various indicators still show a very high valuation for equities and breakeven inflation, even taking into account the historically low level of interest rates via a dividend discount model analysis. Our findings show that for equities, the majority of indices, whether for Price/Sales, Price/EBITDA, Price/Book or Price/Earning, are extremely expensive relative to their history: above the 95th percentile. Historically, the performance for the following six months tends to be negative: 2.8% on average for the MSCI World, 19% for the Eurostoxx and 7% for the MSCI Emerging Markets indices. Only the S&P 500 and the SMI show a slightly positive performance over the following six months when valuation levels are above the 90th percentile. The reaction of equity markets during the earnings season underlines the extent to which expectations were high and good news was already incorporated into stock prices. Thus, on average, the daily performance of S&P 500 stocks that beat the earnings consensus was negative -0.4% compared to +0.7% on average since 2016. This is the second consecutive quarter that the reaction has been negative, after a similar pattern followed Q4 2020 earnings. A positive view would note that this did not prevent global indices from reaching new highs in the following months.
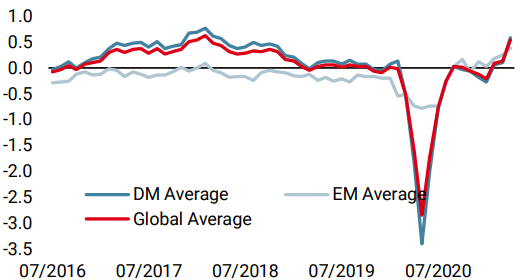
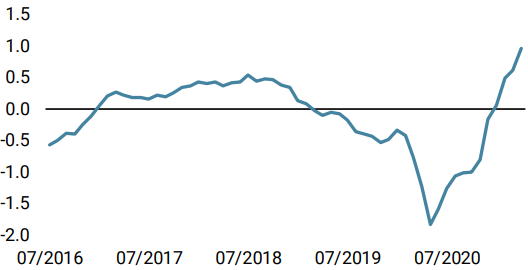
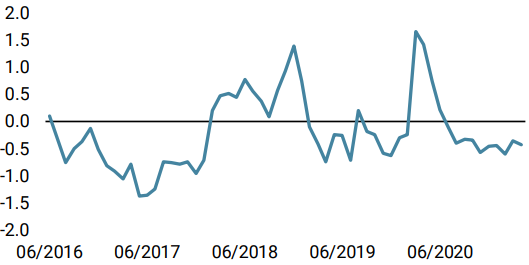
Unigestion Nowcasting
World Growth Nowcaster
World Inflation Nowcaster
Market Stress Nowcaster
Weekly Change
- Last week, our World Growth Nowcaster increased significantly due to stronger readings in the US data.
- Our World Inflation Nowcaster has stabilised at very elevated levels: inflation risk remains very high.
- Our Market Stress Nowcaster declined, largely due to an ebbing of volatility.
Sources: Unigestion. Bloomberg, as of 29 April 2021.
Important Information
This document is provided to you on a confidential basis and must not be distributed, published, reproduced or disclosed, in whole or part, to any other person.
The information and data presented in this document may discuss general market activity or industry trends but is not intended to be relied upon as a forecast, research or investment advice. It is not a financial promotion and represents no offer, solicitation or recommendation of any kind, to invest in the strategies or in the investment vehicles it refers to. Some of the investment strategies described or alluded to herein may be construed as high risk and not readily realisable investments, which may experience substantial and sudden losses including total loss of investment.
The investment views, economic and market opinions or analysis expressed in this document present Unigestion’s judgement as at the date of publication without regard to the date on which you may access the information. There is no guarantee that these views and opinions expressed will be correct nor do they purport to be a complete description of the securities, markets and developments referred to in it. All information provided here is subject to change without notice. To the extent that this report contains statements about the future, such statements are forward-looking and subject to a number of risks and uncertainties, including, but not limited to, the impact of competitive products, market acceptance risks and other risks.
Data and graphical information herein are for information only and may have been derived from third party sources. Although we believe that the information obtained from public and third party sources to be reliable, we have not independently verified it and we therefore cannot guarantee its accuracy or completeness. As a result, no representation or warranty, expressed or implied, is or will be made by Unigestion in this respect and no responsibility or liability is or will be accepted. Unless otherwise stated, source is Unigestion. Past performance is not a guide to future performance. All investments contain risks, including total loss for the investor.
Unigestion SA is authorised and regulated by the Swiss Financial Market Supervisory Authority (FINMA). Unigestion (UK) Ltd. is authorised and regulated by the UK Financial Conduct Authority (FCA) and is registered with the Securities and Exchange Commission (SEC). Unigestion Asset Management (France) S.A. is authorised and regulated by the French “Autorité des Marchés Financiers” (AMF). Unigestion Asset Management (Canada) Inc., with offices in Toronto and Montreal, is registered as a portfolio manager and/or exempt market dealer in nine provinces across Canada and also as an investment fund manager in Ontario and Quebec. Its principal regulator is the Ontario Securities Commission (OSC). Unigestion Asset Management (Copenhagen) is co-regulated by the “Autorité des Marchés Financiers” (AMF) and the “Danish Financial Supervisory Authority” (DFSA). Unigestion Asset Management (Düsseldorf) SA is co-regulated by the “Autorité des Marchés Financiers” (AMF) and the “Bundesanstalt für Finanzdienstleistungsaufsicht” (BAFIN).