This week, for the first time since December 1995, the Federal Reserve will almost certainly ease its monetary policy despite the US economy being far from recession. Consequently, financial markets are divided on the extent and the duration of the upcoming Fed easing. In this weekly note, we analyse previous Fed easing cycles in order to assess the likely impact for financial assets and the global economy. We believe that central banks are ready to do “whatever it takes” to reduce the risk of recession, firstly by lowering short-term rates and secondly, if needed, by restarting quantitative easing. So, sit back and relax, central banks will save markets once again. In 1987, speaking to a Senate Committee, the then Fed president, Alan Greenspan, spoke the famous sentence: “If I seem unduly clear to you, you must have misunderstood what I said”. More than three decades later, the situation has dramatically changed. Central banks around the world have increased their efforts to be transparent by enhancing communication about policy decisions and their assumptions about the economy. Now, with clear forward-looking guidance on policy, dot projections and regular reviews of monetary policy strategy, tools and communication, the stance of central banks is well known and understood by financial markets.“Relax” – Frankie Goes to Hollywood, 1984
What’s Next?
Transparency vs history
Currently, the message appears to be crystal clear: significant easing is on the horizon. Since the beginning of the year, central banks in New Zealand and Australia have cut their rates. The trend is similar in the emerging world, with cuts in India, Malaysia and Russia. Europe, Canada, Mexico and the US are all set to follow, as reflected by the forward curves for these countries.
Based on recent Fed speeches, it appears almost certain that they will cut rates in 2019. Over the last six months, this transparency on the monetary policy outlook has helped markets to stabilise after the turmoil of last year. As a result, uncertainty is very low ahead of this week’s meeting. We expect a 25 bps cut this week and then a second, similar cut before the end of the year. Currently, the market is forecasting an easing of 100 bps over the next twelve months.
Compared to what has happened in the past, this pricing is either too large if the US economy continues to grow at or slightly below potential, or too small if recession risks increase markedly in the coming months.
Since 1990, there have been five easing cycles in the US. Apart from in 1998, markets have consistently underestimated the amplitude of the Fed action. In our analysis, we have compared six-month expectations, as measured by the Fed Fund curve at the starting date of the easing cycle, with the realised six-month change in the Fed Fund rates. In 1989, markets expected 100 bps of cuts and the Fed delivered 150 bps. In 1995, expectations were for 50 bps and the Fed eased by 75 bps. In 1998, expectations matched the 75 bps of easing delivered by the Fed.
In 2000, markets priced in only 50 bps of cuts against actual cuts of 250 bps within six months. Finally, in 2007, as in 2000, Fed easing was large and quick with 225 bps of easing within six months versus the 75 bps expected. Conclusion: financial markets seem blind when they have to evaluate the depth of the economic slowdown and the speed of the downward dynamic. Therefore, they tend to underestimate the size of central bank action.

At this stage of the US cycle, our proprietary US GDP Nowcaster, which tracks the US economy in real time, does not point to any risk of recession in the coming months. However, we are convinced that the Fed has all the tools to act if necessary and will not need to wait for symptoms of recession to activate significant levels of easing. In fact, the Fed has room to lower rates and then to steepen the curve because they are the only central bank to have normalised its monetary policy over the last four years. With its current balance sheet at 2013 levels, the Fed also has room to expand its balance sheet. But why would the Fed ease more than market expectations if recession risk remains low? We believe that the Fed is more concerned about the current inflation dynamic rather than the economic outlook. In their latest monetary policy report submitted to Congress, the Fed highlighted five monetary policy rules (https://www.federalreserve.gov/monetarypolicy/2019-07-mpr-part2.htm). Four of the five rules concern the difference between the sustainable long-term rate of unemployment and the current unemployment rate, and the difference between recent inflation and the FOMC’s longer-run objective. The fifth one, the price-level rule, takes into consideration the deviation of inflation from the long-run objective in earlier periods as well as the current period. The other rules do not consider the past misses of the inflation objective. This price-level targeting rule was favoured by former Fed chairman Ben Bernanke to face effective lower bound (ELB) challenges in 2017. In the latest report, this rule is the only one below the current Fed Fund rate. Moreover, the recommended rates of the price level rule are closer to 0 than to 225 bps below current rates, roughly the size of the six month easing cycle in 2000 and 2007. Anticipating large moves from central banks means forecasting a high risk of recession. Historically, such a context has not been favourable for growth-oriented assets and they have underperformed government bonds. Since 1989, in the six months following the first Fed cut, US equities have delivered an average return of 5%. However, the dispersion has been large, with a 28% return in 1998 and a 13% loss in 2007.Risk scenario is “Dovishness” not “Hawkishness”
“Bad is good” or “bad becomes bad”

Relax

Our medium-term views remain cautious, and we prefer to get exposure to growth via high yield corporate credit. We are also complementing our equity exposure with options to protect the portfolio in the case of equity drawdowns. Over the month of July thus far, the Multi Asset Risk Targeted Strategy is up 1.30% versus 1.55% for the MSCI AC World Index and 0.53% for the Barclays Global Aggregate (USD hedged). Year-to-date, the Multi Asset Risk Targeted Strategy has returned 8.52% versus 18.03% for the MSCI AC World index, while the Barclays Global Aggregate (USD hedged) index is up 6.57%. * The Multi Asset Risk Targeted Strategy performance is shown in USD net of fees for the representative account of the Multi Asset Risk Targeted (Medium) USD Composite and reflects the deduction of advisory fees and brokerage commission and the reinvestment of all dividends and earnings. Past performance is not indicative of future performance. This information is presented as supplemental information only and complements the GIPS compliant presentation provided on the following page.Strategy Behaviour
Performance Review
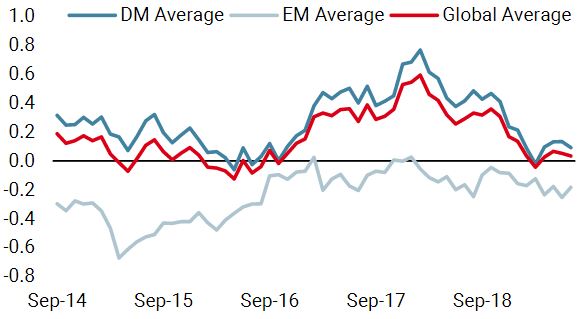
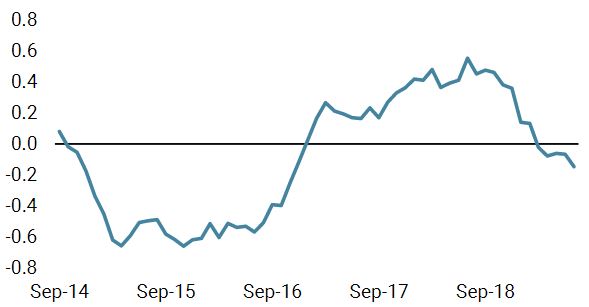
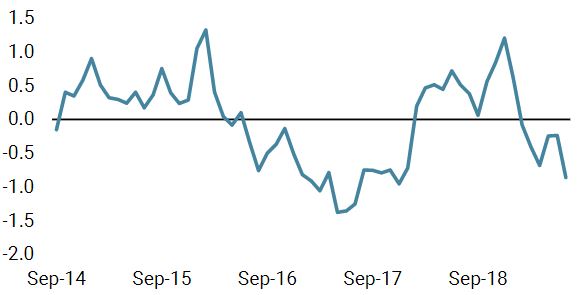
Unigestion Nowcasting
World Growth Nowcaster
World Inflation Nowcaster
Market Stress Nowcaster
Weekly Change
- Our world Growth Nowcaster remained unchanged this week, as the slight improvement in the US situation was offset by European and Japanese data.
- Our world Inflation Nowcaster decreased further this week, mainly driven by continued disinflationary prospects in the US.
- Market stress decreased this week, as credit spreads contracted.
Sources: Unigestion. Bloomberg, as of 29 July 2019.
Important Information Past performance is no guide to the future, the value of investments can fall as well as rise, there is no guarantee that your initial investment will be returned. This document has been prepared for your information only and must not be distributed, published, reproduced or disclosed by recipients to any other person. This is a promotional statement of our investment philosophy and services only in relation to the subject matter of this presentation. It constitutes neither investment advice nor recommendation. This document represents no offer, solicitation or suggestion of suitability to subscribe in the investment vehicles it refers to. Please contact your professional adviser/consultant before making an investment decision. Where possible we aim to disclose the material risks pertinent to this document, and as such these should be noted on the individual document pages. Please contact Unigestion for a complete list of all the applicable risks. Some of the investment strategies described or alluded to herein may be construed as high risk and not readily realisable investments, which may experience substantial and sudden losses including total loss of investment. These are not suitable for all types of investors. To the extent that this report contains statements about the future, such statements are forward-looking and subject to a number of risks and uncertainties, including, but not limited to, the impact of competitive products, market acceptance risks and other risks. As such, forward looking statements should not be relied upon for future returns. Data and graphical information herein are for information only and may have been derived from third party sources. Unigestion takes reasonable steps to verify, but does not guarantee, the accuracy and completeness of this information. As a result, no representation or warranty, expressed or implied, is or will be made by Unigestion in this respect and no responsibility or liability is or will be accepted. All information provided here is subject to change without notice. It should only be considered current as of the date of publication without regard to the date on which you may access the information. Rates of exchange may cause the value of investments to go up or down. An investment with Unigestion, like all investments, contains risks, including total loss for the investor. This information is issued by Unigestion (UK) Ltd (“Unigestion”), which is authorised and regulated by the UK Financial Conduct Authority (“FCA”). Unigestion is also registered as an investment adviser with the U.S. Securities and Exchange Commission (“SEC”). This information is intended only for professional clients, institutional clients and eligible counterparties, as defined by the FCA, and qualified purchasers as defined by the SEC and has therefore not been adapted to retail clients. Unigestion Multi Asset Risk-Targeted (USD): 31 December 2014 to 31 March 2019 1: This year is incomplete, it stops in March. Special Disclosure: For presentations prior to 31.03.2018 the strategy was measured against the LIBOR 3M USD + 4%. Beginning April 2018 the firm determined that the benchmark did not accurately reflect the strategy mandate and the benchmark was removed. Definition of the Firm: For the purposes of applying the GIPS Standards, the firm is defined as Unigestion. Unigestion is responsible for managing assets on the behalf of institutional investors. Unigestion invests in several strategies for institutional clients: Equities, Hedge Funds, Private Assets and the solutions designed for the clients of our Cross Asset Solution department. The GIPS firm definition excludes the Fixed Income Strategy Funds, which started in January 2001 and closed in April 2008, and the accounts managed for private clients. Unigestion defines the private clients as High Net Worth Families and Individual investors. Policies: Unigestion policies for valuing portfolios, calculating performance, and preparing compliant presentations are available upon request. Composite Description: The Multi Risk Targeted (Medium) composite was defined on 15 December 2014. It consists of accounts which aim to deliver consistent smooth returns of cash + 5% gross of fees across all market conditions over a 3-year rolling period. It seeks to achieve this by capturing the upside during bull markets while protecting capital during market downturns. Benchmark: Because the composites strategy is absolute return and investments are permitted in all asset classes, no benchmark can reflect this strategy accurately. Fees: Returns are presented gross of management fees, administrative fees but net of all trading costs and withholding taxes. The maximum management fee schedule is 1.2% per annum. Net returns are net of model fees and are derived by deducting the highest applicable fee rate in effect for the respective time period from the gross returns each month. List of Composites: A list of all composite descriptions is available upon request. Minimum Account Size: The minimum account size for this composite is 5’000’000.- USD. Valuation: Valuations are computed in US dollars (USD). Performance results are reported in US dollars (USD). Internal Dispersion & 3YR Standard Deviation: The annual composite dispersion presented is an asset-weighted standard deviation calculated for the accounts in the composite the entire year. When internal dispersion is not presented it is as a result of an insufficient number of portfolios in the composite for the entire year. When the 3 Year Standard Deviation is not presented it is as a result of an insufficient period of time. Compliance Statement Unigestion claims compliance with the Global Investment Performance Standards(GIPS®) and has prepared and presented this report in compliance with the GIPS standards. Unigestion has been independently verified for the periods 1 January 2003 to 31 December 2016. The verification report(s) is/are available upon request. Verification assesses whether (1) the firm has complied with all the composite construction requirements of the GIPS standards on a firm-wide basis and(2) the firms policies and procedures are designed to calculate and present performance in compliance with the GIPS standards. Verification does not ensure the accuracy of any specific composite presentation.
Year
Composite
Return Gross
of FeesComposite Net Return
Benchmark Return
Number of Accounts
Internal Dispersion
Composite 3-Yr Std Dev
Benchmark 3-Yr Std Dev
Composite AUM (M)
Firm
AUM (M)
2015
-1.61%
-2.80%
–
1
–
–
–
127.24
15,550.31
2016
5.05%
3.79%
–
1
–
–
–
129.66
18,144.46
2017
11.16%
9.82%
–
1
–
–
–
169.51
22,340.80
2018
-2.91%
-4.08%
–
1
–
–
–
286.93
21,403.49
20191
5.06%
4.74%
–
1
–
–
–
278.23
21’266.46