RISK-MANAGED EQUITY INVESTING: THE RIGHT APPROACH FOR TODAY’S MARKETS
In this paper, we analyse the recent performance of our risk-managed equity strategies and outline why we believe our approach makes sense for today’s equity market environment. We also discuss how we address Environmental, Social and Governance (ESG) issues, which are becoming more relevant and are likely to have a greater impact on portfolio returns in the future.
Putting Recent Performance Into Context
2017: Markets can aim for the sky …
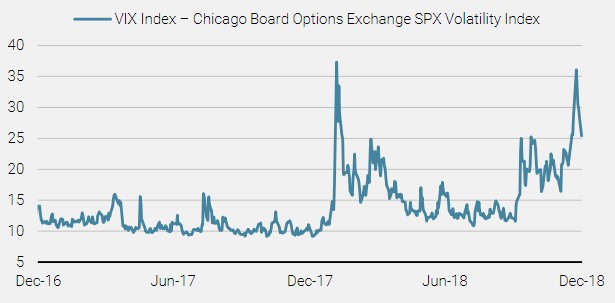
In 2017, equity markets benefited from a very strong bullish momentum, led by mega-cap names, particularly in the technology sector. In the US, it was the so-called FAAMG stocks (Facebook, Amazon, Apple, Microsoft and Alphabet’s Google), while in emerging markets it was the likes of Alibaba, Tencent and TSMC. The market was characterised by very low volatility, as shown in Figure 1, and few investors worried about risks or focused on how to protect their portfolios against drawdowns.
Figure 1 Volatility Was Not an Issue in 2017, But Came to the Fore in 2018
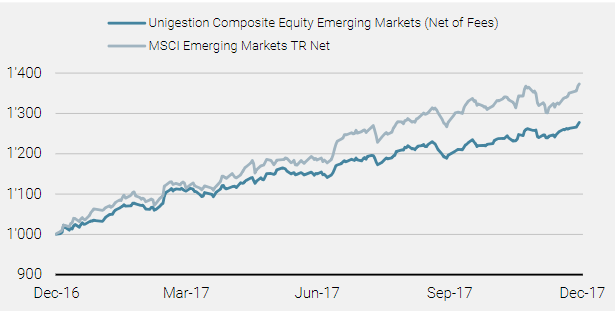
This bullish and more concentrated thematic rally presented a challenging environment for some of our risk-managed equity strategies, which are more diversified and defensive in nature. As an example, our risk-managed Emerging Markets equity strategy posted a solid absolute return in 2017 of around 28% net of fees. However, it lagged its benchmark, the MSCI Emerging Markets Index (Net TR), which was up over 37%. Despite underperforming, the strategy still posted a solid 75% upside participation in a strong bull and thematically driven market – see Figure 2.
Figure 2 Performance of the Unigestion Equity Emerging Markets Strategy in 2017
| As of 31.12.2017 | Unigestion Composite Equity Emerging Markets (Net of Fees) | MSCI Emerging Markets Index TR Net |
| Performance over period | 28.1% | 37.3% |
| Volatility over period | 7.5% | 10.6% |
2018: … until they get caught up by the laws of gravity
2018 was a very different story, with market corrections across all major regions and a rise in volatility bringing risk management back into focus. Emerging markets were the first to correct, continuing their strong bull trend until late January before heading south. Concerns stemmed around inflation and tightening monetary policy, driven by stronger-than-expected US payroll numbers. The emerging market equity environment remained challenging for the rest of the year, with headwinds from the ongoing trade wars and a slowing Chinese economy. Although some of the other regional equity markets managed to resist these headwind pressures initially, ultimately they too succumbed and corrected in Q4.
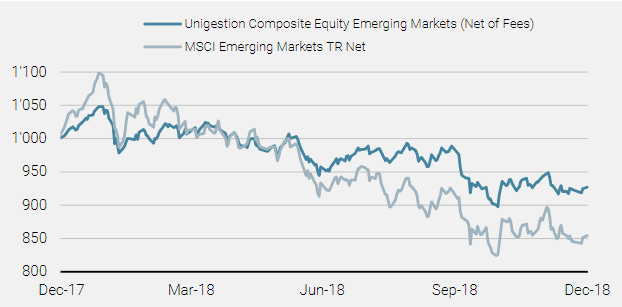
In this more volatile and challenging environment, our risk-managed equity strategies proved to be very resilient. Looking at our Emerging Markets strategy again, it ended the year down 7.3% net of fees, against a benchmark return of -14.6%. That’s a participation rate of only 50% in a down-trending market – see Figure 3.

In this more volatile and challenging environment, our risk – managed equity strategies proved to be very resilient.

Figure 3 Performance of the Unigestion Equity Emerging Markets Strategy in 2018
| As of 31.12.2018 | Unigestion Composite Equity Emerging Markets (Net of Fees) | MSCI Emerging Markets Index TR Net |
| Performance over period | -7.3% | -14.6% |
| Volatility over period | 11.3% | 17.8% |
Looking at 2017 and 2018 together, it is this type of return asymmetry that allows us to provide a more consistent, smoother return path for our investors, and deliver on our long-term objective of 3% outperformance per annum against the benchmark over a full market cycle.
Our Emerging Markets equity strategy is not the only one to have performed strongly over 2018, with most of our regional equity risk-managed strategies delivering attractive downside resilience over this more turbulent period – see performance table on page 8.
What Were The Key Risk Drivers in 2018?
One of the key risks that we have been concerned with for a number of years is that of inflationary pressures and subsequent rising interest rates, particularly in the US. Many defensive stocks, such as those found in the utilities or telecoms sectors, can almost be thought of as bond proxies and are therefore more sensitive to interest rate increases. In order to not be overly impacted as rate increases materialised, we controlled our exposure to such stocks across our portfolios.
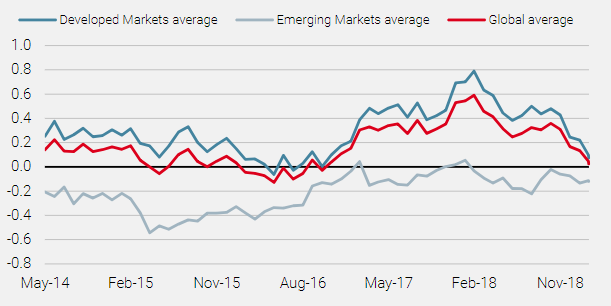
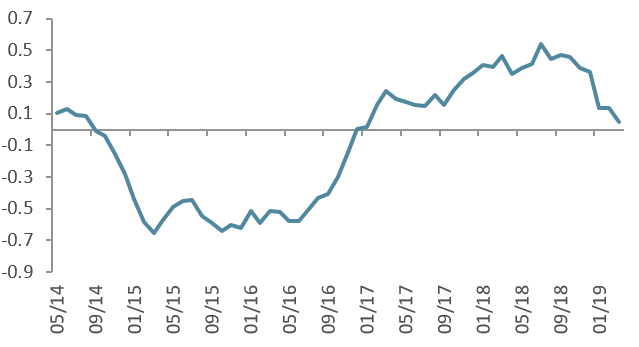
Through 2018, in light of the higher level of rates and the slowing economic conditions ahead, we decided to remove this restriction on interest rate sensitive stocks. As such, our focus shifted from concerns over inflationary shocks at the start of 2018 to recessionary ones at the start of 2019. This is highlighted by our proprietary Nowcaster charts, which illustrate a turnaround in the World Inflation Nowcaster half way through 2018, and a persistent decline in the Growth Nowcaster for developed economies.
Our focus shifted from concerns over inflationary shocks at the start of 2018 to recessionary ones at the start of 2019.
Figure 4 World Growth and Inflation Nowcasters
World Growth Nowcaster
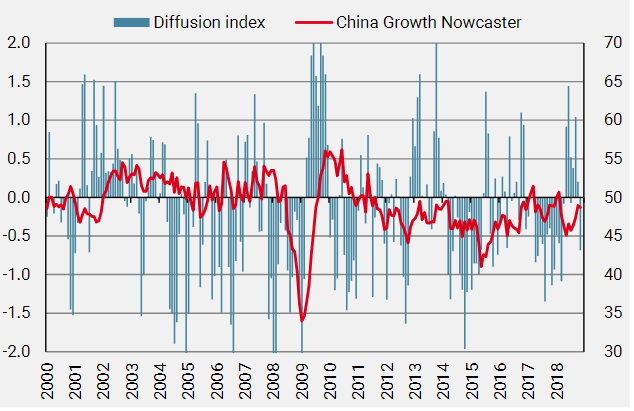
The Growth Nowcaster index is a real-time synthetic measure of economic growth. It is computed as a proprietary normalised average of a broad spectrum of indicators spanning the different domains of the economy (production, consumption, employment, investment). The Growth Nowcaster takes positive or negative values. A reading above (resp. below) 0 of the Growth Nowcaster expresses that the economy is growing at a higher (resp. lower) pace than the “normal” growth (also called potential growth). Based on the same set of indicators, the Diffusion index is computed as the proportion of increasing macroeconomic indicators, hence giving indication of the broadness of the economic expansion. The Diffusion index varies from 0 (all indicators are decreasing) to 100% (all indicators are increasing). Local indices are weighted into aggregated measures using an in-house weighting scheme that combines Gross Domestic Product weights and equity markets betas
World Inflation Nowcaster
Another key concern we had at the start of the 2018 was the valuation of equity markets, with most regions looking very expensive. We therefore monitored valuation very carefully within our risk-managed portfolios, ensuring that we tilted them away from overly expensive stocks and making sure that the overall portfolios were not more expensive than the relevant benchmarks. By the end of the year, with some regions such as the emerging markets de-rating significantly, we were able to relax our restriction on valuation. However, despite the correction, some pockets still look expensive, such as the US equity market, particularly after the rebound in the first couple of months of 2019.
We monitored valuation very carefully within our risk – managed portfolios, ensuring that we were not more expensive than the relevant benchmarks.
Market Conditions Remain Challenging
Our Macro Committee views the rest of 2019 with caution, with a number of headwinds facing the global economy.
Any slowdown in China can have a significant impact on global growth.
On the one hand, we have the threat of a slowing Chinese economy, put under further pressure by the ongoing trade war and a crushing level of debt. Any slowdown in China can have a significant impact on global growth – as the saying goes, “when China sneezes, the rest of the world catches a cold”. Although housing in China is stable for the time being, there is a deteriorating trend in consumption, production expectations and external demand. Our Chinese Growth Nowcaster points to a deceleration. To alleviate these risks, the government has stepped in with measures to stimulate the economy. These measures include the relaxation of the reserve requirement ratio for banks in order to ease lending conditions, tax cuts, infrastructure investments and monetary policy adjustments. China needs to balance its stimulus carefully to ensure it does not further deepen its debt burden and allow it to spiral out of control, and to also ensure it maintains stability of the yuan.
Figure 5 Chinese Growth Nowcaster
Within our portfolios, we are underweight China, given its less attractive risk profile. We are also underweight some of the more cyclical industries, such as capital goods, as they are more exposed to the negative impacts of trade wars and a slowing Chinese economy.
Within our portfolios we are underweight China as well as in more cyclical industries.
On the other hand, we have political uncertainty generated by Brexit, uncertain political momentum in Italy, unrest in France and an erratic US government. Our portfolios are underweight the UK given the lack of visibility as to the outcome of the Brexit negotiations.
In addition, the current growth cycle in the US has had a very long duration and it may be running out of steam. Although we do not see an imminent threat of recession in 2019, the outlook does appear a little choppy. The housing market in the US is slowing, reflecting the impact of higher mortgage rates and tighter lending conditions. US company earnings are also starting to show signs of a tapering in momentum. While 2019 earnings estimates have been reduced, they still need to come down further to reflect higher costs for corporates, with rising wage pressures continuing to build. We have shifted our focus from concerns around interest rate impacts to concerns around recessionary conditions, ensuring our portfolios are more defensively aligned, in more stable industries such as telecommunication and utilities.
In addition to the macro economic environment, investors need also to be aware of the changing dynamics in the market and the emerging themes and risks that are likely to have an impact going forward.
A Growing Focus on ESG
One such consideration is ESG, or Environmental, Social and Governance issues, which are becoming more and more relevant. With an increased focus from investors and the public, as well as more regulatory pressures and company and investor reporting requirements, ESG considerations are likely to have a greater impact on portfolios in the future.
ESG considerations are likely to have more impact on portfolios in the future.
Governance, or the G in ESG, has typically been considered by most investors in their search for quality companies with solid governance frameworks, independent boards, sound policies and so on. Companies have understood this and hence directed time and resources toward these criteria to ensure they meet investor expectations and evolving stewardship codes.
However, now the E (Environmental) and the S (Social) are becoming equally relevant. Issues such as climate risk, water usage, pollution or waste management are the typical E themes, while on the S side of things, the spotlight is on human rights and labour conditions, both in company operations and their supply chains.
At Unigestion, we integrate ESG criteria into our equity strategies at various stages of the investment process. We look at how companies are exposed to various key ESG risks and themes and how they manage those risks, adjusting our portfolios as necessary. In addition to internal qualitative research, we also use external ESG research to validate our equity portfolios on an ongoing basis.
At Unigestion, we integrate ESG criteria into our equity strategies at various stages of the investment process.
To provide two examples from 2018, we can zoom into some stocks we excluded from our portfolios on the basis of governance concerns. One such case is Danske Bank, where a less favourable fundamental outlook and growing concerns around the company’s involvement in money laundering activities in Estonia led us to sell our holdings from all of our portfolios in January 2018. Since then, further evidence has emerged against the company, and the launch of a US criminal inquiry into the breaching of US sanctions has resulted in a number of ongoing investigations against the company. Since 2007, the company is suspected of having laundered approximately USD 225 billion. The stock significantly derated through 2018, losing half of its value on the back of the threat of a heavy fine from the US Department of Justice. This provides a good example of the added value that our focus on governance and ESG risk controls can bring to our portfolios.
However, not all decisions on ESG are necessarily positive contributors to performance. As an example, in 2018 we sold our holding in PKN Orlen SA, Poland’s biggest fuel refiner, again based on governance concerns. On 5 February 2018, following a meeting of the company’s Supervisory Board, it was announced that three senior members of the company’s management board were being dismissed with immediate effect, including the CEO, Deputy CEO and CIO. At the same time, the board announced the appointment of Daniel Obajtek to the post of President of the Management Board. The news was a surprise and it indicated the company’s potential move into nuclear power generation. It also raised concerns over the company being used to subsidise a nuclear power plant project. More critically, the news put into question the independence of such state controlled companies from government intervention. In addition, there were claims that the new CEO may have embezzled funds when he worked at window producer Elektropast. Orlen have defended their choice of CEO, noting that prosecutors had discontinued their investigations into the embezzlement of funds and there have been no binding court rulings against Daniel Obajtek in the matter.
In light of these developments, we reviewed our holding in the stock and decided to sell, given our growing concerns over the governance of the company and the likelihood that the government’s influence over the company could continue to grow. This would lead to governance driven more by government (populist) interests rather than those of minority shareholders. Our decision to divest highlights the importance of maintaining a broad view of ESG risk. Despite all this, the stock outperformed the MSCI Emerging Markets index over 2018. However, we continue to maintain our restriction given the company’s unattractive risk profile.
Conclusion
In our opinion, the investment landscape going forward will be characterised by continued bouts of volatility and calls for a more cautious investment approach. Thanks to continued weakness in the global economy, the risk/reward of pro-growth assets has been significantly reduced and selectivity will be key. In such an environment, asset allocation will be challenging and require dynamic risk management. Against such a backdrop, our risk-managed approach to equity investing can deliver a number of benefits for investors:
The investment landscape going forward will be characterised by continued bouts of volatility and calls for a more cautious investment approach
- A risk focus: focusing on risk rather than expected returns enables us to capitalise on downside protection in difficult markets to generate long-term outperformance
- Discretionary portfolio assessment: focusing on valuation, fundamental risk control, corporate governance and any qualitative risks associated with potential portfolio stocks
- Avoidance of behavioural biases: our investment process objectively favours lower-volatility and uncorrelated stocks, while avoiding overvalued success stories
- Performance asymmetry: by concentrating risk reduction on unrewarded risks, we reduce the negative tail of return distribution while creating a positive skew
- Downside protection: we focus on reducing the risk of loss and ensuring optimal diversification by using a range of different risk models and through discretionary scrutiny of candidate stocks
Unigestion’s Risk-Managed Equity Strategies
Our core risk-managed equity strategy is available across a number of geographic regions/markets:
- Global
- Europe
- Emerging markets
- US
- Japan
- Switzerland
- Pacific
The objective of these long-only strategies is to outperform the respective benchmark over a full market cycle by 3% per annum, while reducing volatility by 30%. Given our focus on reducing the risk of absolute losses independently of tracking error, our equity strategies can be used to gain standalone equity exposures or as building blocks that can complement an investor’s existing portfolio. They are ideally suited to investors dealing with liability management, risk-budget, capital preservation or absolute return objectives.
Performance of the Unigestion Risk-Managed Equity Strategies
| 12-month performance | 5-year performance (p.a.) | ||||
| As of 31.12.2018 | Strategy | Benchmark | Strategy | Benchmark | |
| Unigestion Composite Equity Global All Country (USD) | -10.1% | -9.4% | 4.1% | 4.3% | |
| Unigestion Composite Equity Europe (EUR) | -6.7% | -10.6% | 5.0% | 3.4% | |
| Unigestion Composite Equity Emerging Markets (USD) | -7.3% | -14.6% | 0.9% | 1.7% | |
| Unigestion Composite Equity US (USD) | -4.7% | -5.1% | 6.3% | 7.7% | |
| Unigestion Composite Equity Japan (JPY) | -15.1% | -15.2% | 6.2% | 4.0% | |
Source: Unigestion, Bloomberg. Data as at 31.12.2018.
Performance is expressed net of fees. Past performance is not an indication of future performance. The returns cannot be guaranteed and there is a possibility that you will not get back your initial investment.
Appendix
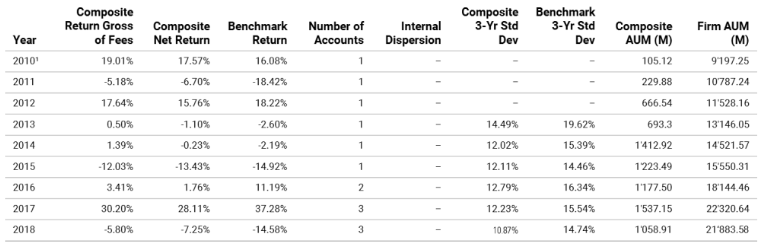
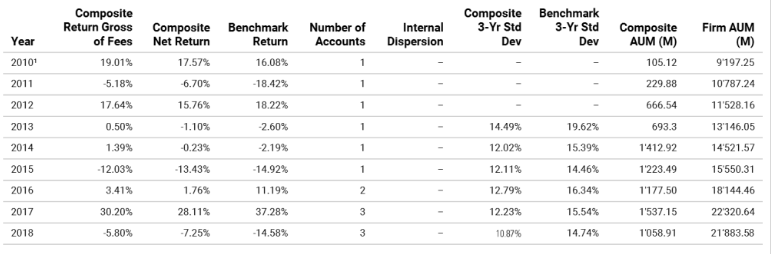
Unigestion – Equity Global All Country (USD)
31 January 2008 to 31 December 2018
1: This year is incomplete, it starts in January.
Compliance Statement: Unigestion claims compliance with the Global Investment Performance Standards (GIPS®) and has prepared and presented this report in compliance with the GIPS standards. Unigestion has been independently verified for the periods 1 January 2003 to 31 December 2016. The verification report(s) is/are available upon request. Verification assesses whether (1) the firm has complied with all the composite construction requirements of the GIPS standards on a firm-wide basis and (2) the firms policies and procedures are designed to calculate and present performance in compliance with the GIPS standards. Verification does not ensure the accuracy of any specific composite presentation. Definition of the Firm: For the purposes of applying the GIPS Standards, the firm is defined as Unigestion. Unigestion is responsible for managing assets on the behalf of institutional investors. Unigestion invests in several strategies for institutional clients: Equities, Hedge Funds, Private Assets and the solutions designed for the clients of our Cross Asset Solution department. The GIPS firm definition excludes the Fixed Income Strategy Funds, which started in January 2001 and closed in April 2008, and the accounts managed for private clients. Unigestion defines the private clients as High Net Worth Families and Individual investors. Policies: Unigestion policies for valuing portfolios, calculating performance, and preparing compliant presentations are available upon request. Composite Description: The Equity Global All Country composite was defined on 13 September 2013. The Equity Global All Country composite consists of accounts invested in the Global All Country universe and whose objective is to profit from opportunities offered by this equity market. Portfolios are invested according to an active approach based on risk management, combining both fundamental and quantitative analysis. Benchmark: The benchmark is the MSCI AC World TR Net USD, which is designed to measure the equity market performance of world countries. Benchmark returns are net of withholding taxes. Fees: Returns are presented gross of management fees, administrative fees but net of all trading costs and withholding taxes. The maximum management fee schedule is 1.6% per annum. Net returns are net of model fees and are derived by deducting the highest applicable fee rate in effect for the respective time period from the gross returns each month. List of Composites: A list of all composite descriptions is available upon request. Minimum Account Size: The minimum account size for this composite is 5’000’000.- USD. Valuation: Valuations are computed in USD. Performance results are reported in USD. Internal Dispersion & 3YR Standard Deviation: The annual composite dispersion presented is an asset-weighted standard deviation calculated for the accounts in the composite the entire year. When internal dispersion is not presented it is as a result of an insufficient number of portfolios in the composite for the entire year. When the 3 Year Standard Deviation is not presented it is as a result of an insufficient period of time.
Unigestion – Equity Europe (EUR)
31 December 2002 to 31 December 2018
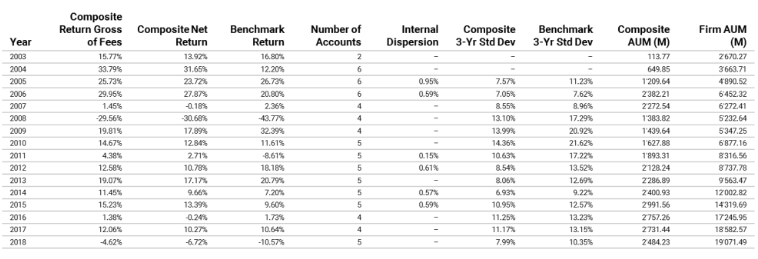
Special Disclosure: In April 2018 we retroactively changed the benchmark of the composite from the STOXX Europe 600 TR NET Index to the MSCI Europe TR Net EUR Index because it is more representative of the composites investment strategy. There has been no change to the way that composite portfolios are managed. Compliance Statement: Unigestion claims compliance with the Global Investment Performance Standards (GIPS®) and has prepared and presented this report in compliance with the GIPS standards. Unigestion has been independently verified for the periods 1 January 2003 to 31 December 2016. The verification report(s) is/are available upon request. Verification assesses whether (1) the firm has complied with all the composite construction requirements of the GIPS standards on a firm-wide basis and (2) the firms policies and procedures are designed to calculate and present performance in compliance with the GIPS standards. Verification does not ensure the accuracy of any specific composite presentation. Definition of the Firm: For the purposes of applying the GIPS Standards, the firm is defined as Unigestion. Unigestion is responsible for managing assets on the behalf of institutional investors. Unigestion invests in several strategies for institutional clients: Equities, Hedge Funds, Private Assets and the solutions designed for the clients of our Cross Asset Solution department. The GIPS firm definition excludes the Fixed Income Strategy Funds, which started in January 2001 and closed in April 2008, and the accounts managed for private clients. Unigestion defines the private clients as High Net Worth Families and Individual investors. Policies: Unigestion policies for valuing portfolios, calculating performance, and preparing compliant presentations are available upon request. Composite Description: The Equity Europe composite was defined on 13 September 2013. The Equity Europe composite consists of accounts invested in the European universe (account without any additional specific constraint) and whose objective is to profit from opportunities offered by this equity market. Portfolios are invested according to an active approach based on risk management, combining both fundamental and quantitative analysis. Benchmark: The benchmark is the MSCI Europe TR Net EUR Index, which is designed to measure the equity market performance of the Europe. Benchmark returns are net of withholding taxes. Fees: Returns are presented gross of management fees, administrative fees but net of all trading costs and withholding taxes. The maximum management fee schedule is 1.6% per annum. Net returns are net of model fees and are derived by deducting the highest applicable fee rate in effect for the respective time period from the gross returns each month. List of Composites: A list of all composite descriptions is available upon request. Minimum Account Size: The minimum account size for this composite is 5’000’000.- EUR. Valuation: Valuations are computed in Euro (EUR). Performance results are reported in Euro (EUR).Internal Dispersion & 3YR Standard Deviation: The annual composite dispersion presented is an asset-weighted standard deviation calculated for the accounts in the composite the entire year. When internal dispersion is not presented it is as a result of an insufficient number of portfolios in the composite for the entire year. When the 3 Year Standard Deviation is not presented it is as a result of an insufficient period of time.
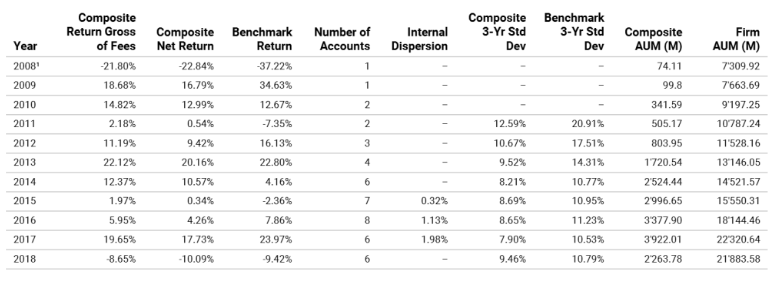
Unigestion – Equity Emerging Markets (USD)
31 March 2010 to 31 December 2018
1: This year is incomplete, it starts in March.
Compliance Statement: Unigestion claims compliance with the Global Investment Performance Standards (GIPS®) and has prepared and presented this report in compliance with the GIPS standards. Unigestion has been independently verified for the periods 1 January 2003 to 31 December 2016. The verification report(s) is/are available upon request. Verification assesses whether (1) the firm has complied with all the composite construction requirements of the GIPS standards on a firm-wide basis and (2) the firms policies and procedures are designed to calculate and present performance in compliance with the GIPS standards. Verification does not ensure the accuracy of any specific composite presentation.Definition of the Firm: For the purposes of applying the GIPS Standards, the firm is defined as Unigestion. Unigestion is responsible for managing assets on the behalf of institutional investors. Unigestion invests in several strategies for institutional clients: Equities, Hedge Funds, Private Assets and the solutions designed for the clients of our Cross Asset Solution department. The GIPS firm definition excludes the Fixed Income Strategy Funds, which started in January 2001 and closed in April 2008, and the accounts managed for private clients. Unigestion defines the private clients as High Net Worth Families and Individual investors.Policies: Unigestion policies for valuing portfolios, calculating performance, and preparing compliant presentations are available upon request.Composite Description: The Equity Emerging Markets composite was defined on 13 September 2013. The Equity Emerging Markets composite consists of accounts invested in the Global Emerging Markets universe and whose objective is to profit from opportunities offered by this equity market. Portfolios are invested according to an active approach based on risk management, combining both fundamental and quantitative analysis.Benchmark: The benchmark is the MSCI Emerging Markets TR Net USD, which is designed to measure the equity market performance of emerging countries. Benchmark returns are net of withholding taxes.Fees: Returns are presented gross of management fees, administrative fees but net of all trading costs and withholding taxes. The maximum management fee schedule is 1.6% per annum. Net returns are net of model fees and are derived by deducting the highest applicable fee rate in effect for the respective time period from the gross returns each month.List of Composites: A list of all composite descriptions is available upon request.Minimum Account Size: The minimum account size for this composite is 5’000’000.- USD.Valuation: Valuations are computed in USD. Performance results are reported in USD.Internal Dispersion & 3YR Standard Deviation: The annual composite dispersion presented is an asset-weighted standard deviation calculated for the accounts in the composite the entire year. When internal dispersion is not presented it is as a result of an insufficient number of portfolios in the composite for the entire year. When the 3 Year Standard Deviation is not presented it is as a result of an insufficient period of time.
Unigestion – Equity US (USD)
31 Janauary 2008 to 31 December 2018
1: This year is incomplete, it starts in January.
Special Disclosure: In December 2016 we retroactively changed the benchmark of the composite from the S&P 500 TR Net USD Index to the MSCI USA Daily TR Net Index because it is more representative of the composites investment strategy. There has been no change to the way that composite portfolios are managed. Compliance Statement: Unigestion claims compliance with the Global Investment Performance Standards (GIPS®) and has prepared and presented this report in compliance with the GIPS standards. Unigestion has been independently verified for the periods 1 January 2003 to 31 December 2016. The verification report(s) is/are available upon request. Verification assesses whether (1) the firm has complied with all the composite construction requirements of the GIPS standards on a firm-wide basis and (2) the firms policies and procedures are designed to calculate and present performance in compliance with the GIPS standards. Verification does not ensure the accuracy of any specific composite presentation. Definition of the Firm: For the purposes of applying the GIPS Standards, the firm is defined as Unigestion. Unigestion is responsible for managing assets on the behalf of institutional investors. Unigestion invests in several strategies for institutional clients: Equities, Hedge Funds, Private Assets and the solutions designed for the clients of our Cross Asset Solution department. The GIPS firm definition excludes the Fixed Income Strategy Funds, which started in January 2001 and closed in April 2008, and the accounts managed for private clients. Unigestion defines the private clients as High Net Worth Families and Individual investors.Policies: Unigestion policies for valuing portfolios, calculating performance, and preparing compliant presentations are available upon request. Composite Description: The Equity US composite was defined on 13 September 2013. The Equity US composite consists of accounts invested in the US universe and whose objective is to profit from opportunities offered by this equity market. Portfolios are invested according to an active approach based on risk management, combining both fundamental and quantitative analysis. Benchmark: The benchmark is the MSCI USA Daily TR Net Index, which is designed to measure the equity market performance of the US. Benchmark returns are net of withholding taxes. Fees: Returns are presented gross of management fees, administrative fees but net of all trading costs and withholding taxes. The maximum management fee schedule is 1.6% per annum. Net returns are net of model fees and are derived by deducting the highest applicable fee rate in effect for the respective time period from the gross returns each month. List of Composites: A list of all composite descriptions is available upon request. Minimum Account Size: The minimum account size for this composite is 5’000’000.- USD. Valuation: Valuations are computed in USD. Performance results are reported in USD. Internal Dispersion & 3YR Standard Deviation: The annual composite dispersion presented is an asset-weighted standard deviation calculated for the accounts in the composite the entire year. When internal dispersion is not presented it is as a result of an insufficient number of portfolios in the composite for the entire year. When the 3 Year Standard Deviation is not presented it is as a result of an insufficient period of time.
Unigestion – Equity Japan (JPY)
31 March 2006 to 31 December 2018
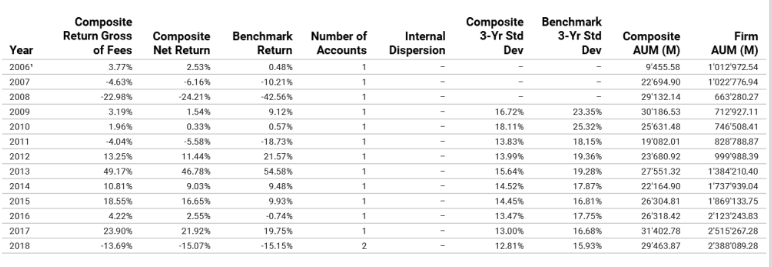
1: This year is incomplete, it starts in March.
Compliance Statement: Unigestion claims compliance with the Global Investment Performance Standards (GIPS®) and has prepared and presented this report in compliance with the GIPS standards. Unigestion has been independently verified for the periods 1 January 2003 to 31 December 2016. The verification report(s) is/are available upon request. Verification assesses whether (1) the firm has complied with all the composite construction requirements of the GIPS standards on a firm-wide basis and (2) the firms policies and procedures are designed to calculate and present performance in compliance with the GIPS standards. Verification does not ensure the accuracy of any specific composite presentation. Definition of the Firm: For the purposes of applying the GIPS Standards, the firm is defined as Unigestion. Unigestion is responsible for managing assets on the behalf of institutional investors. Unigestion invests in several strategies for institutional clients: Equities, Hedge Funds, Private Assets and the solutions designed for the clients of our Cross Asset Solution department. The GIPS firm definition excludes the Fixed Income Strategy Funds, which started in January 2001 and closed in April 2008, and the accounts managed for private clients. Unigestion defines the private clients as High Net Worth Families and Individual investors. Policies: Unigestion policies for valuing portfolios, calculating performance, and preparing compliant presentations are available upon request. Composite Description: The Equity Japan composite was defined on 13 September 2013. The Equity Japan composite consists of accounts invested in the Japanese universe and whose objective is to profit from opportunities offered by this equity market. Portfolios are invested according to an active approach based on risk management, combining both fundamental and quantitative analysis. Benchmark: The benchmark is the MSCI Japan TR Net which is designed to measure the equity market performance of Japan Benchmark returns are net of withholding taxes. Fees: Returns are presented gross of management fees, administrative fees but net of all trading costs and withholding taxes. The maximum management fee schedule is 1.6% per annum. Net returns are net of model fees and are derived by deducting the highest applicable fee rate in effect for the respective time period from the gross returns each month. List of Composites: A list of all composite descriptions is available upon request. Minimum Account Size: The minimum account size for this composite is 500’000’000.- JPY. Valuation: Valuations are computed in Japanese Yen (JPY). Performance results are reported in Japanese Yen (JPY).Internal Dispersion & 3YR Standard Deviation: The annual composite dispersion presented is an asset-weighted standard deviation calculated for the accounts in the composite the entire year. When internal dispersion is not presented it is as a result of an insufficient number of portfolios in the composite for the entire year. When the 3 Year Standard Deviation is not presented it is as a result of an insufficient period of time.
Important Information
The information and data presented in this page may discuss general market activity or industry trends but is not intended to be relied upon as a forecast, research or investment advice. It is not a financial promotion and represents no offer, solicitation or recommendation of any kind, to invest in the strategies or in the investment vehicles it refers to. Some of the investment strategies described or alluded to herein may be construed as high risk and not readily realisable investments, which may experience substantial and sudden losses including total loss of investment.
The investment views, economic and market opinions or analysis expressed in this page present Unigestion’s judgement as at the date of publication without regard to the date on which you may access the information. There is no guarantee that these views and opinions expressed will be correct nor do they purport to be a complete description of the securities, markets and developments referred to in it. All information provided here is subject to change without notice. To the extent that this page contains statements about the future, such statements are forward-looking and subject to a number of risks and uncertainties, including, but not limited to, the impact of competitive products, market acceptance risks and other risks.
Data and graphical information herein are for information only and may have been derived from third party sources. Although we believe that the information obtained from public and third party sources to be reliable, we have not independently verified it and we therefore cannot guarantee its accuracy or completeness. As a result, no representation or warranty, expressed or implied, is or will be made by Unigestion in this respect and no responsibility or liability is or will be accepted. Unless otherwise stated, source is Unigestion.
Past performance is not a guide to future performance. All investments contain risks, including total loss for the investor.