As we have communicated recently, we believe the stimulation provided by central banks and, to an extent, governments has helped to partially offset the current, sharp economic contraction and stabilise financial markets. While the level of macroeconomic data and investor sentiment remains negative, they are no longer deteriorating. At the same time, valuation opportunities have opened up across assets, although care must be taken given the unprecedented nature of this shock. Uncertainty remains high as re-opening economies contend with the likelihood of a second wave of COVID-19 and we do not think that now is the time to re-risk wholesale. Instead, we are focusing on selectivity and discrimination, especially within growth-oriented assets. Among our key dynamic views is a preference for “quality growth” equities, as we believe these firms are well suited to weather the current storm.Selectivity Is Key as Uncertainty Persists

Quality Control

Let us not mince words: the global economy is experiencing an unprecedented shock and a resolution remains uncertain. With another 3m new people in the US filing for unemployment and nearly 23m still without work, it is difficult to say we are out of the woods. However, the dynamic matters as much as the level for financial markets, and it is painting a rosier picture: In our view, now is not the time for a significant re-risking of assets across portfolios. Market volatilities remain elevated and there are too many unknowns about the pace, extent, and breadth of the economic recovery. However, given the stabilisation of financial markets, we do believe now is an opportune time to take on risk selectively. Put another way, it is the time for alpha, not beta. One of our key views over the near term is a preference for “quality growth” equities. For us, quality stocks are those that have both strong income statements and balance sheets. Hence, among the factors we consider are firms’ earnings and sales growth, their profit margins and free cash flow, as well as their leverage ratios and return on equity (ROE). Given the massive uncertainty around the crisis, we believe these quality companies should have a strong enough cushion both on the earnings and funding side to ride through the current storm and emerge on the other side ready to benefit strongly from the recovery. In the case of the US, this translates into a preference for the Nasdaq 100 index over the S&P 500. In addition to possessing superior sales growth, the firms in the Nasdaq have seen profit margins average nearly 1.5x those of the S&P 500 over the last five years. They also maintained their superior margins during the depths of the GFC, which has helped them to retain earnings growth well above that of the S&P 500 (12% vs 7% average over last five years and -5% vs -24% on average from October 2008 to December 2009). Free cash flow on a per–share basis is also much stronger for the Nasdaq, though it comes at a price: free cash flow yields are similar for both indices. However, the balance sheets reveal a massive divide: the aggregate net debt–to–EBITDA ratio of the Nasdaq is nearly a tenth of that for the S&P 500 (0.17 vs 1.59). All of this translates into an average ROE of nearly 21% for the Nasdaq versus 14% for the S&P 500 over the last five years (and estimated to be 27% vs 18% over the next twelve months). To be clear, our view is not just a preference for technology stocks: in Europe, we like the Swiss Market Index (SMI) over the Euro Stoxx 50. While sales growth has been higher for Euro Stoxx 50 firms over the last five years, the margins for SMI firms is much better in aggregate (9.5% versus 6.5% average over last five years), including during the GFC and Eurozone sovereign debt crisis. Even when the SNB let the Swiss franc appreciate at the end of 2014, margins remained superior to those of the Euro Stoxx 50, even if they did come down from their elevated levels. This has helped firms in the SMI keep profit growth in line with Euro Stoxx 50 firms (and surpass them over the last year). Free cash flow on a per–share basis is far higher for the SMI but, like the Nasdaq, comes at a cost as free cash flow yields are similar. In terms of leverage, the net debt–to–EBITDA ratio for the SMI is a third that of the Euro Stoxx 50 (2.0 vs 5.4). ROE over the last five years has averaged 11% for the SMI vs 9% for Euro Stoxx 50, while estimates put the next twelve months ROE at 13% for SMI and 9% for Euro Stoxx 50. Our preference for these exposures is not without risk (otherwise, everyone would do the same). Firstly, valuation is clearly a risk: the 12-month forward price-to-earnings (P/E) ratio for the Nasdaq is 25.0 vs 20.4 for the S&P 500. Even considering the fact that the Nasdaq typically has a higher valuation than the S&P 500 doesn’t change the picture: relative to their own histories, the current Nasdaq P/E is at its 95th percentile vs the 90th percentile for the S&P 500. The SMI’s P/E currently stands at 16.4, above the 14.6 for the Euro Stoxx 50, though the picture is better relative to their histories (SMI is at its 87th percentile while the Euro Stoxx 50 is at its 96th). Moreover, there is the risk of crowded positioning, as both the Nasdaq and SMI have outperformed against the S&P 500 and Euro Stoxx 50 on many horizons: 5y, 3y, 1y, YTD, 2020 pre-coronavirus (Jan 2020 – 19 Feb 2020), coronavirus crisis (20 Feb 2020 – 23 Mar 2020), and post–coronavirus crisis (24 Mar 2020 – 15 May 2020). Interestingly, our measures of speculator net positioning in the Nasdaq vs the S&P 500 is more positive, as they seem to be less exposed to the Nasdaq than to the S&P 500 than they have been recently. There are also idiosyncratic risks that we are exposed to and hence are carefully monitoring: Finally, it is worth noting the secular trends that continue to benefit these firms disproportionally, including the digitalisation of many sectors of the economy, the emergence of winner-takes-all dynamics in industries, and the increasing health care needs of a large, aging population. These trends provide further tailwinds that should bolster the firms in the Nasdaq and SMI above others. Our overall stance is one of neutrality: the macro situation is bad globally, and while we see a slowly improving picture, it is too early to be heavily exposed to risky assets. Investor sentiment remains negative, and so if conditions continue to improve, a swing in sentiment could add fuel to risk asset prices. In the meantime, valuations remain uneven across assets, suggesting upside in some cases (equities) and downside in others (real assets). In this context, we think selectivity and discrimination have a critical role to play in asset allocation.What’s Next?
Levels and changes
Where to put on risk: “quality growth” stocks
The numbers speak for themselves
Risks to these exposures are manageable in our view
Staying neutral overall but on the hunt for opportunities
Unigestion Nowcasting
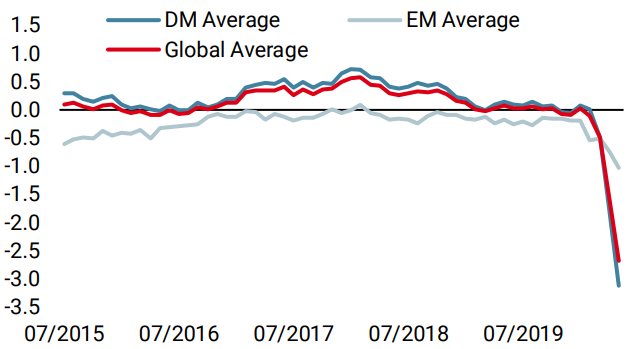
World Growth Nowcaster
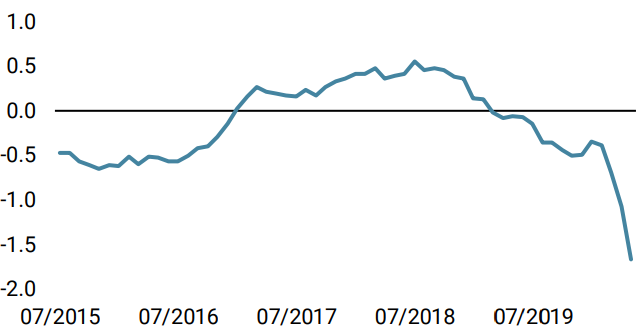
World Inflation Nowcaster
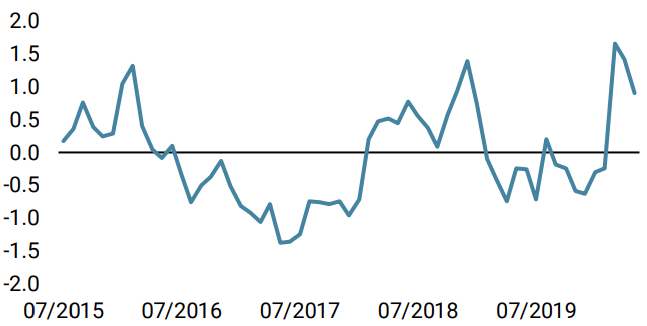
Market Stress Nowcaster
Weekly Change
- Our world Growth Nowcaster decreased again last week, across EM and DM economies alike. Its diffusion index has now stabilised around 20%. Our world indicator has now reached a value of –2.64 standard deviations, indicative of a very high risk of recession.
- Our world Inflation Nowcaster also fell across all countries we monitor. This decline is consistent with dire growth conditions.
- Our Market Stress Nowcaster remained stable last week: spreads marginally widened as liquidity metrics improved.
Sources: Unigestion. Bloomberg, as of 18 May 2020.
Important Information
This document is provided to you on a confidential basis and must not be distributed, published, reproduced or disclosed, in whole or part, to any other person.
The information and data presented in this document may discuss general market activity or industry trends but is not intended to be relied upon as a forecast, research or investment advice. It is not a financial promotion and represents no offer, solicitation or recommendation of any kind, to invest in the strategies or in the investment vehicles it refers to. Some of the investment strategies described or alluded to herein may be construed as high risk and not readily realisable investments, which may experience substantial and sudden losses including total loss of investment.
The investment views, economic and market opinions or analysis expressed in this document present Unigestion’s judgement as at the date of publication without regard to the date on which you may access the information. There is no guarantee that these views and opinions expressed will be correct nor do they purport to be a complete description of the securities, markets and developments referred to in it. All information provided here is subject to change without notice. To the extent that this report contains statements about the future, such statements are forward-looking and subject to a number of risks and uncertainties, including, but not limited to, the impact of competitive products, market acceptance risks and other risks.
Data and graphical information herein are for information only and may have been derived from third party sources. Although we believe that the information obtained from public and third party sources to be reliable, we have not independently verified it and we therefore cannot guarantee its accuracy or completeness. As a result, no representation or warranty, expressed or implied, is or will be made by Unigestion in this respect and no responsibility or liability is or will be accepted. Unless otherwise stated, source is Unigestion. Past performance is not a guide to future performance. All investments contain risks, including total loss for the investor.
Unigestion SA is authorised and regulated by the Swiss Financial Market Supervisory Authority (FINMA). Unigestion (UK) Ltd. is authorised and regulated by the UK Financial Conduct Authority (FCA) and is registered with the Securities and Exchange Commission (SEC). Unigestion Asset Management (France) S.A. is authorised and regulated by the French “Autorité des Marchés Financiers” (AMF). Unigestion Asset Management (Canada) Inc., with offices in Toronto and Montreal, is registered as a portfolio manager and/or exempt market dealer in nine provinces across Canada and also as an investment fund manager in Ontario and Quebec. Its principal regulator is the Ontario Securities Commission (OSC). Unigestion Asia Pte Limited is authorised and regulated by the Monetary Authority of Singapore (MAS). Unigestion Asset Management (Copenhagen) is co-regulated by the “Autorité des Marchés Financiers” (AMF) and the “Danish Financial Supervisory Authority” (DFSA). Unigestion Asset Management (Düsseldorf) SA is co-regulated by the “Autorité des Marchés Financiers” (AMF) and the “Bundesanstalt für Finanzdienstleistungsaufsicht” (BAFIN).