Our scenario for the summer echoed the broad economic and financial data: growth is making a comeback and markets are welcoming this improvement. However, the rally conceals imbalances, and the world of high yield credit seems to us to be considerably more fragile than the world of equities. As explained last week, we are uncomfortable with positioning and valuation in credit markets, and we see an underweight position in this sub-segment as a way of hedging against the economic risk of a return to recession at a lower cost. This is a risk, not our core scenario: growth is there, but we feel it is essential to think about the risks at this stage of the recovery to be better prepared for them.

Junk

As explained last week, this month we have a preference for developed equities over high yield credit. The starting point of this preference is based on two important elements: sentiment and valuation. In terms of market sentiment, while the market has been less fragile than we expected in August, it is beginning to give divergent signals between equities and credit, and is starting to show some signs of running out of steam. Our Market Stress Nowcaster, which combines three types of market data into an aggregate indicator of risk aversion, has dropped remarkably since 24 March, when the markets turned upward. While the three types of indicators were unanimous from April to July, the month of August began to reveal a divergence that deserves our full attention: credit spreads continued to contract overall, for different qualities of issuers. The spreads on the iTraxx Crossover Euro CDS index contracted by 50 basis points (bps) in August, while the spreads on the iTraxx Europe index fell by 6 bps. This evolution is generally in line with the evolution of European cash spreads for comparable issuers. Investment grade spreads contracted by 13 bps while high yield spreads fell by 32 bps. In the US, high yield CDS fell by 77 bps. However, this global and rapid contraction in spreads was not accompanied by a similar contraction in implied volatilities: while the risk of default anticipated by investors apparently decreased, their willingness to hedge remained. The VIX index thus increased marginally (+1.7%) and the VStoxx index maintained its level in August. The same is true for many other implied volatility indices: the Move index, the G7 and EM FX volatility indices as well as volatility indices for specific stocks such as Amazon or Apple. Equity and currency holders thus have less risk appetite than corporate bondholders. The second element relating to sentiment is that investor positioning on high yield has also improved significantly in August. The beta of macro hedge funds and CTAs has returned to their historical highs, suggesting that an overweight position in the asset class is beginning to become a crowded trade. The investment grade beta has fallen back, and the overall equity beta has simply held steady without much enthusiasm. Positioning data shows a similar picture: high yield investments have risen to higher levels now. Here again, the credit/equity spread is pushing us to move away from the former asset class in favour of the latter. In terms of valuation, credit spreads have clearly returned to singularly lower levels, clearly indicating the end of the recession caused by the period of lockdown. According to our “time series” valuation indicators, investment grade and high yield risk premia are expensive in absolute terms, but are also the most expensive of the growth-related risk premia at the end of August: this signal is not very strong, but the credit/equity spread is beginning to become significant (close to 1 standard deviation). Exaggerated investor appetite and unattractive valuations: these are two clear warning signs for us, and we remain underweight high yield. But that’s not all. There is a second line of argument in favour of this underweight, linked to our current positioning. Make no mistake, we are not negative on the outlook for growth assets over the next six months: on the macro side of things, we continue to believe in a V-shaped recovery. Our Growth Nowcaster has just crossed the threshold between recessions and economic expansion and it is not a limited trend: the US, China, Taiwan, India and Switzerland have all emerged from recession while the Eurozone, Great Britain and Japan are showing clear signs of recovery. Only Canada, New Zealand, Australia and Norway seem to be slightly behind the movement while moving in the same direction. For us, the risk is that this recession, which could be described as technical since it was caused by government measures, could end up being a true endogenous recession and much less easy to contain now that the policy mix has already done its job. While our growth indicators point to a robust recovery, doubts persist. True, 70% of growth indicators are up compared to last month but unemployment rates remain high: 8% in the United States, down from 14.7% in April. In the Eurozone, unemployment rates have moved little because of the social shock absorber system, but recently the unemployment rate has begun to rise from 7.3% to 7.9%: a limited variation but potentially the beginning of a trend that should be followed carefully. The same applies to default rates in the high yield universe. Default rates on European bonds have doubled from 1.2% at the end of 2019 to 2.4% in the first half of 2020. They are expected to reach 5% by the end of the year, according to Fitch Ratings’ latest report, which covers 12-month issuance trends, secondary market price developments and defaults through the first half of the year. Again, a wave of defaults could also damage the global economy, feeding a spiral and naturally leading to a recession. The counter argument is that unemployment and defaults are lagging indicators of the cycle and that their course will eventually be reversed, but it is important to recognise that this recession is of a hitherto unobserved nature so we remain cautious. An important element of our relative positioning is based on allocation spreads between CDS indices and equity indices. To date, our positioning has favoured developed equities and US equities in particular. These universes contain an over-representation of industries that we believe embody the future of the global economy, including technology industries. In the S&P 500 index, the information technology sector represents 28% of the index. By contrast, representation in high yield CDS indices is only 6% in the US and 0% in Europe. However, the latter indices contain a 10% allocation to the energy sector and 11% to financials, while these sectors have a respective weighting of 2% and 9% in the S&P 500 index. This relative bet that we make in September is also a ‘new vs. old economy’ bet as it is the old economy that would suffer more from a new slowdown. If for us the time has not come to give up investing in the stock market’s upturn, it is time to think about how to effectively protect ourselves against the risk of a slowdown. High yield today has a carry of 3.7% against 4.3% for equities; this hedge is thus obtained at a lower cost, the advantage of higher valuations. We see this as a hedging opportunity that has already helped us in the past to maintain the course of an overexposure to equities, which is our core conviction in September.What’s Next?
The beginning of an alignment of planets
What if it’s not all over?
The key is sector allocation
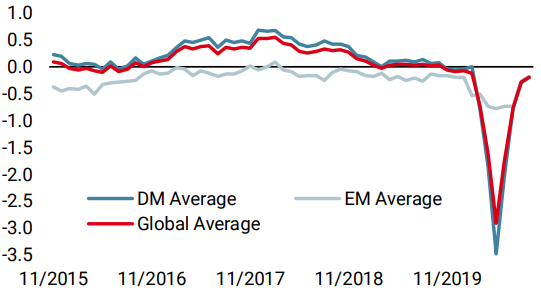
Unigestion Nowcasting
World Growth Nowcaster
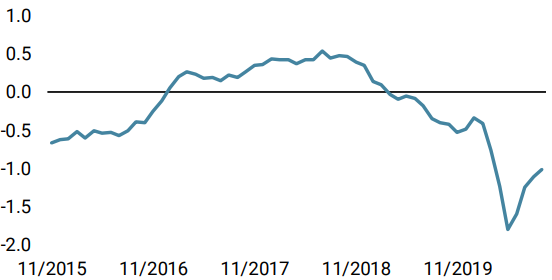
World Inflation Nowcaster
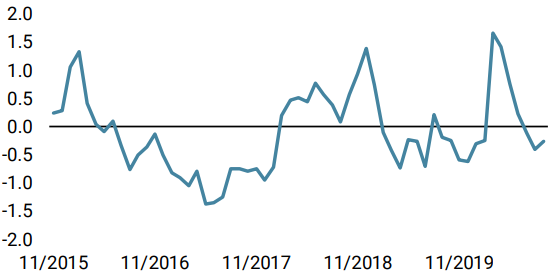
Market Stress Nowcaster
Weekly Change
- Our world Growth Nowcaster increased last week, as data in Europe, the UK and Japan rose rapidly.
- Our world Inflation Nowcaster increased slightly, masking the strong rise in UK inflation data counteracted by lower data in Canada and Japan.
- Last week, our Market Stress Nowcaster remained surprisingly steady as liquidity and credit spreads failed to mirror the increase in volatility.
Sources: Unigestion. Bloomberg, as of 07 September 2020.
Important Information
This document is provided to you on a confidential basis and must not be distributed, published, reproduced or disclosed, in whole or part, to any other person.
The information and data presented in this document may discuss general market activity or industry trends but is not intended to be relied upon as a forecast, research or investment advice. It is not a financial promotion and represents no offer, solicitation or recommendation of any kind, to invest in the strategies or in the investment vehicles it refers to. Some of the investment strategies described or alluded to herein may be construed as high risk and not readily realisable investments, which may experience substantial and sudden losses including total loss of investment.
The investment views, economic and market opinions or analysis expressed in this document present Unigestion’s judgement as at the date of publication without regard to the date on which you may access the information. There is no guarantee that these views and opinions expressed will be correct nor do they purport to be a complete description of the securities, markets and developments referred to in it. All information provided here is subject to change without notice. To the extent that this report contains statements about the future, such statements are forward-looking and subject to a number of risks and uncertainties, including, but not limited to, the impact of competitive products, market acceptance risks and other risks.
Data and graphical information herein are for information only and may have been derived from third party sources. Although we believe that the information obtained from public and third party sources to be reliable, we have not independently verified it and we therefore cannot guarantee its accuracy or completeness. As a result, no representation or warranty, expressed or implied, is or will be made by Unigestion in this respect and no responsibility or liability is or will be accepted. Unless otherwise stated, source is Unigestion. Past performance is not a guide to future performance. All investments contain risks, including total loss for the investor.
Unigestion SA is authorised and regulated by the Swiss Financial Market Supervisory Authority (FINMA). Unigestion (UK) Ltd. is authorised and regulated by the UK Financial Conduct Authority (FCA) and is registered with the Securities and Exchange Commission (SEC). Unigestion Asset Management (France) S.A. is authorised and regulated by the French “Autorité des Marchés Financiers” (AMF). Unigestion Asset Management (Canada) Inc., with offices in Toronto and Montreal, is registered as a portfolio manager and/or exempt market dealer in nine provinces across Canada and also as an investment fund manager in Ontario and Quebec. Its principal regulator is the Ontario Securities Commission (OSC). Unigestion Asia Pte Limited is authorised and regulated by the Monetary Authority of Singapore (MAS). Unigestion Asset Management (Copenhagen) is co-regulated by the “Autorité des Marchés Financiers” (AMF) and the “Danish Financial Supervisory Authority” (DFSA). Unigestion Asset Management (Düsseldorf) SA is co-regulated by the “Autorité des Marchés Financiers” (AMF) and the “Bundesanstalt für Finanzdienstleistungsaufsicht” (BAFIN).