From the outset, US President Trump has been clear that increasing economic and corporate wealth is his top priority. During his presidency, he has consistently used the stock market to measure the success of his actions and policies. But what if we look at corporate earnings, the nexus of everything from trade to fiscal to regulatory reform? After enjoying a big increase in earnings due to the tax overhaul, corporates have seen their earnings deteriorate sharply. Analysts believe that this is only temporary, the trough is near and future earnings growth will improve. However, dividends in the S&P 500 reveal a different picture, implying anaemic earnings growth for the coming years. “Something’s gotta give!” Since Donald Trump took office, annual S&P 500 profits have grown at twice their historical growth rate. Obviously, any discussion of the president’s impact on profits begins with the corporate tax overhaul. Booked profits exceeded analyst predictions by almost 8% in 2018. However, upside surprises of this magnitude are rare and tough to repeat, and earnings growth forecasts are back to the usual pattern – deteriorating over time. This year, analysts have heavily downgraded earnings, leading to a forecast of a 3.2% decline for the third quarter (Q3) year-on-year. Given the historic trend that many companies’ earnings surpass estimates, we believe that we could end the quarter in slightly positive territory. But even if we get marginally positive earnings this quarter, the trend has clearly changed since the tax overhaul. With earnings-per-share growth stalling, market performance depends on low rates more than ever. Or, said differently, President Trump publicly speaks disparagingly about Fed Chairman Jerome Powell – and then takes the credit for his efforts. In Q2, year-on-year earnings growth was the weakest since the 2015-2016 earnings recession. Excluding buyback benefits, the S&P 500 posted the first quarterly year-on-year decline (-0.6%) in three years. The tone during the earnings calls was very cautious, suggesting very low levels of optimism, the lowest since Q2 2003. One in five companies in the S&P 500 mentioned negative impacts from the tariffs and trade dispute. Uncertainty about the economy and the trade situation has led to postponement in big investments in buildings and equipment. Consequently, we expect that the negative earnings surprises in Q3 will mostly come from sectors with high exposure to global trade and those with high international revenue exposure due to the strong US dollar. Last week, the Q3 earnings season kicked off with an encouraging rate of earnings beats. Across the S&P 500, these first few days of results have shown actual earnings coming in 3.7% ahead of estimates on average. Over the next two weeks, companies representing two thirds of the S&P 500 market capitalisation will report. Their guidance will give us a good indication if the trough in earnings is behind us and if the very high earnings growth expectations from the analysts for 2020 (+10.6%) and 2021 (+9%) are realistic. Dividends tend to be far less volatile year-on-year than respective share prices, although both are influenced by the capacity of a firm to generate earnings. Companies normally manage shareholder expectations using long-term dividend payout targets, but they can also try to maximise shareholder satisfaction by deciding to temporarily deviate from its policy. Shareholders often use dividend payments as the main indicator of a company’s health and of management’s performance. Therefore, companies are more likely to increase payouts when earnings fall than they are to decrease payouts when earnings rebound, creating a convexity in dividend payments versus earnings. In 1982, the SEC adopted a new rule that provided companies with a safe haven against charges of market manipulation when repurchasing their own shares. That regulation made dividends even more stable as buybacks could now be used as dividends that offer management teams greater flexibility to increase and decrease the amount of cash returned to shareholders. In the current context where uncertainties are high and global growth low, companies tend to postpone their capital expenditures and return capital to investors via more flexible buyback operations. This, combined with very cheap financing (interest rates and credit spreads), has resulted in US corporates being the largest net buyers of US equities over the last decade, repurchasing more than USD 5tn since the financial crisis. In 2018, the payout ratio equaled 88% of earnings with about two thirds coming from buybacks and one third from dividends. A 50% share repurchase increase to an all-time high of over USD 800bn in the same year triggered a big public debate about the use of corporate cash in Washington and beyond. In contrast, dividends no longer seem to attract attention despite a steady average annual rise of 7% over the past decade. In contrast to the much more upbeat earnings expectations, the dividend market is pricing in an anaemic 0.7% annual growth over the next decade. To put that number into perspective, the S&P 500 dividend-per-share growth has never averaged below 2.2% in any 10-year period since 1950. Moreover, dividend markets have been much more resilient during recessions. During the last 11 downturns (since 1947), dividends declined by a median of 5% from peak to trough and have taken a median of five quarters to recover to pre-recession peaks. Clearly, S&P 500 dividends and the underlying spot market tell two different stories. Therefore, we see an attractive relative value opportunity in buying dividend futures and selling S&P 500 futures (beta hedged) against it. Due to heavy underperformance recently, dividends have significant catch-up potential if the black cloud of uncertainty dissipates. In the case of a recession, the magnitude of the dividend decline should show little correlation to the magnitude of the decline in earnings. With buybacks providing an extra layer of protection, dividends should benefit from their stability.“Something’s Gotta Give” – Johnny Mercer, 1954
What’s Next?
Are the Headwinds Fading?…
…The Dividend Market is not Convinced
The Future Will Show Who Has Been Right

Our proprietary nowcasters currently show a low risk of recession and very low risk of inflation surprise, offering a good environment for carry strategies. In this context, dividends offer a very compelling risk-reward. We believe that the relatively positive developments on the political front and the stabilisation in macro data are not well priced in the market. Negative sentiment and high uncertainty have led to a light positioning in risky assets. Cyclical assets look fairly valued compared to very expensive hedging assets. A small positive sentiment change could trigger a pain trade on the upside.Asset Allocation: The Pain Trade is to the Upside

Something’s Gotta Give

Our medium-term view is currently more constructive, as we are still overweight growth assets and underweight real assets. Given the current cost of hedging, we are using forex based strategies exposures to hedge ourselves against adverse market conditions. Over the month of October, the Uni-Global – Cross Asset Navigator fund lost -0.7% versus 0.9% for the MSCI AC World Index and –0.5% for the Barclays Global Aggregate (USD hedged). Year-to-date, the Uni-Global – Cross Asset Navigator has returned 9.4% versus 17.3% for the MSCI AC World index, while the Barclays Global Aggregate (USD hedged) index is up 8.2%.Strategy Behaviour
Performance Review
Unigestion Nowcasting
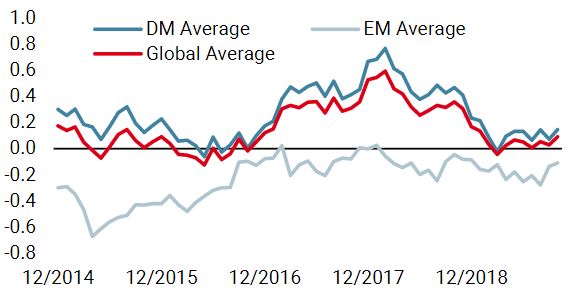
World Growth Nowcaster
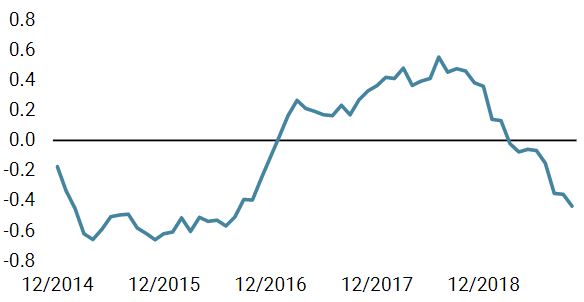
World Inflation Nowcaster
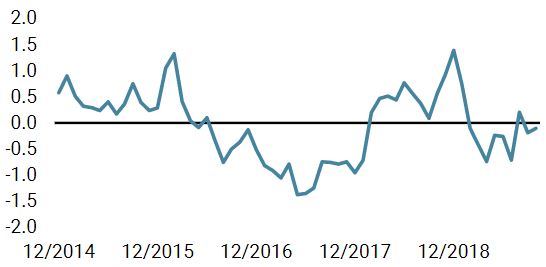
Market Stress Nowcaster
Weekly Change
- Our world Growth Nowcaster modestly increased last week, driven by broad-based improvement in data.
- Our world Inflation Nowcaster rose marginally over the last week, driven by US and UK data.
- Market stress also increased slightly over the week, driven largely by liquidity conditions.
Sources: Unigestion. Bloomberg, as of 21 October 2019.
Navigator Fund Performance
| Performance, net of fees | 2018 | 2017 | 2016 | 2015 |
| Navigator (inception 15 December 2014) | -3.6% | 10.6% | 4.4% | -2.2% |
Past performance is no guide to the future, the value of investments can fall as well as rise, there is no guarantee that your initial investment will be returned.
Important Information
Past performance is no guide to the future, the value of investments, and the income from them change frequently, may fall as well as rise, there is no guarantee that your initial investment will be returned. This document has been prepared for your information only and must not be distributed, published, reproduced or disclosed by recipients to any other person. It is neither directed to, nor intended for distribution or use by, any person or entity who is a citizen or resident of, or domiciled or located in, any locality, state, country or jurisdiction where such distribution, publication, availability or use would be contrary to law or regulation. This is a promotional statement of our investment philosophy and services only in relation to the subject matter of this presentation. It constitutes neither investment advice nor recommendation. This document represents no offer, solicitation or suggestion of suitability to subscribe in the investment vehicles to which it refers. Any such offer to sell or solicitation of an offer to purchase shall be made only by formal offering documents, which include, among others, a confidential offering memorandum, limited partnership agreement (if applicable), investment management agreement (if applicable), operating agreement (if applicable), and related subscription documents (if applicable). Please contact your professional adviser/consultant before making an investment decision.
Where possible we aim to disclose the material risks pertinent to this document, and as such these should be noted on the individual document pages. The views expressed in this document do not purport to be a complete description of the securities, markets and developments referred to in it. Reference to specific securities should not be considered a recommendation to buy or sell. Investors shall conduct their own analysis of the risks (including any legal, regulatory, tax or other consequences) associated with an investment and should seek independent professional advice. Some of the investment strategies described or alluded to herein may be construed as high risk and not readily realisable investments, which may experience substantial and sudden losses including total loss of investment. These are not suitable for all types of investors.
To the extent that this report contains statements about the future, such statements are forward-looking and subject to a number of risks and uncertainties, including, but not limited to, the impact of competitive products, market acceptance risks and other risks. Actual results could differ materially from those in the forward-looking statements. As such, forward looking statements should not be relied upon for future returns. Targeted returns reflect subjective determinations by Unigestion based on a variety of factors, including, among others, internal modeling, investment strategy, prior performance of similar products (if any), volatility measures, risk tolerance and market conditions. Targeted returns are not intended to be actual performance and should not be relied upon as an indication of actual or future performance.
Data and graphical information herein are for information only and may have been derived from third party sources. Unigestion takes reasonable steps to verify, but does not guarantee, the accuracy and completeness of this information. As a result, no representation or warranty, expressed or implied, is or will be made by Unigestion in this respect and no responsibility or liability is or will be accepted. All information provided here is subject to change without notice. It should only be considered current as of the date of publication without regard to the date on which you may access the information. Rates of exchange may cause the value of investments to go up or down. An investment with Unigestion, like all investments, contains risks, including total loss for the investor.
Uni-Global – Cross Asset Navigator is a compartment of the Luxembourg Uni-Global SICAV Part I, UCITS IV compliant. This compartment is currently authorised for distribution in Austria, Belgium, Denmark, Finland, France, Germany, Ireland, Italy, Luxembourg, Netherlands, Norway, Spain, UK, Sweden, and Switzerland. In Italy, this compartment can be offered only to qualified investors within the meaning of art.100 D. Leg. 58/1998. Its shares may not be offered or distributed in any country where such offer or distribution would be prohibited by law.
No prospectus has been filed with a Canadian securities regulatory authority to qualify the distribution of units of these funds and no such authority has expressed an opinion about these securities. Accordingly, their units may not be offered or distributed in Canada except to permitted clients who benefit from an exemption from the requirement to deliver a prospectus under securities legislation and where such offer or distribution would be prohibited by law. All investors must obtain and carefully read the applicable offering memorandum which contains additional information needed to evaluate the potential investment and provides important disclosures regarding risks, fees and expenses.
All investors must obtain and carefully read the prospectus which contains additional information needed to evaluate the potential investment and provides important disclosures regarding risks, fees and expenses. Unless otherwise stated performance is shown net of fees in USD and does not include the commission and fees charged at the time of subscribing for or redeeming shares.
Unigestion UK, which is authorised and regulated by the UK Financial Conduct Authority, has issued this document. Unigestion SA authorised and regulated by the Swiss FINMA. Unigestion Asset Management (France) S.A. authorised and regulated by the French Autorité des Marchés Financiers. Unigestion Asia Pte Limited authorised and regulated by the Monetary Authority of Singapore. Performance source: Unigestion, Bloomberg, Morningstar. Performance is shown on an annualised basis unless otherwise stated and is based on Uni Global – Cross Asset Navigator RA-USD net of fees with data from 15 December 2014 to 21 October 2019.