After a strong global economic recovery in the first half of the year, the events of Q3 – weakening growth and continuing inflation – have become concerning and raise the potential risk of stagflation. Stagflation is rare and the opposite of the macroeconomic environment we have experienced over the last decade. While it would be a nightmare outcome for the economy, for monetary policy and for investors, it is not our core scenario over the coming months. For this, we would need to see a more intense continuation of the current dynamic and a significant stalling in the reopening of economies.

Breaking Up Is Hard to Do

What Happened?
The rising spectre of stagflation
The reopening/reflation theme that characterised the start of the year has stalled over the last few months with the spread of the Delta variant and a fading fiscal impulse. As we have communicated, our systematic growth indicators – both Nowcasters and Newscasters – have been heading south from elevated to more neutral levels. At the same time, our Inflation Nowcaster has remained elevated, supported by multiple factors including Input Prices, Wage Inflation, and, importantly, Expected Inflation. It is through these channels – pockets of price increases leading to an inflationary mindset that sees a broader rise in prices from firms as well as employees asking for higher wages – that a transitory supply shock transforms into a genuine inflationary scenario. With the backdrop of lower – but still decent – economic growth, the potential risk of stagflation is moving up in investors’ minds.
A framework for the drivers of stagflation
Stagflation is, in many ways, a nightmare scenario for the economy, monetary policy, and investors: real economic growth is low or even negative at the same time that prices move ever higher, leading to lower standards of living and high unemployment. Bruno and Sachs1 presented a framework for stagflation that rests on two key conditions: (1) a large and unexpected increase in prices for inputs produced externally requiring a reduction in the standard of living for importing countries, and (2) wage inflexibility that reduces demand for labour and thereby increases unemployment. They argue that these elements are critical to understanding the rare cases of stagflation in the recent past: OECD countries in the 1970s, when the oil embargo of 1973 hit prices and reverberated throughout the decade. Figure 1 charts growth and inflation for the US and UK during the period, highlighting a similar pattern seen with many other OECD countries at the time: a cyclical recovery in the early 1970s derailed by the oil crisis (grey vertical line), after which growth and inflation decoupled and stagflation became the emergent regime.
Figure 1: Growth and Inflation (1960-1985)
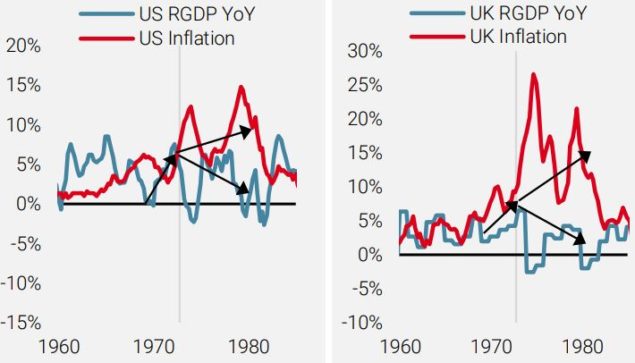
Source: Bloomberg, Unigestion, as of 30.09.2021
As Bruno and Sachs discuss, the downward inflexibility of wages feeds into the price/wage spiral and can shift an economy from an inflationary expansion to stagflation. Figure 2 shows how US nominal wages during the 1970s continued to grow steadily, as employees demanded higher wages in the face of higher consumption prices. However, this nominal wage growth was out of line with deteriorating economic conditions and lower productivity, leading to layoffs and higher unemployment. Importantly, real wage growth collapsed as nominal wages could not keep up with goods inflation, leading to lower real incomes and standards of living.
Figure 2: US Wages vs Productivity
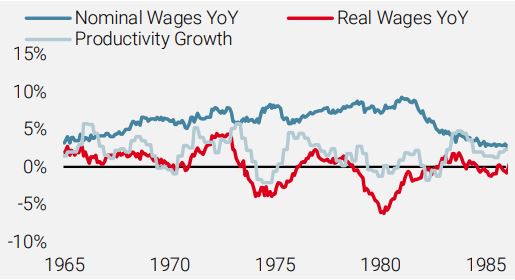
Reading note: Productivity Growth is the year-over-year change in the output per hour of labour in the non-farm business sector.
Source: Bloomberg, Federal Reserve Bank of St. Louis, Unigestion, as of 30.09.2021.
Where are we today?
Let us be clear: stagflation is not our near-term core scenario but rather a growing tail risk. We would need to see a continuation of the current dynamic, in particular economies stalling in their reopening, to change our view. It is also important to point out that the example of the 1970s is not a perfect analogy for today. The global economy is coming out of an historic period of lockdowns, the price of oil has less of an impact on individuals as the source of today’s supply shock is more varied, and monetary policymakers have gained the experience of the last period of stagflation. However, given the dramatic impact of stagflation on markets, we continue to assess the situation closely.
As we have communicated previously, producer prices have risen significantly faster than consumption prices, providing further upward pressure on inflation if firms pass on these additional higher costs to consumers. At the same time, nominal wage growth has remained relatively constant despite unemployment figures receding. Figure 3 compares the growth in hourly wages in the US against the unemployment rate, placing the current situation (red) into the context of the 1970s (dark blue) as well as the last couple of decades (light blue). While the number of data points remains low, thus far wages have not exhibited the inverse relationship typically expected over the short run.
Figure 3: US Wage Growth vs Unemployment Rate
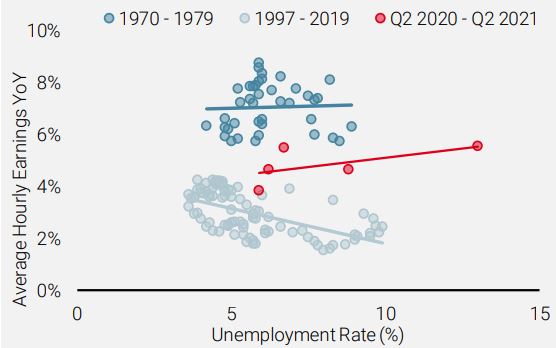
Source: Bloomberg, Unigestion, as of 30.09.2021
Few shelters in the stagflation storm
Stagflation is, by and large, the opposite of the macroeconomic environment we have had for most of the last decade: decent growth and muted inflation pressures. Thus, investors have moved into positions that benefited the most over the last decade: nominal bonds (where yields continued to grind lower and have offered diversification) and equities (especially those with long-term growth prospects that have benefited from falling discount rates). However, the reversal of the macro environment to a period of stagflation would lead to a significant reversal in these markets. Figure 4 shows the average monthly performance of growth (credit spreads and equities), defensive (government bonds), and real assets (inflation breakeven and commodities) since 1999 and compares that to their performance in “Goldilocks” and “Stagflation” months. As the chart demonstrates, the dispersion between these two regimes is significant, making the transition from a Goldilocks scenario (as arguably we had at the beginning of this year) to an inflation shock with depressed growth a challenging one for investors.
Figure 4: Average Monthly Asset Performance
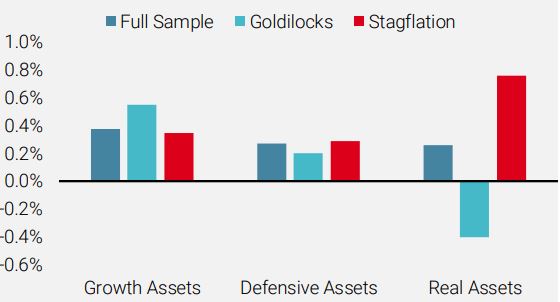
Reading Note: “Goldilocks” months are defined as those where our Global Growth and Inflation Nowcasters signalled low to very low risk of recession or an inflation shock. “Stagflation” months are defined as those where our Inflation Nowcater signalled high to very high risk of an inflation shock but our Growth Nowcaster signalled the economy was not in a strong expansion (low to very high recession risk).
Source: Bloomberg, Unigestion, data from 31.12.1998 to 30.06.2019.
Before the 1970s, the concept of stagflation was thought to be impossible. Indeed, the combination of circumstances that give rise to stagflation are quite rare, and so many investors have not had the experience of managing portfolios during such tumultuous times. In our view, it remains too early to sound the alarm on stagflation and our near-term macro scenario remains positive: a subsiding of coronavirus fears and continued economic reopening. Thus, our dynamic portfolio exposures are tilted towards both growth-oriented assets, such as equities and credit, and real assets, in particular inflation breakevens and cyclical commodities. We expect the real asset exposure will be with us for some time, but if the risk of stagflation rises, we will progressively reduce our growth exposure to ride out the difficult storm.
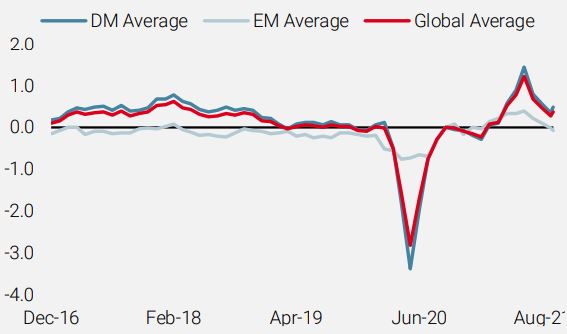
Unigestion Nowcasting
World Growth Nowcaster
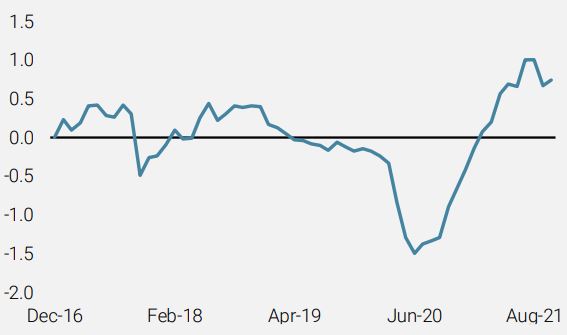
World Inflation Nowcaster
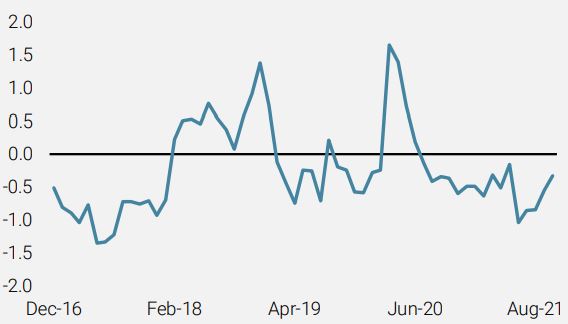
Market Stress Nowcaster
Weekly Change
- Last week, our World Growth Nowcaster recovered modestly with an improvement in US growth.
- Our World Inflation Nowcaster was steady with small and offsetting changes across countries.
- Our Market Stress Nowcaster shifted lower thanks to improved liquidity and somewhat lower volatility.
Sources: Unigestion, Bloomberg, as of 08 October 2021.
1Michael Bruno and Jeffrey Sachs, Economics of Worldwide Stagflation. Cambridge, MA.
Harvard University Press, 1985.
Important Information
This document is provided to you on a confidential basis and must not be distributed, published, reproduced or disclosed, in whole or part, to any other person.
The information and data presented in this document may discuss general market activity or industry trends but is not intended to be relied upon as a forecast, research or investment advice. It is not a financial promotion and represents no offer, solicitation or recommendation of any kind, to invest in the strategies or in the investment vehicles it refers to. Some of the investment strategies described or alluded to herein may be construed as high risk and not readily realisable investments, which may experience substantial and sudden losses including total loss of investment.
The investment views, economic and market opinions or analysis expressed in this document present Unigestion’s judgement as at the date of publication without regard to the date on which you may access the information. There is no guarantee that these views and opinions expressed will be correct nor do they purport to be a complete description of the securities, markets and developments referred to in it. All information provided here is subject to change without notice. To the extent that this report contains statements about the future, such statements are forward-looking and subject to a number of risks and uncertainties, including, but not limited to, the impact of competitive products, market acceptance risks and other risks.
Data and graphical information herein are for information only and may have been derived from third party sources. Although we believe that the information obtained from public and third party sources to be reliable, we have not independently verified it and we therefore cannot guarantee its accuracy or completeness. As a result, no representation or warranty, expressed or implied, is or will be made by Unigestion in this respect and no responsibility or liability is or will be accepted. Unless otherwise stated, source is Unigestion. Past performance is not a guide to future performance. All investments contain risks, including total loss for the investor.
Unigestion SA is authorised and regulated by the Swiss Financial Market Supervisory Authority (FINMA). Unigestion (UK) Ltd. is authorised and regulated by the UK Financial Conduct Authority (FCA) and is registered with the Securities and Exchange Commission (SEC). Unigestion Asset Management (France) S.A. is authorised and regulated by the French “Autorité des Marchés Financiers” (AMF). Unigestion Asset Management (Canada) Inc., with offices in Toronto and Montreal, is registered as a portfolio manager and/or exempt market dealer in nine provinces across Canada and also as an investment fund manager in Ontario and Quebec. Its principal regulator is the Ontario Securities Commission (OSC). Unigestion Asset Management (Copenhagen) is co-regulated by the “Autorité des Marchés Financiers” (AMF) and the “Danish Financial Supervisory Authority” (DFSA). Unigestion Asset Management (Düsseldorf) SA is co-regulated by the “Autorité des Marchés Financiers” (AMF) and the “Bundesanstalt für Finanzdienstleistungsaufsicht” (BAFIN).