As the new decade approaches in the coming weeks, which are the key elements that are likely to persist from those that we have seen in the years that have followed the Great Financial Crisis? In our view, from an economic perspective, there are two important (and connected) facts that best characterise this period. Firstly, it is the first recession-free decade in US economic history. Secondly, never in the modern era have central banks owned as many financial assets as they do today. Will this situation last over the years to come, and what will it mean for asset allocation? From the 1970s through to 2008, the US economy has faced seven recessions, as measured by the National Bureau of Economic Research. That amounts to at least one every decade. These periods were characterised by specific contexts. We had the “great inflation” from the mid-1970s to the mid-1980s, the “great deregulation” during the 1990s, and the “great moderation” between 2003 and 2007, as defined by Stock and Watson, who made reference to the low volatility of macroeconomic data observed after the tech bubble and before the Great Financial Crisis (GFC). Over these four decades, the business cycle mattered for the US economy, with phases of expansion, overheating, slowdown and then recession. We also observed a large variation in inflation, labour costs and energy prices. Although we had a European recession in 2012 and saw a slowdown in emerging markets, the current decade will be the first without a US recession. More importantly, the volatility of key US macro data, such as GDP, consumption, investment and consumer prices, has never been as low as during this decade. It is even lower than that seen during the “great moderation”. Since 2010, realised volatility for US GDP growth has been 0.7%, compared to 2.2% in the 1970s and 1.4% between 2000 and 2010. One can observe a similar pattern for inflation: 1.4% this decade versus 2.3% in the previous one. With variations in economic activity becoming smaller and smaller, does this point to an end of the business cycle? There are usually three key dimensions which best characterise an economic context: monetary policy, fiscal policy and global trade. Over the last ten years, each of these have evolved markedly. Central banks across the world have strongly supported activity with accommodative monetary policy through “traditional” rate cuts initially and then quantitative easing. That support pushed things into uncharted territory for three reasons: 1) the move has been synchronised across the world; 2) the size of liquidity injections has been large; 3) the length of the support has never been seen before. Fiscal policy has been either supportive, like in the US and China, or neutral, as in Europe or Japan. Finally, the growth in global trade has been negative over the last ten years for the first time since 1960. Data from the World Bank showed that merchandise trade increased from 16% (of global GDP) in 1960 to 47% in 2010, increasing by around 10% of global GDP per decade despite recessions during this period. Currently, it represents 46%, a lower number than ten years ago and sharply lower than the peak of 52% observed in 2008 before the GFC. This is largely due to a deleveraging of the global economy and illustrates how the drivers of the global economy have changed. In our view, the lower variation in GDP stems mainly from a higher weight of services in the US and the global economies. Consumption of services currently represents 18% of US GDP vs 11% in 1970. Data from the IMF also highlights that trade in services has continued to grow over the decade, rising from 10% to 13% of global GDP over the period, while trade in goods has declined, as mentioned previously. Services are less cyclical than manufacturing activities. Consequently, their rising weight in the global economy and in employment creates lower changes in inventories, which feeds into more stable supply chains and thus a more stable economy.“Ten Years Gone” – Led Zeppelin, 1975
What’s Next?
The End of the Business Cycle?
The Situation Reflects a Changing US and Global Economy
These changes in the structure of the global economy have increased polarisation across sectors, countries and political systems. The impact of these factors has increased over the last few years. Polarisation has concerned “Disruptors” versus “Disrupted”, “Services” versus “Manufacturing”, “Rates sensitive” versus “Rates non-sensitive” and “Exposed to globalisation” versus “Non-exposed”. Consequently, the winners of the decade, mainly big tech companies, are not the same as in previous ones: essentially cyclical companies benefiting from globalisation (such as in the materials sector).
The dispersion of returns within asset classes has also increased. As an illustration, the gap between value stocks and growth stocks is at a record high. Since 2009, the MSCI World IT index has delivered 15.4% a year on average versus only 2% and 5.8% respectively for the MSCI World Energy and the MSCI World Bank indices. Over the same period, the MSCI World index has outperformed the MSCI World equal weighted index by 29%. The main consequence of this trend is a rise in inequality because new winners benefit from the “first takes all” theory that tend to create oligopolies.

While inequalities in developed and emerging countries have expanded due to lower GDP growth, it is clear that governments and financial institutions will do “whatever it takes” in the future to prevent any economic shock in order to maintain social stability. As a result, a supportive policy mix would last, and potentially be amplified, in the case of an economic slowdown. We believe that this will maintain the volatility of macroeconomic variables at a low level, reduce the risk of large shocks and reduce the probability of sustained financial turmoil. Consequently, we expect a reduction in the risk premium of most liquid risky assets. Does this mean that equities will become the new bonds, delivering income with a low risk of drawdown? Based on returns delivered during the current decade, we would argue yes. Over the last nine years, US equities have returned the best excess return on average since 1986 (13% per year), higher than those seen in the 1980s (9%), 1990s (12%) and those delivered between 2000 and 2009 (-1%). The Sharpe ratio has also improved, while realised volatility has been consistently lower on an historical basis since 2010. We observe a similar pattern for US high yield. This result is even more exceptional because it has been realised in a context of low growth and low inflation. We are all aware of the magic driver: low interest rates. Will they stay low in the coming years?Lower Macro Volatility Implies a Weaker Financial Shock
Of course, it is always difficult to make forecasts for asset returns for the next decade. Who would have forecast in 2009 that negative bond yields would represent more than 30% of the Barclays Global Aggregate market capitalisation? Ten years ago, everybody thought that accommodative monetary policy would be inflationary. Who would have guessed that despite the biggest monetary experiment of all time, that there would be no inflationary pressures.
Our conviction is that the world has changed and that, for different reasons, central banks will remain active and supportive. Rather than debate the legitimacy of this stance, we prefer incorporating this element into our asset allocation as fact and anticipating what kind of consequences this will have on investors and the global economy. Our view is simple: bond yields will remain at low levels, and that the probability of us singing David Bowie’s “Golden Years” in 2029 is not negligible.

Ten Years Gone

Our medium-term view is currently constructive: we are still overweight growth assets and underweight precious metals. Given the current cost of hedging, we are using forex based strategies exposures to hedge ourselves against adverse market conditions. For the month of November to date, the Multi Asset Risk Targeted Strategy is up 1.0% versus a 1.7% return for the MSCI AC World Index and a -0.9% return for the Barclays Global Aggregate (USD hedged). Year-to-date, the Multi Asset Risk Targeted Strategy has returned 11.0% versus 21.4% for the MSCI AC World index, while the Barclays Global Aggregate (USD hedged) index is up 7.6%. * The Multi Asset Risk Targeted Strategy performance is shown in USD net of fees for the representative account of the Multi Asset Risk Targeted (Medium) USD Composite and reflects the deduction of advisory fees and brokerage commission and the reinvestment of all dividends and earnings. Past performance is not indicative of future performance. This information is presented as supplemental information only and complements the GIPS compliant presentation provided on the following page.Strategy Behaviour
Performance Review
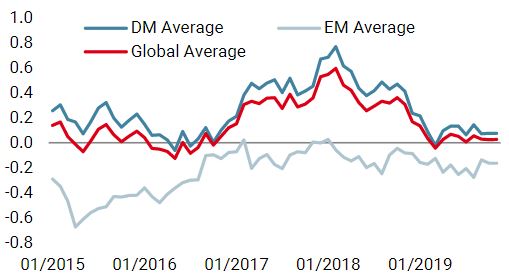
Unigestion Nowcasting
World Growth Nowcaster
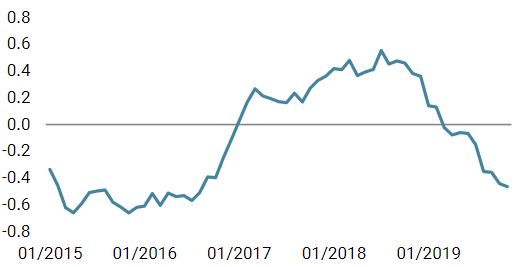
World Inflation Nowcaster
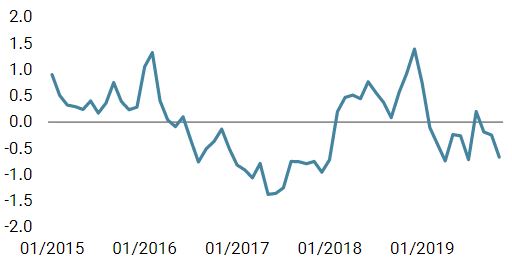
Market Stress Nowcaster
Weekly Change
- Our world Growth Nowcaster remained unchanged this week, as both emerging and developed economies showed further signs of stabilisation.
- Our world Inflation Nowcaster went through a slight decrease last week but its diffusion index continues to indicating a stabilisation period.
- Market stress decreased, driven by all its components.
Sources: Unigestion. Bloomberg, as of 11 November 2019.
Important Information Past performance is no guide to the future, the value of investments can fall as well as rise, there is no guarantee that your initial investment will be returned. This document has been prepared for your information only and must not be distributed, published, reproduced or disclosed by recipients to any other person. This is a promotional statement of our investment philosophy and services only in relation to the subject matter of this presentation. It constitutes neither investment advice nor recommendation. This document represents no offer, solicitation or suggestion of suitability to subscribe in the investment vehicles it refers to. Please contact your professional adviser/consultant before making an investment decision. Where possible we aim to disclose the material risks pertinent to this document, and as such these should be noted on the individual document pages. Please contact Unigestion for a complete list of all the applicable risks. Some of the investment strategies described or alluded to herein may be construed as high risk and not readily realisable investments, which may experience substantial and sudden losses including total loss of investment. These are not suitable for all types of investors. To the extent that this report contains statements about the future, such statements are forward-looking and subject to a number of risks and uncertainties, including, but not limited to, the impact of competitive products, market acceptance risks and other risks. As such, forward looking statements should not be relied upon for future returns. Data and graphical information herein are for information only and may have been derived from third party sources. Unigestion takes reasonable steps to verify, but does not guarantee, the accuracy and completeness of this information. As a result, no representation or warranty, expressed or implied, is or will be made by Unigestion in this respect and no responsibility or liability is or will be accepted. All information provided here is subject to change without notice. It should only be considered current as of the date of publication without regard to the date on which you may access the information. Rates of exchange may cause the value of investments to go up or down. An investment with Unigestion, like all investments, contains risks, including total loss for the investor. This information is issued by Unigestion (UK) Ltd (“Unigestion”), which is authorised and regulated by the UK Financial Conduct Authority (“FCA”). Unigestion is also registered as an investment adviser with the U.S. Securities and Exchange Commission (“SEC”). This information is intended only for professional clients, institutional clients and eligible counterparties, as defined by the FCA, and qualified purchasers as defined by the SEC and has therefore not been adapted to retail clients. Unigestion Multi Asset Risk-Targeted (USD): 31 December 2014 to 30 September 2019 1: This year is incomplete, it stops in September. Special Disclosure: For presentations prior to 31.03.2018 the strategy was measured against the LIBOR 3M USD + 4%. Beginning April 2018 the firm determined that the benchmark did not accurately reflect the strategy mandate and the benchmark was removed. Definition of the Firm: For the purposes of applying the GIPS Standards, the firm is defined as Unigestion. Unigestion is responsible for managing assets on the behalf of institutional investors. Unigestion invests in several strategies for institutional clients: Equities, Hedge Funds, Private Assets and the solutions designed for the clients of our Cross Asset Solution department. The GIPS firm definition excludes the Fixed Income Strategy Funds, which started in January 2001 and closed in April 2008, and the accounts managed for private clients. Unigestion defines the private clients as High Net Worth Families and Individual investors. Policies: Unigestion policies for valuing portfolios, calculating performance, and preparing compliant presentations are available upon request. Composite Description: The Multi Risk Targeted (Medium) composite was defined on 15 December 2014. It consists of accounts which aim to deliver consistent smooth returns of cash + 5% gross of fees across all market conditions over a 3-year rolling period. It seeks to achieve this by capturing the upside during bull markets while protecting capital during market downturns. Benchmark: Because the composites strategy is absolute return and investments are permitted in all asset classes, no benchmark can reflect this strategy accurately. Fees: Returns are presented gross of management fees, administrative fees but net of all trading costs and withholding taxes. The maximum management fee schedule is 1.2% per annum. Net returns are net of model fees and are derived by deducting the highest applicable fee rate in effect for the respective time period from the gross returns each month. List of Composites: A list of all composite descriptions is available upon request. Minimum Account Size: The minimum account size for this composite is 5’000’000.- USD. Valuation: Valuations are computed in US dollars (USD). Performance results are reported in US dollars (USD). Internal Dispersion & 3YR Standard Deviation: The annual composite dispersion presented is an asset-weighted standard deviation calculated for the accounts in the composite the entire year. When internal dispersion is not presented it is as a result of an insufficient number of portfolios in the composite for the entire year. When the 3 Year Standard Deviation is not presented it is as a result of an insufficient period of time. Compliance Statement Unigestion claims compliance with the Global Investment Performance Standards(GIPS®) and has prepared and presented this report in compliance with the GIPS standards. Unigestion has been independently verified for the periods 1 January 2003 to 31 December 2016. The verification report(s) is/are available upon request. Verification assesses whether (1) the firm has complied with all the composite construction requirements of the GIPS standards on a firm-wide basis and(2) the firms policies and procedures are designed to calculate and present performance in compliance with the GIPS standards. Verification does not ensure the accuracy of any specific composite presentation.
Year
Composite
Return Gross
of FeesComposite Net Return
Benchmark Return
Number of Accounts
Internal Dispersion
Composite 3-Yr Std Dev
Benchmark 3-Yr Std Dev
Composite AUM (M)
Firm
AUM (M)
2015
-1.61%
-2.80%
–
1
–
–
–
127.24
15,550.31
2016
5.05%
3.79%
–
1
–
–
–
129.66
18,144.46
2017
11.16%
9.82%
–
1
–
4.79%
–
169.51
22,340.80
2018
-2.91%
-4.08%
–
1
–
3.72%
–
286.93
21,403.49
20191
10.70%
9.70%
–
1
–
4.43%
–
361.96
20,974.34