Change with continuity. This may have been the message sent by the Fed to the financial markets last week. On the surface, nothing changes with the reappointment of J. Powell as Fed Chairman. However, beneath the surface, the balance of power within the Fed board has shifted in favour of the “dovish” camp, as Brainard becomes vice-chairman, whereas the “hawkish” camp is weakened by renewals and resignations. In this context, and despite inflation being higher than anticipated by the US monetary authorities at the beginning of the year, we believe that the Fed will continue to focus on the return to full employment. This could take longer than usual due to the low participation rates and delay the anticipated rate hike cycle from Q2 to Q4 in 2022.

Don’t Let Me Be Misunderstood

Where Do We Go From Here?
Something in the way
Our investment process is based on two beliefs: 1) The correlation between assets and the economic environment is more stable than the correlation between assets; 2) Macroeconomic regimes determine asset returns over the medium term. Within this framework, it is essential to monitor the macroeconomic context and its various dimensions (activity, inflation, monetary policy, sentiment, valuation, etc.) in real time in order to dissociate what stems from a fundamental change as opposed to noise. Our Nowcasters, combined with a thorough analysis of the post-Covid supply chain – characterised by the absence of inventories and an overdependence on certain geographical areas and specific components – led us to identify very early on the risk of a “supply shock” as the most important factor for inflation in 2021. The fiscal stimulus, first used as precautionary savings and then as consumption, has added a “demand” effect to the initial “supply shock”, transforming the expected base effect on inflation in H1 2021 into a monumental inflation surprise. The magnitude of the shock is clearly visible in figure 1, where the volatility of inflation has risen dramatically this year, to levels not seen since the 1974 oil shock.
Figure 1: Realized Volatility of US Headline Inflation (1y rolling)
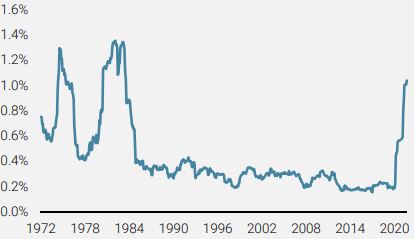
Source: Unigestion, BLS, Bloomberg as of 26.11.2021.
Cyclical vs. acyclical
Faced with such a shock, asset risk premia have adjusted. The asset rotation observed in 2021 reflects investors integrating the change in the inflation premium, relative to other risk premiums (growth, credit, liquidity, etc.). Real assets are indeed the best performers this year, with the most inflation-sensitive sectors such as Energy and Financials outperforming the most defensive ones. How long will this shock last? Can the inflation premium continue to adjust upwards?
To answer this question, we need to analyse the contributors to the inflation surprise, distinguishing between what comes from “supply” and what comes from “demand” and separating the cyclical from the more structural. Figure 2 shows the contribution of the main components to monthly changes in US headline inflation between 2019 and 2021.
Figure 2: Contribution to Monthly Change in Headline CPI
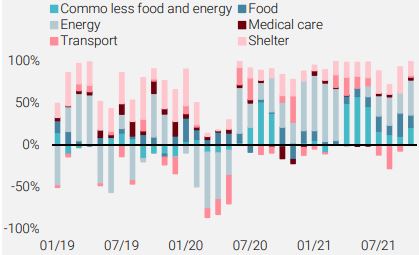
Source: Unigestion, BLS, Bloomberg as of 26.11.2021.
Two key elements stand out:
1) The most cyclical items, which are also the most volatile (food, energy and other commodities) and account for 41% of US CPI, explain most of the decline in inflation in 2020 and represent the bulk of the sharp rise in 2021. These three components combined contributed 3.3 percentage points to the 6.2% YoY increase in inflation, or more than 50% of the jump over the last 12 months.
2) More stable components such as “shelter” and “medical care” also rose more strongly than usual over the period but at a more sustainable pace: 3.5% for shelter on a YoY basis for example, contributing only 1.1 percentage points of the 6.2% YoY rise of the total index.
Based on IMF growth forecasts and EIA studies, it is difficult to imagine a further increase of more than 50% in food and energy prices over the next 12 months. An analysis of the forward curves shows that most energy commodities are in “backwardation”, even signalling expectations of lower prices for the next quarters. A recent study by the Dallas Fed also supports this view, pointing out that a barrel of oil at USD 100 during the coming winter would have a positive but moderate impact on headline inflation in 2022 and 2023, respectively around 0.2 and 0.1 on US inflation and 0.5 and 0.2 on 1-year inflation expectations. Moreover, the US household savings rate has “normalised”, falling from 17% to 6% in a few months, thus reducing the risk of excess demand for goods and services in the near future. As a result, even if the other components were to grow at a higher rate than the average over the last 20 years, notably “shelter” and “medical services”, it is very unlikely that headline inflation will remain above 3% in 2022. We therefore see the current situation on the inflation front as a peak and not as the starting point of a demand shock cycle. In this context, short-term (2yr and 3yr) US inflation breakevens above 3.3% seem too high to us, as does the pricing of a rapid and strong normalisation of monetary policy.
The Fed rules
Change with continuity. This is the Fed’s message. This is primarily evidenced by the introduction of AIT (Average Inflation Targeting), which tolerates inflation durably above its long-term target and thus prioritises employment and the output gap over inflation in the Fed’s reaction function, a reflection of its “dual mandate”. We see “Employment First” as the mantra of the Fed’s AIT version. The various white papers presented at the last Jackson Hole meeting, focusing on the labour market and the references to “full employment” as a precondition for raising rates at several Fed conferences, illustrate this point well. Figure 3 shows the extent to which the change in the participation rate and the evolution of demographics in the US affect the labour force dynamic. Combined with the post-Covid effects, it appears that sustained higher GDP growth is needed to significantly increase the employable population.
Figure 3: US Labour Force vs US GDP
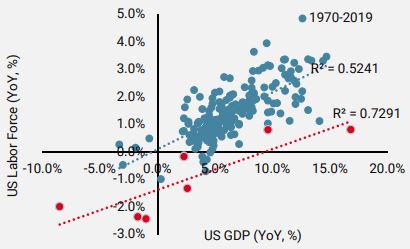
Source: Unigestion, BLS, Bloomberg as of 31.10.2021.
Moreover, the recent study by the San Francisco Fed highlights the extent to which disparities between sectors and regions have grown after Covid. These shifts in sensitivity between activity and employment could delay full employment and the start of the rate hike cycle, especially if headline and core inflation begin to fall.
Conundrum 2.0
We therefore believe that the expected rise in nominal and real interest rates for 2022, and justified by the historical relationship between inflation and growth premiums and bond yields, could be much more limited than the current pricing of the forward US curve suggests. Figure 4 shows how much the US 10-year yield has become disconnected from cyclical fundamentals, similar to the Greenspan conundrum back around 2005, where US long rates depended more on the Chinese surplus than on US activity.
Figure 4: US Inflation vs US 10Y Bond yield
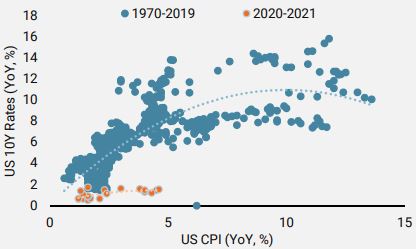
Source: Unigestion, BLS, Bloomberg as of the 31.10.2021.
Unigestion Nowcasting
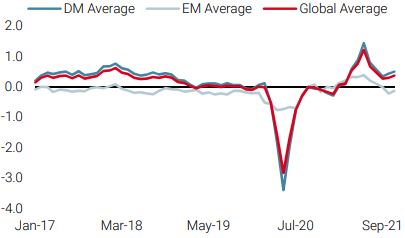
World Growth Nowcaster
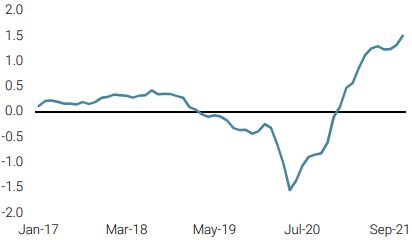
World Inflation Nowcaster
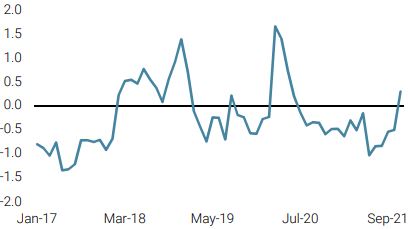
Market Stress Nowcaster
Weekly Change
- Last week, our World Growth Nowcaster improved modestly, largely due to better data out of the US.
- Our World Inflation Nowcaster moved slightly higher as inflation pressures in the emerging world continue to build.
- Our Market Stress Nowcaster, which had been declining earlier in the week, shot up due to higher market volatilities on Friday.
Sources: Unigestion, Bloomberg, as of 26 November 2021.
Important Information
This document is provided to you on a confidential basis and must not be distributed, published, reproduced or disclosed, in whole or part, to any other person.
The information and data presented in this document may discuss general market activity or industry trends but is not intended to be relied upon as a forecast, research or investment advice. It is not a financial promotion and represents no offer, solicitation or recommendation of any kind, to invest in the strategies or in the investment vehicles it refers to. Some of the investment strategies described or alluded to herein may be construed as high risk and not readily realisable investments, which may experience substantial and sudden losses including total loss of investment.
The investment views, economic and market opinions or analysis expressed in this document present Unigestion’s judgement as at the date of publication without regard to the date on which you may access the information. There is no guarantee that these views and opinions expressed will be correct nor do they purport to be a complete description of the securities, markets and developments referred to in it. All information provided here is subject to change without notice. To the extent that this report contains statements about the future, such statements are forward-looking and subject to a number of risks and uncertainties, including, but not limited to, the impact of competitive products, market acceptance risks and other risks.
Data and graphical information herein are for information only and may have been derived from third party sources. Although we believe that the information obtained from public and third party sources to be reliable, we have not independently verified it and we therefore cannot guarantee its accuracy or completeness. As a result, no representation or warranty, expressed or implied, is or will be made by Unigestion in this respect and no responsibility or liability is or will be accepted. Unless otherwise stated, source is Unigestion. Past performance is not a guide to future performance. All investments contain risks, including total loss for the investor.
Unigestion SA is authorised and regulated by the Swiss Financial Market Supervisory Authority (FINMA). Unigestion (UK) Ltd. is authorised and regulated by the UK Financial Conduct Authority (FCA) and is registered with the Securities and Exchange Commission (SEC). Unigestion Asset Management (France) S.A. is authorised and regulated by the French “Autorité des Marchés Financiers” (AMF). Unigestion Asset Management (Canada) Inc., with offices in Toronto and Montreal, is registered as a portfolio manager and/or exempt market dealer in nine provinces across Canada and also as an investment fund manager in Ontario and Quebec. Its principal regulator is the Ontario Securities Commission (OSC). Unigestion Asset Management (Copenhagen) is co-regulated by the “Autorité des Marchés Financiers” (AMF) and the “Danish Financial Supervisory Authority” (DFSA). Unigestion Asset Management (Düsseldorf) SA is co-regulated by the “Autorité des Marchés Financiers” (AMF) and the “Bundesanstalt für Finanzdienstleistungsaufsicht” (BAFIN).