The Trade War Has Hit Emerging Market Equities Hardest
Thus far, the trade war has weighed on emerging equities more than on developed ones.
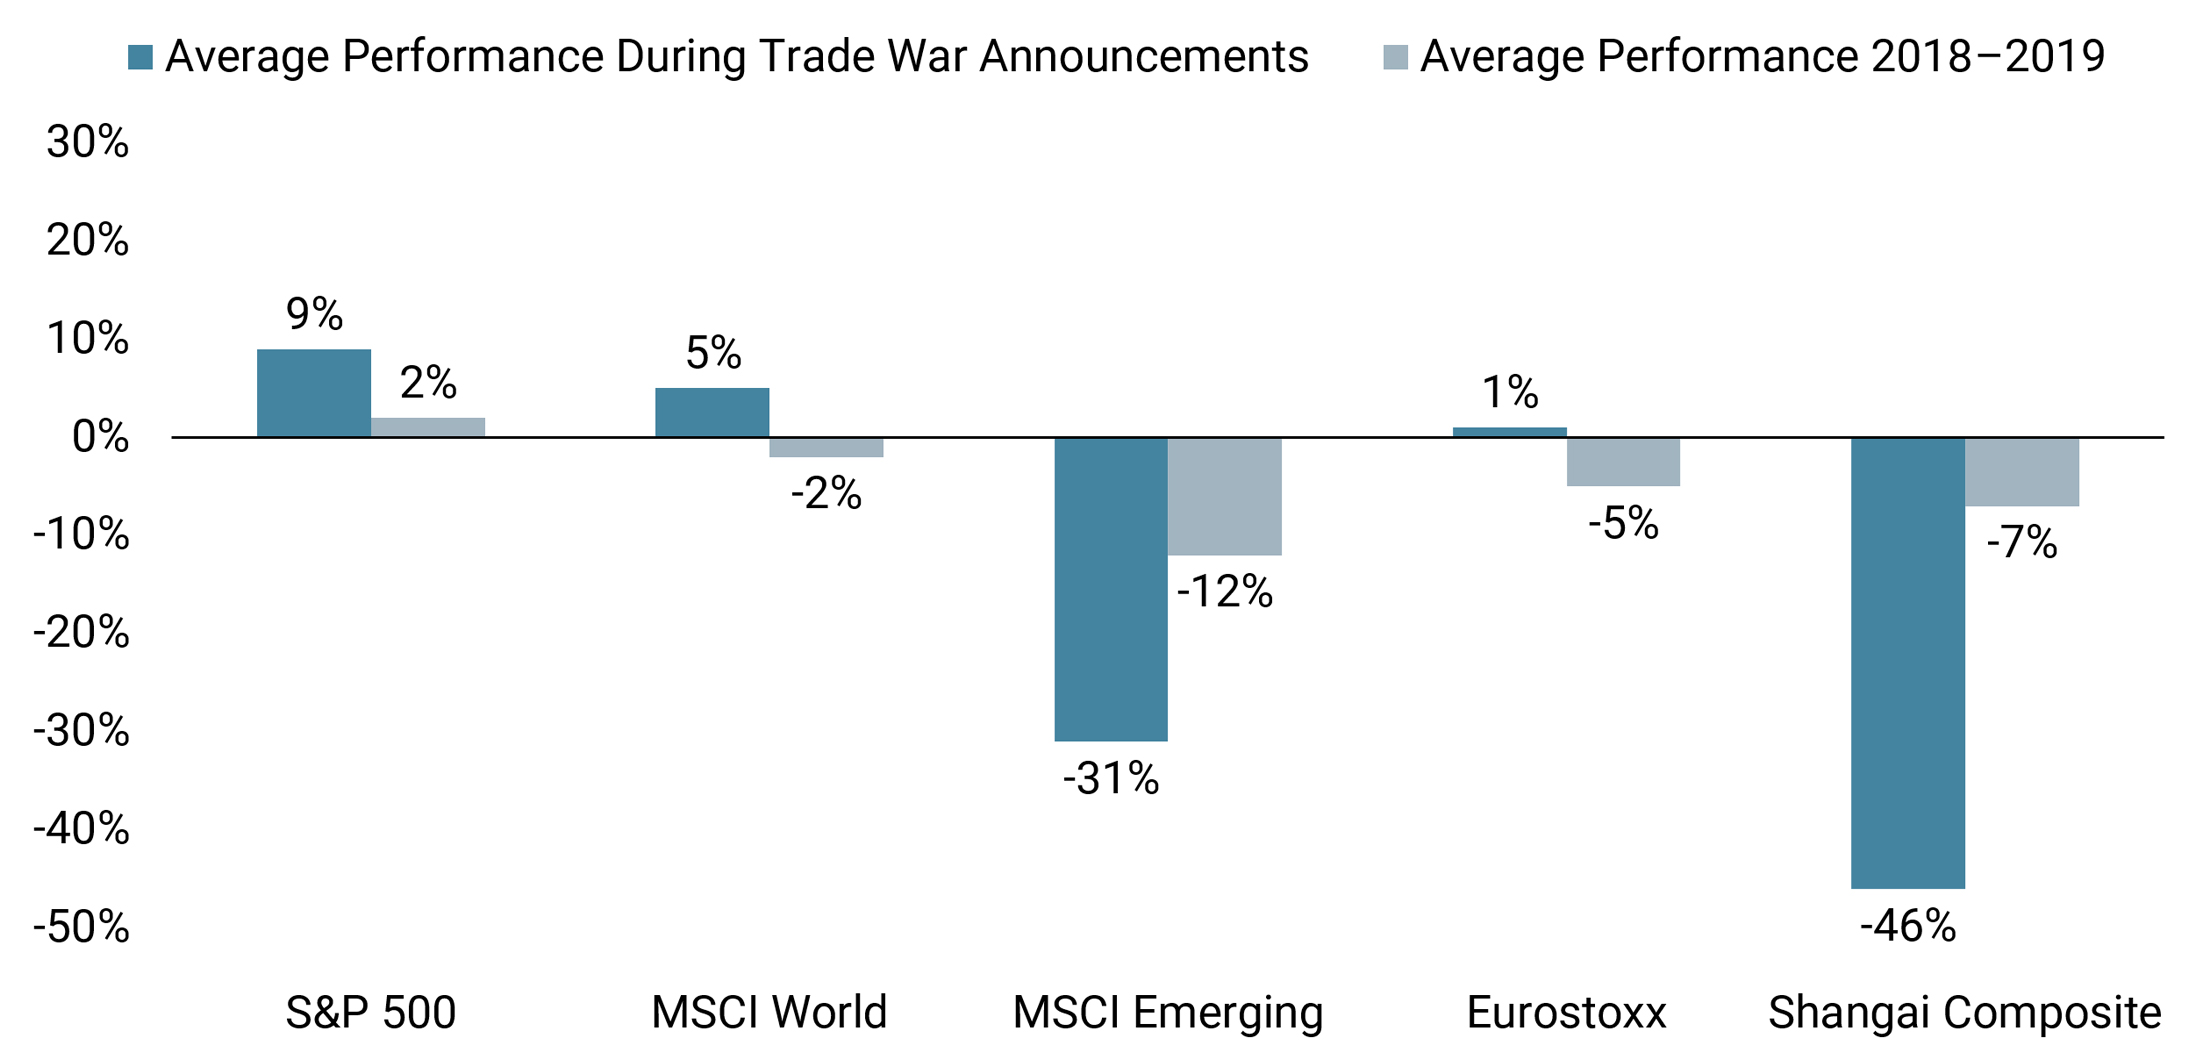
The chart below shows the annualised average performance of major indices over the period 2018-2019, taking only days following negative trade war-related announcements (dark blue) versus the annualised overall performance of each index over the same period (grey).
The chart takes into account 25 days of negative trade-related newsflow. Key dates include March 1 when President Trump announced forthcoming tariffs on all trading partners of 25% on steel and 10% on aluminium and China’s announcement of retaliatory tariffs on April 2. Another key date is April 3, when the Trump administration released a USD 50 billion list of 1,333 Chinese products under consideration for 25% tariffs. Also notable is May 5, when, in a sudden reversal during the US-China trade negotiations, President Trump tweeted (later officially confirmed) that the US would increase the 10% tariff on USD 200 billion of imports from China to 25%
Emerging assets have had a rough year so far, hitting a year-to-date high of 14% in April, and declining by about 10% since then: a volatile year by any standards. The macro picture for emerging economies, without being excellent, remains positive overall, but there are significant risks, including trade war escalation. Since 2018, days with negative trade war announcements led emerging equities to underperform their developed counterparts by about 20 basis points per day. The valuation of emerging equities may look cheap, but when looking at it from different angles, the overall impression is that their pricing is fair: with a forward PE at 10.5 (and a 2008-2019 average of 10), valuation risk is not off the table.
Important Information
The information and data presented in this page may discuss general market activity or industry trends but is not intended to be relied upon as a forecast, research or investment advice. It is not a financial promotion and represents no offer, solicitation or recommendation of any kind, to invest in the strategies or in the investment vehicles it refers to. Some of the investment strategies described or alluded to herein may be construed as high risk and not readily realisable investments, which may experience substantial and sudden losses including total loss of investment.
The investment views, economic and market opinions or analysis expressed in this page present Unigestion’s judgement as at the date of publication without regard to the date on which you may access the information. There is no guarantee that these views and opinions expressed will be correct nor do they purport to be a complete description of the securities, markets and developments referred to in it. All information provided here is subject to change without notice. To the extent that this page contains statements about the future, such statements are forward-looking and subject to a number of risks and uncertainties, including, but not limited to, the impact of competitive products, market acceptance risks and other risks.
Data and graphical information herein are for information only and may have been derived from third party sources. Although we believe that the information obtained from public and third party sources to be reliable, we have not independently verified it and we therefore cannot guarantee its accuracy or completeness. As a result, no representation or warranty, expressed or implied, is or will be made by Unigestion in this respect and no responsibility or liability is or will be accepted. Unless otherwise stated, source is Unigestion.
Past performance is not a guide to future performance. All investments contain risks, including total loss for the investor.