Global equities continued to rally in May even after the historic returns seen in April. Consequently, the recovery of risky assets, like their decline, has become one of the sharpest in history, spanning just four weeks and confirming our initial view that “this time is different”. Last month, we cited the “Fed game changer” and cautiousness in investor positioning to justify the shift in our tactical allocation from cautiousness to selective growth-oriented tilts. After two consecutive months of positive returns in risky assets despite a considerable deterioration in fundamentals, the key question for us now is: how long can the rally continue? The current consensus can be summarised as follows: this macroeconomic shock is one of the biggest since the Great Depression and equity markets, mainly US ones, seem disconnected from the real economy, expensive and “at risk” for shareholders. Overall, we tend to disagree with this view as we are seeing three turning points in 1) the macro dynamic, 2) investor positioning, and 3) asset valuations that together could trigger a breakout in risky assets.Three Key Turning Points Could Extend The Rally

Squeeze The Trigger

Although we share the consensus view regarding deteriorated fundamentals, as illustrated by the historic fall in our Growth Nowcasters, we believe that, contrary to historic recessions, the current decline in activity could be short-lived and shorter than the expectations of economists and institutions. Firstly, it results from an exogenous shock and not from an imbalance in either supply or demand. Consequently, it should be easier to repair than a typical recession where the rebalancing process takes times. Secondly, the policy support has been extraordinary, combining size, scope, speed of delivery and breadth in terms of the number of countries implementing it. As an illustration, the Fed balance sheet now exceeds USD 7tn and could reach USD 15tn at the end of the year if the current path is maintained. This potential increase in its balance sheet would represent 50% of US GDP compared to less than 8% of US GDP injected between 2008 and 2012. We think that this, combined with extraordinary fiscal stimulus globally, will offset a significant part of the negative effects of the global lockdown. Similarly, the situation in Europe also bodes well for the future as the first European bonds could be issued to support the European economy. As a result, and with the end of the lockdown and the re-opening of key economies remaining on track, the odds of a V-shaped scenario seem to be higher than previously expected. In light of this, the dynamic of macro data matters more than the level of fundamentals. Although they are still large and remain in unchartered territory, US continuing claims declined last week for the first time since the crisis. This positive dynamic is illustrated by our proprietary Nowcaster indicators, which are specifically designed to monitor the real economy in real time through macro data and news. The diffusion indices of our Nowcasters, which indicate the proportion of improving data to deteriorating data, bottomed in May, implying that the second derivative was turning positive. Similarly, our Newscaster has recovered sharply, almost to positive territory and up from very depressed levels. Both elements would justify a repricing of fundamentals and trigger a reflation in growth-oriented assets in the coming months. The rally observed since the bottom in mid-March has been driven by technical factors, not fundamental ones. It was triggered firstly by the short covering of futures that investors had used instead of options due to the expensiveness of protection costs linked to the high level of implied volatility and the inverted VIX forward curve. At the end of March and the beginning of April, futures referencing equity indices such as the Euro Stoxx 600 and S&P 500 were jumping but their open interests were declining, confirming the short squeeze effect. Secondly, the breadth of the rebound has been very limited, as illustrated by the large dispersion across sectors, styles and countries. At the end of May, less than 40% of S&P 500 companies were above their 200-day moving average. This number was less than 20% for Euro Stoxx 600 companies and less than 10% for the US Energy sector, versus more than 70% for US Healthcare. Finally, investor participation has been limited, as reflected by the low beta-to-equity of liquid and flexible hedge fund strategies that we track on a weekly basis. The current beta for CTA and risk parity strategies is still in the last quintile of distribution due to the high level of realised volatility and negative past performance. Cautiousness is also well reflected in asset pricing. Gold, sovereign bond yields, equity performance outside of Healthcare and Technology are all singing the same song: “We do not believe in a V-shaped recovery”. This is exactly why we think investor positioning could change dramatically. “Good news” or at least “the end of the negative trend” are not priced in at all for most financial assets. More importantly, this shift could be amplified by technical elements. If the current trend continues, normalisation in the VIX curve from backwardation to contango, tightening in the funding spread and the 12, 6 and 3-month performances of risky assets will trigger a large re-risking of systematic strategies and create the upward breakout required to change market sentiment from “cash is king” into “fear of missing the rally”. Moreover, cash positions are at record highs, improving both the horizon and the risk-reward of the re-risking trade. The rally observed in April and the first weeks of May was purely technical but a large reversal in market sentiment will have more consequences in terms of asset performance. We expect that defensive assets that are close to their highs such as Gold, sovereign bonds and defensive FX will be more negatively affected than in the recent past. In contrast, the sentiment reversal will support cyclical assets more, such as emerging assets (FX, credit and equities), cyclical commodities and laggards such as the Financial sector, small caps or European equities. Is this potential rotation a risk for our tactical tilt toward quality indices such as the SMI and Nasdaq? We have analysed the performance of the US market (S&P 500) following a large rotation, defined as outperformance of the Russell 2000 versus the Nasdaq by more than one sigma. Since 1990, this has happened 8% of the time. Our results show an average six-month performance of 4.5% following such a rotation (excluding the 2000-2002 bubble burst period). More importantly, 14 out of 15 cases show a positive return with the only negative six-month return happening after September 2008. Excluding this episode gives an average six-month return of 7.5% for the S&P 500. It means that rotation is good for equity markets overall and will benefit all sectors and styles, including our preferred indices, the Nasdaq and SMI. Aggregated forward P/E ratios for equities paint a clear picture: high valuations are everywhere with most developed market indices trading in their 99th percentile, except Japanese ones, and higher P/E ratios compared to previous periods of declining activity. Nevertheless, there are different ways to analyse these numbers. Firstly and more importantly, it does not take into account the level of the discount factor. Given the amplitude of the changes in both spot and forward interest rates over the period, this element strongly mitigates the signal from simple P/E metrics. Two clear examples illustrate this point. A cross-sectional carry analysis (Fed model) that compares current bond yields with earning yields currently indicates a high level of attractiveness in both developed and emerging market equities. Moreover, low bond yields lowers the cost of debt, affecting current and future profitability. Consequently, the ability to maintain earnings growth, or to limit its decline due to lower demand, is supported when interest rates are at current, record lows. Therefore, comparing current P/E ratios with history could lead to an underestimation of these positive factors. The current consensus sees the concentration in US equity index as a sign of a bubble. At the end of April, our analysis shows that FAANG stocks represented 9% of the MSCI AC World market capitalisation but 10% of next-twelve-month earnings. Regarding past earnings and valuation metrics for Technology and Healthcare sectors, the main contributors of recent outperformance of US equities, both have exhibited exceptional resilience in sales growth and operating margins over recent years. The Technology sector has maintained an average gross margin of 21% since 2010 versus 13% for the S&P 500 while it and Healthcare have benefited from average growth in gross sales of 8.5% over the period versus 4.7% for the S&P 500. In our view, it seems difficult to see any bubble pricing currently. Moreover, in a context of rising political risks, we are convinced that these strengths will allow “quality” indices and sectors to outperform. As is often the case, elements beneath the surface matter more than the global picture. We believe that important elements could trigger a breakout to the upside in growth-oriented assets. That is the reason why we maintain our selective tilts toward growth-oriented assets in our dynamic allocation.What’s Next?
At the macro level, the worst seems behind us…
…. but investors are still cautious
…creating room for upside surprise
Is valuation an issue?
Unigestion Nowcasting
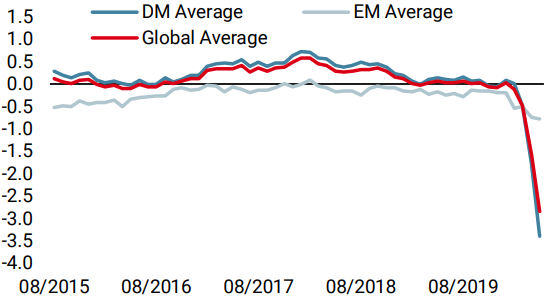
World Growth Nowcaster
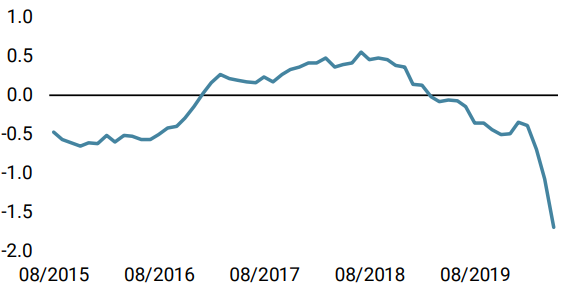
World Inflation Nowcaster
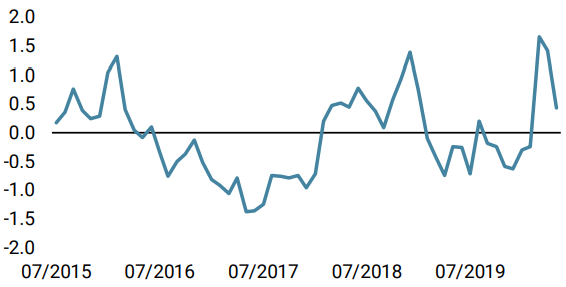
Market Stress Nowcaster
Weekly Change
- Our world Growth Nowcaster increased for the first time since the start of the COVID-19 crisis, led by an improvement in European data. Our indicator seems to signal the end of the deterioration in the macro data.
- Our world Inflation Nowcaster remained unchanged last week, still pointing to a very low inflation risk. As in the case of our Growth Nowcaster, the percentage of rising data gives signs of early improvement.
- Our Market Stress Nowcaster decreased last week as credit spreads tightened and volatility receded.
Sources: Unigestion. Bloomberg, as of 01 June 2020.
Important Information
This document is provided to you on a confidential basis and must not be distributed, published, reproduced or disclosed, in whole or part, to any other person.
The information and data presented in this document may discuss general market activity or industry trends but is not intended to be relied upon as a forecast, research or investment advice. It is not a financial promotion and represents no offer, solicitation or recommendation of any kind, to invest in the strategies or in the investment vehicles it refers to. Some of the investment strategies described or alluded to herein may be construed as high risk and not readily realisable investments, which may experience substantial and sudden losses including total loss of investment.
The investment views, economic and market opinions or analysis expressed in this document present Unigestion’s judgement as at the date of publication without regard to the date on which you may access the information. There is no guarantee that these views and opinions expressed will be correct nor do they purport to be a complete description of the securities, markets and developments referred to in it. All information provided here is subject to change without notice. To the extent that this report contains statements about the future, such statements are forward-looking and subject to a number of risks and uncertainties, including, but not limited to, the impact of competitive products, market acceptance risks and other risks.
Data and graphical information herein are for information only and may have been derived from third party sources. Although we believe that the information obtained from public and third party sources to be reliable, we have not independently verified it and we therefore cannot guarantee its accuracy or completeness. As a result, no representation or warranty, expressed or implied, is or will be made by Unigestion in this respect and no responsibility or liability is or will be accepted. Unless otherwise stated, source is Unigestion. Past performance is not a guide to future performance. All investments contain risks, including total loss for the investor.
Unigestion SA is authorised and regulated by the Swiss Financial Market Supervisory Authority (FINMA). Unigestion (UK) Ltd. is authorised and regulated by the UK Financial Conduct Authority (FCA) and is registered with the Securities and Exchange Commission (SEC). Unigestion Asset Management (France) S.A. is authorised and regulated by the French “Autorité des Marchés Financiers” (AMF). Unigestion Asset Management (Canada) Inc., with offices in Toronto and Montreal, is registered as a portfolio manager and/or exempt market dealer in nine provinces across Canada and also as an investment fund manager in Ontario and Quebec. Its principal regulator is the Ontario Securities Commission (OSC). Unigestion Asia Pte Limited is authorised and regulated by the Monetary Authority of Singapore (MAS). Unigestion Asset Management (Copenhagen) is co-regulated by the “Autorité des Marchés Financiers” (AMF) and the “Danish Financial Supervisory Authority” (DFSA). Unigestion Asset Management (Düsseldorf) SA is co-regulated by the “Autorité des Marchés Financiers” (AMF) and the “Bundesanstalt für Finanzdienstleistungsaufsicht” (BAFIN).