The COVID-19 recession seems to be just a technical one, raising questions about the deflation phase that usually follows a recession. In our view, the V-shaped recovery that we expect on the growth front, the steady wage growth throughout the crisis and the still-decent core inflation growth rate point to higher – but moderate – inflation in the near future. At this stage, we have eliminated most of our underweight to inflation-hedging (‘real’) assets to adapt our portfolios to this evolving dimension, but our residual underweight reflects their expensiveness. For us, this is another step towards investing in a broader market recovery.Time to End the Underweight to Real Assets

Inflation Blues

In a normal recession, two deflationary forces typically start acting on the economy: one directly through commodities that weigh on headline inflation figures, and one indirectly as slowed activity increases production slack and lowers wage growth, inducing pervasive deflationary pressures. Is this time different? First, the direct commodity impact: the rapid collapse in commodity demand – from the industry side first and then reflecting final demand – has led to a rapid decline in commodity prices. WTI prices lost 52% while industrial metals broadly dropped by 24%. These numbers are significant but not as impressive as those during the GFC. In 2008, the peak-to-bottom drop in oil prices was about 70%, and 64% for industrial metals. 2020’s decline sits in between those of 2008 and 2001: it has been intense but shorter than the GFC’s extended demand contraction. In the near term, this should impact headline inflation indices first. A second impact could follow, given the historical 18-month feedback mechanism from commodity prices to core inflation. A large decline in commodity prices can therefore have a longer lasting impact on core inflation itself. However, due to the temporary nature of the current contraction, this effect should not be as strong as usual; in fact, one might even expect it to be marginal. Oil prices have already recovered partially: in the coming months, they should contribute positively again. It is the same story in industrial metal markets: the lower inflation headline figures we are currently seeing (+0.1% year-on-year US inflation) are probably not here to stay. The second consequence is that, with a contraction in global demand, production capacity has declined materially. In the US, the economy’s capacity utilisation rate fell to 64% in April with a timid uptick to 64.8% in May. The same figure in the Eurozone reached 69.7%, but with some disparity: this rate ranges from 56.7% for Ireland to 77% for Finland. This considerable economic slack is usually a tell for declining inflation ahead: over the longer run, the strength of the underlying economy, particularly the growth rate of wages, is closely linked to the growth rate of prices, according to economic theory. The overall cautiousness of companies, the large temporary lay-off programmes and the uncertainty stemming from the uniqueness of the current situation makes the macro side of inflation uncertain. These two effects would apply in the case of a “normal” recession, i.e., a recession that comes from the economy itself, not from the fact that somebody simply hit the “stop” bottom in March. As the world economy’s engine reignites, we think it is essential to pay attention to the dynamic of inflation. Here, we see two dynamic evolutions and a missing piece in this deflation puzzle. First, the missing piece: to be able to call clear-cut deflation, one would need wage growth to stumble. In the US for example, the Atlanta Fed wage growth indicator – one of the most reliable wage growth trackers in the US – has remained around 3.5% for workers who have remained in employment. This is a significant longer-term driver of inflation and it should remain a positive force for inflation in the near future. Monitoring the decrease in unemployment rates will therefore be key to keeping track of this reflation evolution. Second, and as communicated earlier, we are expecting a V-shaped recovery. This view is substantiated by the recent evolution of our Growth Newscaster and Nowcaster indicators. The growth data is now firmly showing signs of improvement, with 59% of the data rising across both indicators versus 25% in late April. That macro improvement should continue to animate commodity markets: since the beginning of the COVID-19 crisis, the energy market has recovered globally by 43% while industrial metals have improved by 15%. Also, the economic sectors showing the most rapid recovery are, unsurprisingly, durable and non-durable consumption, especially in the US. Here again, growth forces should act against the economic slack. We are of the belief that the economic slack should be temporary. What makes us focus today on this reflation is the fact that these positive macro signals are now showing in our Inflation News- and Nowcasters. As in the case of growth, the diffusion indices of these inflation surprise-focused indicators have strongly recovered: inflation data bottomed on 18 May while news data started improving before then. We now see about 70% of data improving and, at least in the US, a broad-based contribution from the different dimensions of inflation. Finally, when looking at inflation data per se, the 1% year-on-year US core inflation hides a remarkable 6% medical care inflation and a 3% food inflation rate. Shelter has been losing a bit of momentum, but overall only the commodity-related inflation components have so far given signs of deflation. So what are the challenges of investing in this economic reflation? The key question here is how much of this reflation is already priced in. Inflation breakevens are a good indicator to assess how investors feel about the future course of inflation, reflecting the difference in yields between nominal and inflation-linked securities. During macroeconomic shocks and subsequent deflationary environments, breakevens tend to adjust rapidly to deteriorating inflation expectations. During the crisis, US short-term inflation breakevens dropped deep into negative territory for the first time since the GFC. The measure plunged from 1.3% to -1.3%, a clear signal that the investment world was pricing deflation for at least the next 12 months. At the same time, long-term breakevens dropped meaningfully too but in lower proportions than in the GFC (US 10y breakevens dropped by 1.16% in 2020 vs 1.80% in 2008). As with other macro-driven assets, the recovery has gained traction lately, and the pace of the rebound is somewhat comparable to the GFC for long-term breakevens, and faster for shorter-term tenors with the US 1y breakeven now almost back to pre-crisis levels. In terms of valuations, current pricing looks fairly expensive compared to realised inflation: core PCE, the Fed’s preferred measure, has receded to barely 1%, while expectations are now 1.25% for one year ahead, and 1.6% on average over a ten-year horizon. For now, this valuation element prevents us from becoming positive on real assets broadly: a similar case can be made for energy and industrial metals. Real assets have already recovered from a large portion of their drop while showing signs of being expensive through their carry: this lets us slightly underweight real assets for the moment. Our main dynamic allocation change so far has been to eliminate most of our short real assets conviction due to the macro recovery that is currently unfolding combined with the improvement in sentiment. To move this further, we would need to see more developments in the macro picture, as headwinds could weigh on an overweight to real assets in the near future such as the very high savings rate in the US – but we are not there yet.What’s Next?
The two typical deflationary forces
Reflation seems to be on its way
Breakevens look good but expensive, as do most real assets
Unigestion Nowcasting
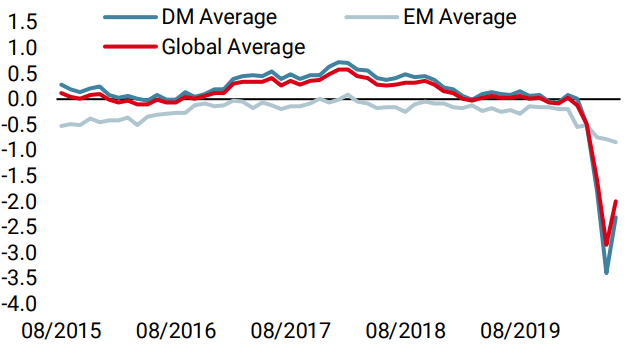
World Growth Nowcaster
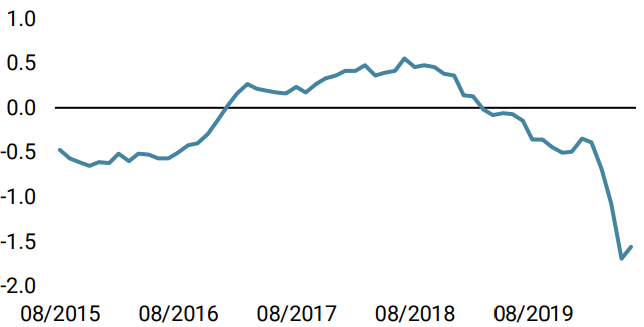
World Inflation Nowcaster
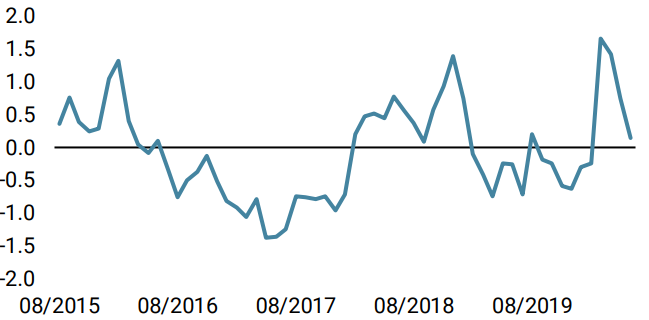
Market Stress Nowcaster
Weekly Change
- Our world Growth Nowcaster increased last week as US and Chinese data climbed to higher ground.
- Our world Inflation Nowcaster increased as well, mainly driven by US data.
- Our Market Stress Nowcaster fell last week, as liquidity, volatility and spreads decreased all together.
Sources: Unigestion. Bloomberg, as of 22 June 2020.
Important Information
This document is provided to you on a confidential basis and must not be distributed, published, reproduced or disclosed, in whole or part, to any other person.
The information and data presented in this document may discuss general market activity or industry trends but is not intended to be relied upon as a forecast, research or investment advice. It is not a financial promotion and represents no offer, solicitation or recommendation of any kind, to invest in the strategies or in the investment vehicles it refers to. Some of the investment strategies described or alluded to herein may be construed as high risk and not readily realisable investments, which may experience substantial and sudden losses including total loss of investment.
The investment views, economic and market opinions or analysis expressed in this document present Unigestion’s judgement as at the date of publication without regard to the date on which you may access the information. There is no guarantee that these views and opinions expressed will be correct nor do they purport to be a complete description of the securities, markets and developments referred to in it. All information provided here is subject to change without notice. To the extent that this report contains statements about the future, such statements are forward-looking and subject to a number of risks and uncertainties, including, but not limited to, the impact of competitive products, market acceptance risks and other risks.
Data and graphical information herein are for information only and may have been derived from third party sources. Although we believe that the information obtained from public and third party sources to be reliable, we have not independently verified it and we therefore cannot guarantee its accuracy or completeness. As a result, no representation or warranty, expressed or implied, is or will be made by Unigestion in this respect and no responsibility or liability is or will be accepted. Unless otherwise stated, source is Unigestion. Past performance is not a guide to future performance. All investments contain risks, including total loss for the investor.
Unigestion SA is authorised and regulated by the Swiss Financial Market Supervisory Authority (FINMA). Unigestion (UK) Ltd. is authorised and regulated by the UK Financial Conduct Authority (FCA) and is registered with the Securities and Exchange Commission (SEC). Unigestion Asset Management (France) S.A. is authorised and regulated by the French “Autorité des Marchés Financiers” (AMF). Unigestion Asset Management (Canada) Inc., with offices in Toronto and Montreal, is registered as a portfolio manager and/or exempt market dealer in nine provinces across Canada and also as an investment fund manager in Ontario and Quebec. Its principal regulator is the Ontario Securities Commission (OSC). Unigestion Asia Pte Limited is authorised and regulated by the Monetary Authority of Singapore (MAS). Unigestion Asset Management (Copenhagen) is co-regulated by the “Autorité des Marchés Financiers” (AMF) and the “Danish Financial Supervisory Authority” (DFSA). Unigestion Asset Management (Düsseldorf) SA is co-regulated by the “Autorité des Marchés Financiers” (AMF) and the “Bundesanstalt für Finanzdienstleistungsaufsicht” (BAFIN).