With the resurgence of risk aversion, as witnessed by the sharp falls in equity indices since the beginning of September, the US Dollar appreciated significantly against all emerging and developed currencies. Is this strengthening of the dollar temporary or does it mark the start of a new upward cycle? We believe that, unlike the 2011-2019 period that saw the trade-weighted dollar index appreciate by 37%, many tailwinds have disappeared or turned into headwinds, which makes the scenario of a stronger dollar in the medium term very unlikely.

Wild Is the Wind

Since March 23, 2020, the trade-weighted dollar has fallen by 9%. It is now back to where it was at the beginning of the year after hitting an all-time high during the February-March crisis. This decline was global, meaning that all currencies, except the Brazilian Real, the Ruble and the Turkish Lira appreciated against the greenback. It was also contained as this move occurred without a significant increase in currency volatility. This bearish dollar trend reversed in September following the sharp fall in US equity indices. The combination of profit-taking on the Nasdaq, which hit a new high on September 2, a lack of agreement on further fiscal support in the US, and inconsistent comments from Fed members on what the change in the inflation target meant led investors to significantly reduce their exposure to the best performing assets since March. This “derisking” movement has affected US indices more than European and Japanese indices, Momentum and Quality factors more than the Value factor and the Technology sector more than other sectors. As an example, the MSCI World equal weighted is down 3.8% since the beginning of the month against -6% for the MSCI World market cap. This reversal has also affected currencies. Since the beginning of September, the US currency has risen by 5% against the Australian dollar, 8.8% against the Norwegian krona, 4.7% against the British pound, 2.6% against the Euro and 5.2% against the Swedish krona. It is interesting to note that the magnitude of the dollar’s rise is, for the time being, much more moderate against the major emerging currencies with a drop of only 1.2% for the ZAR, 3.3% for the Mexican peso or 1.3% for the Singapore dollar. The Yuan actually remained stable against the dollar in September. This last point shows that the current moves are rather linked to technical factors such as positioning than to a more significant adjustment of growth or inflation premiums. Consequently, we continue to believe that macro and micro economic fundamentals remain favourable for risky assets and expect global equity indices to be higher at the end of 2020 than their current levels. As for the US dollar, we are instead betting on a gradual weakening, reflecting a significant change in the factors that have structurally supported the currency over the last economic cycle. Historically, the US dollar has benefited from three important factors: 1) Higher real growth than other G10 countries. IMF data shows that since 1990, the US economy has grown on average 0.9% per year more in real terms than the other G10 countries. 2) A central bank recognised as the most flexible and credible in maintaining economic growth and financial stability. This element has been key during last financial crisis to alleviate funding issues via FX swap lines programs. 3) A highly developed capital market that allows American companies to grow and innovate with moderate funding costs. The liquidity element means that the greenback remains the ultimate safe haven currency. For several decades, these three major pillars have offered foreign investors an attractive mix: 1) a better absolute return thanks to economic dynamism, 2) a particularly wide and liquid choice of assets to invest in, and 3) moderate risk thanks to the “Fed put”. These elements have significantly supported the greenback, have enabled US debt to be financed at a moderate cost (“savings glut”), and explain why US growth assets have outperformed European, Japanese or emerging ones since 1990. However, since 2008 and the implementation of Quantitative Easing, the link between currency directionality and economic fundamentals has weakened somewhat. At present, it is the size of the central bank balance sheet and thus the incremental change in the relative stock of money that matters. Broadly speaking, the larger the balance sheet increase, the more likely the associated currency will weaken. We have seen this in 2010 for the greenback, in 2012 for the Yen and in 2015 for the Euro when the Fed, BoJ and ECB respectively massively increased their balance sheets in absolute and relative terms compared to other central banks, through the purchase of assets. The dollar’s rise between 2012 and 2020 was mainly driven by many central banks following the Fed in its monetary support policy, either by implementing negative rates or by expanding their balance sheet. By doing so, the BoJ, ECB and other major central banks reduced their “advantages” in terms of carry and relative quantity of money vis-à-vis the greenback. Implementing an aggressive policy mix in 2020 to support the world economy could prove to be a “game changer” for the dollar, since it will find itself, as in 2009/2010, with: 1) An inflated Fed balance sheet. As an example, the Fed’s balance sheet increased by 14% of GDP over the last 6 months to reach 34% of GDP. 2) A debt increased by the major stimulus put in place by the US administration. The latest projection of the Congressional Budget Office anticipates a federal debt of 98% of GDP at the end of 2020 and 107% of GDP in 2023 against 79% at the end of 2019. The last time the US debt exceeded 100% was in 1946 after the reconstruction efforts related to the Second World War. 3) Very negative real rates resulting from the fall in short rates to zero, which occurred in February and March 2020, and the purchase of assets that keep long rates low. Currently, US 10 year real rates stand at -0.7% vs 0.4% for Canada and 1% for Australia. We believe that this unfavorable situation for the US currency should last at least for the next 24 months and could even worsen after the US elections through the implementation of a new stimulus plan and a further expansion of the Fed’s balance sheet to keep long rates low. Moreover, a contested election could also be a large negative headwind for the US dollar, given the uncertainty it would create for US assets. In addition, the still active threat of a “trade war” with China to maintain technological leadership could lead many countries – first and foremost China – to further diversify its foreign exchange reserves and thus weigh on capital flows, which support the greenback. The magnitude of the global lockdown shock has led developed countries and some emerging countries to relinquish control over their public finances and thus significantly increase their debts. In order to limit its cost and reduce the credit risk that rising debt entails, central banks have simultaneously increased their balance sheets to keep long-term interest rates at sustainable levels. In doing so, a large majority of countries have “Japanized” themselves. While Japan and Europe accept the corollary of this situation, i.e. low growth for longer, it is not certain that the US social system can absorb the effects of near-zero growth for years to come as is the case in Japan and Europe. One solution to avoid this would be to create growth by constantly increasing the debt that would be bought back by the Fed. In this framework, the credibility of the Fed could be questioned and the dollar could be used as an adjustment variable. We would then move from the “Japanization” to the “Emerginazion” of the US policy-mix. In this context, inflation would be the number one risk and the dollar would see its volatility increase significantly, affecting its status as a reserve currency.What’s Next?
Technical short-term reversal…
… or persistent dollar weakness?
The “debt trap” – the worst risk for the greenback?
Unigestion Nowcasting
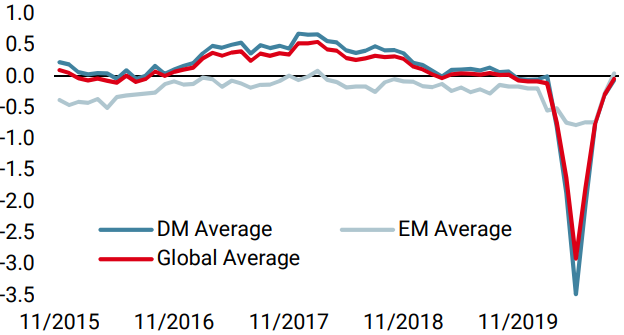
World Growth Nowcaster
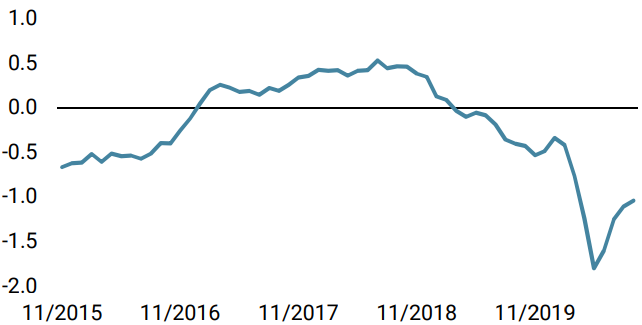
World Inflation Nowcaster
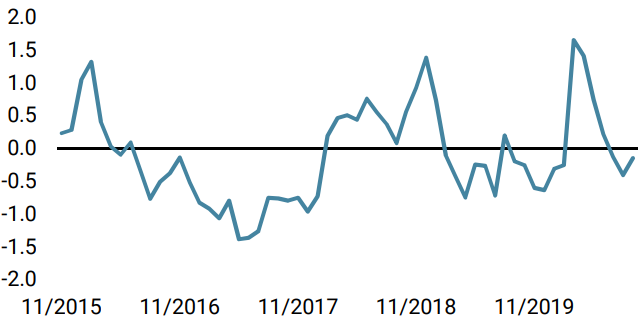
Market Stress Nowcaster
Weekly Change
- Our World Growth Nowcaster remained stable last week, as US data retreated while the Eurozone and various emerging economies showed further improvement.
- Our World Inflation Nowcaster declined marginally across most countries we track: the risk of an inflation surprise is still low.
- Last week, our Market Stress Nowcaster rose, with volatility and spreads pointing to a higher risk level.
Sources: Unigestion. Bloomberg, as of 25 September 2020.
Important Information
This document is provided to you on a confidential basis and must not be distributed, published, reproduced or disclosed, in whole or part, to any other person.
The information and data presented in this document may discuss general market activity or industry trends but is not intended to be relied upon as a forecast, research or investment advice. It is not a financial promotion and represents no offer, solicitation or recommendation of any kind, to invest in the strategies or in the investment vehicles it refers to. Some of the investment strategies described or alluded to herein may be construed as high risk and not readily realisable investments, which may experience substantial and sudden losses including total loss of investment.
The investment views, economic and market opinions or analysis expressed in this document present Unigestion’s judgement as at the date of publication without regard to the date on which you may access the information. There is no guarantee that these views and opinions expressed will be correct nor do they purport to be a complete description of the securities, markets and developments referred to in it. All information provided here is subject to change without notice. To the extent that this report contains statements about the future, such statements are forward-looking and subject to a number of risks and uncertainties, including, but not limited to, the impact of competitive products, market acceptance risks and other risks.
Data and graphical information herein are for information only and may have been derived from third party sources. Although we believe that the information obtained from public and third party sources to be reliable, we have not independently verified it and we therefore cannot guarantee its accuracy or completeness. As a result, no representation or warranty, expressed or implied, is or will be made by Unigestion in this respect and no responsibility or liability is or will be accepted. Unless otherwise stated, source is Unigestion. Past performance is not a guide to future performance. All investments contain risks, including total loss for the investor.
Unigestion SA is authorised and regulated by the Swiss Financial Market Supervisory Authority (FINMA). Unigestion (UK) Ltd. is authorised and regulated by the UK Financial Conduct Authority (FCA) and is registered with the Securities and Exchange Commission (SEC). Unigestion Asset Management (France) S.A. is authorised and regulated by the French “Autorité des Marchés Financiers” (AMF). Unigestion Asset Management (Canada) Inc., with offices in Toronto and Montreal, is registered as a portfolio manager and/or exempt market dealer in nine provinces across Canada and also as an investment fund manager in Ontario and Quebec. Its principal regulator is the Ontario Securities Commission (OSC). Unigestion Asia Pte Limited is authorised and regulated by the Monetary Authority of Singapore (MAS). Unigestion Asset Management (Copenhagen) is co-regulated by the “Autorité des Marchés Financiers” (AMF) and the “Danish Financial Supervisory Authority” (DFSA). Unigestion Asset Management (Düsseldorf) SA is co-regulated by the “Autorité des Marchés Financiers” (AMF) and the “Bundesanstalt für Finanzdienstleistungsaufsicht” (BAFIN).