Using Derivatives To Improve Risk-Adjusted Equity Returns
Key Points
- Equity derivatives can help investors to protect their equity allocations against market downturns without having to significantly increase their exposure to cash.
- Before entering into hedging strategies, the first step to reducing the risk in equity investments is to invest in a risk-efficient portfolio.
- The optimal hedging portfolio involves finding the best trade-off between cost and efficiency at each roll-over date, typically through a combination of index futures.
- Defining a strategic hedge ratio can reduce market timing risk when hedging downturns.
- Using Nowcasters helps to navigate between a return and a risk objective by enabling dynamic adjustment of the hedge ratio.
Overview
At the tail end of a protracted cycle with equity markets setting new highs, how can investors protect their portfolio against equity downturns without forgoing long-term growth? In the short run, cash is always the safest asset, helping investors to manage their risk exposures and meet short-term liabilities. However, with interest rates remaining below inflation in most G10 currencies, a high cash allocation poses a major challenge for meeting long-term return objectives. Derivatives can help to overcome this problem by allowing investors to manage their risk exposures without increasing their cash allocation significantly.
In this paper, we focus on how to improve risk-adjusted equity returns by using an optimal hedging portfolio of futures combined with a low risk equity strategy.
Removing Unrewarded Risks
Before entering into a hedging strategy, the first step to reducing the risk in equity investments is to invest in a risk-efficient portfolio, in the form of minimum variance or low volatility portfolios. The aim of these strategies is to outperform market capitalisation-weighted indices by producing a portfolio designed to exhibit lower overall volatility than the broader market.
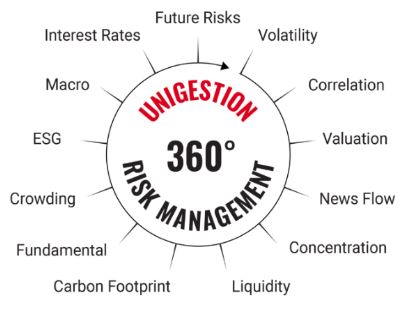
There are many pitfalls when relying solely on past volatility. However, a riskmanaged equity strategy follows a multi-disciplinary investment process that considers a wide spectrum of risks, taking a 360-degree view. It combines both rigorous systematic analysis with discretionary, forward-looking estimates of future downside risks, with the aim of delivering better downside protection. By aiming to reduce downside risks, risk-managed equity portfolios are not only more efficient from a standalone perspective, they also reduce the need for hedging and the associated cost.
Reducing Market Exposure with an Optimal Hedging Portfolio
Once unrewarded risks are removed, the residual market risk (beta) can be seen as truly undiversifiable. The next question is whether this market risk, which typically ranges between 0.6 and 0.8, is still appropriate given the investor’s specific risk budget. If we assume an expected shortfall for equities of 40%, a residual market exposure of 60% to 80% means a downside risk of between 24% and 32%. Investors who face tighter risk budgets should consider entering into a market risk hedging strategy using futures and options. Hedging an active equity portfolio by selling futures, instead of simply reducing the equity allocation, reduces market exposure but also maintains full outperformance potential. This allows for an improved riskadjusted return profile (Sharpe ratio) compared to a capitalisation-weighted index, such as the MSCI AC World index.

Hedging an active equity portfolio by selling futures, instead of simply reducing the equity allocation, reduces market exposure but also maintains full outperformance potential.

Hedging market risk with futures involves a trade-off between cost and effectiveness. The cost of hedging with futures reflects the slippage from holding and rolling the futures continuously. From a cost perspective, the most liquid indices, such as the S&P 500 and Euro Stoxx 50, tend to be the cheapest to roll, but what if the asset portfolio is very different from these indices? The most effective hedging portfolio corresponds to the maximum achievable correlation between the asset and hedge portfolios, but this can be expensive as, to ensure a high correlation, one may need to roll regional or sector indices with much wider spreads. The optimal hedging portfolio lies somewhere in between. In short, there is no optimal index and investors need to select the portfolio of index futures that exhibits the best trade-off at each roll-over date.
Reducing Timing Risk by Defining the Optimal Hedge Ratio
While tactical hedges may work well around known events, investors face significant timing risk when applying such tactics to hedging market downturns. To reduce this risk, one should first define the strategic hedge ratio. This is particularly important for active low risk strategies as a hedge ratio below 100% can already be excessive.
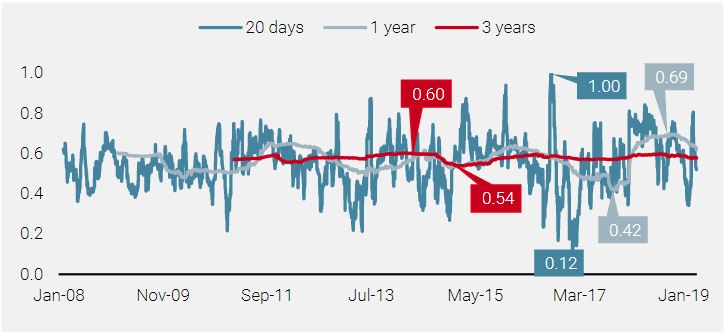
The minimum variance hedge ratio (MVHR), also known as the optimal hedge ratio, is nothing more than the beta of the hedged portfolio to the hedging portfolio. Even if the beta is broadly stable over the long run, it can vary significantly over a short period. Defining the hedge ratio dynamically is in fact a market timing problem. As shown in Figure 1, while the 20-day rolling beta ranges from 0.12 to 1.0, the long-term strategic MVHR is stable between 0.54 and 0.60. A time window of 3 to 5 years is therefore appropriate to define the strategic hedge ratio.
Figure 1: Rolling Beta vs Optimal Hedging Portfolio
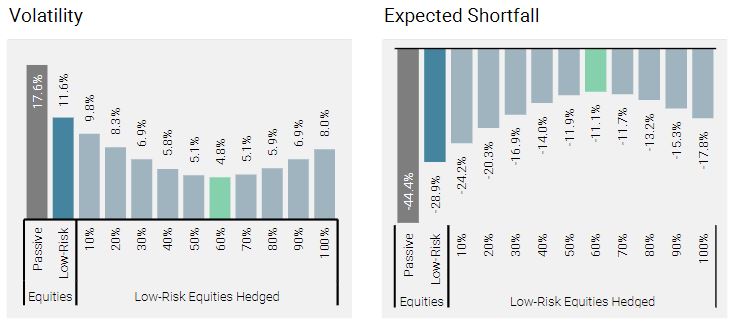
As its name implies, the MVHR is the hedge ratio that exhibits the lowest volatility once combined with the hedged portfolio and so is optimal from a risk perspective. The MVHR is robust in the sense that a 60% level is the minimum risk hedge ratio regardless of whether we consider average levels of risk (Volatility) or extreme ones (Expected Shortfall) (see Figure 2).
Figure 2: Risk and Return Statistics with Various Strategic Hedge Ratios
From a return perspective, it depends on the profile of the equity allocation. For low risk equity portfolios, which are usually overweight low risk and quality styles, outperformance tends to be concentrated around periods of high uncertainty, while risk-on markets are usually a source of underperformance, meaning that a hedged portfolio using MVHR can experience the worst drawdowns not only in bear markets but also during bull and mean-reverting markets.
For investors with a defensive equity portfolio, running a strategic under-hedging makes sense from a riskadjusted return perspective.
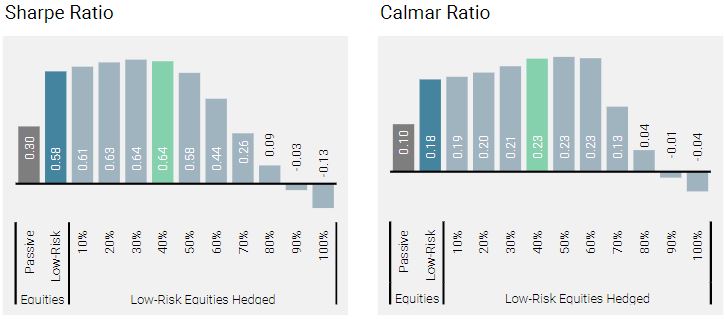
For investors with a defensive equity allocation, running a strategic under-hedging therefore makes sense from a risk-adjusted return perspective (see Figure 3). Starting from a 40% hedge ratio (i.e. under-hedged by 20%), the risk of the residual beta is more than offset by the performance behaviour of the excess return. Consequently, the “Maximum Sharpe Hedge Ratio” lies around 40%.
Figure 3: Return Risk and Return Statistics with Various Strategic Hedge Ratios
In brief, defining the strategic hedge ratio depends on both the investor’s objective and the style of the equity allocation. For investors with strict risk-targeting preferences, a strategic hedge ratio around the MVHR is appropriate. However, for investors looking to maximise risk-adjusted returns, a residual beta of between 0.2 and 0.3 is optimal.
Dynamic Hedge Ratio: A Macro-based Approach to Market Timing
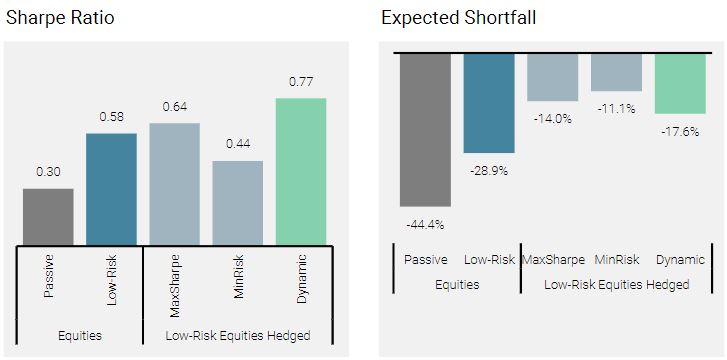
Market timing is a difficult exercise and should be implemented very cautiously, in particular when it relates to hedging. As a general principle, a dynamic hedging model (‘Dynamic’ in Figure 4) can help to navigate between a return and a risk objective, in our case between the Maximum Sharpe Hedge Ratio (MaxSharpe is 40%) and the Minimum Variance Hedge Ratio (MinRisk is 60%).
The more the economy is supportive for growth assets, the lower the hedge ratio can be reduced down to the MaxSharpe level. Conversely, if the economy is showing signs of recession, the higher it can be increased up to the MinRisk level.
To do this, investors can use macroeconomic nowcasters, which assess the current state of the economy in real time. The more the economy is supportive for growth assets, the lower the hedge ratio can be reduced down to the MaxSharpe level. Conversely, if the economy is showing signs of recession, the higher it can be increased up to the MinRisk level.
Figure 4: Risk and Return Statistics with Various Strategic Hedge Ratios
Conclusion
With equity markets at the tail end of a prolonged cycle, the risk of market stress episodes is increasing. There are a number of derivatives hedging strategies available to help investors manage their risk exposures and improve the risk-adjusted returns of their equity allocations. At Unigestion, we offer a range of hedging solutions that can be tailored to investors’ specific requirements.
Important Information
Past performance is no guide to the future, the value of investments, and the income from them change frequently, may fall as well as rise, there is no guarantee that your initial investment will be returned. This document has been prepared for your information only and must not be distributed, published, reproduced or disclosed by recipients to any other person. It is neither directed to, nor intended for distribution or use by, any person or entity who is a citizen or resident of, or domiciled or located in, any locality, state, country or jurisdiction where such distribution, publication, availability or use would be contrary to law or regulation. This is a promotional statement of our investment philosophy and services only in relation to the subject matter of this presentation. It constitutes neither investment advice nor recommendation. This document represents no offer, solicitation or suggestion of suitability to subscribe in the investment vehicles to which it refers. Any such offer to sell or solicitation of an offer to purchase shall be made only by formal offering documents, which include, among others, a confidential offering memorandum, limited partnership agreement (if applicable), investment management agreement (if applicable), operating agreement (if applicable), and related subscription documents (if applicable). Please contact your professional adviser/consultant before making an investment decision.
Where possible we aim to disclose the material risks pertinent to this document, and as such these should be noted on the individual document pages. The views expressed in this document do not purport to be a complete description of the securities, markets and developments referred to in it. Reference to specific securities should not be considered a recommendation to buy or sell. Investors shall conduct their own analysis of the risks (including any legal, regulatory, tax or other consequences) associated with an investment and should seek independent professional advice. Some of the investment strategies described or alluded to herein may be construed as high risk and not readily realisable investments, which may experience substantial and sudden losses including total loss of investment. These are not suitable for all types of investors.
To the extent that this report contains statements about the future, such statements are forward-looking and subject to a number of risks and uncertainties, including, but not limited to, the impact of competitive products, market acceptance risks and other risks. Actual results could differ materially from those in the forward-looking statements. As such, forward looking statements should not be relied upon for future returns. Targeted returns reflect subjective determinations by Unigestion based on a variety of factors, including, among others, internal modeling, investment strategy, prior performance of similar products (if any), volatility measures, risk tolerance and market conditions. Targeted returns are not intended to be actual performance and should not be relied upon as an indication of actual or future performance.
Data and graphical information herein are for information only and may have been derived from third party sources. Unigestion takes reasonable steps to verify, but does not guarantee, the accuracy and completeness of this information. As a result, no representation or warranty, expressed or implied, is or will be made by Unigestion in this respect and no responsibility or liability is or will be accepted. All information provided here is subject to change without notice. It should only be considered current as of the date of publication without regard to the date on which you may access the information. Rates of exchange may cause the value of investments to go up or down. An investment with Unigestion, like all investments, contains risks, including total loss for the investor.
Backtested or simulated performance is not an indicator of future actual results. The results reflect performance of a strategy not currently offered to any investor and do not represent returns that any investor actually attained. Backtested results are calculated by the retroactive application of a model constructed on the basis of historical data and based on assumptions integral to the model which may or may not be testable and are subject to losses.
Data set used for backtested simulations are all in USD, gross of management fees and net of estimated transaction costs, from 17.01.2008 to 31.03.2019. Passive Equities represents the MSCI All Country World Index TR Net in USD. Low-Risk Equities is a backtested simulation that replicates Unigestion’s expertise in managing risk-based equity strategies on an all country universe. Futures Hedge Portfolio represents a combination of Bloomberg generic futures on S&P 500, Euro STOXX 500 and TOPIX, in USD, gross of fees, net of estimated transaction costs. Options strategies represents backtested simulation in USD, gross of fees, net of estimated transaction costs using Morgan Stanley data.
Changes in these assumptions may have a material impact on the backtested returns presented. Certain assumptions have been made for modeling purposes and are unlikely to be realized. No representations and warranties are made as to the reasonableness of the assumptions. This information is provided for illustrative purposes only. Backtested performance is developed with the benefit of hindsight and has inherent limitations. Specifically, backtested results do not reflect actual trading or the effect of material economic and market factors on the decision-making process. Since trades have not actually been executed, results may have under- or over-compensated for the impact, if any, of certain market factors, such as lack of liquidity, and may not reflect the impact that certain economic or market factors may have had on the decision-making process. Further, backtesting allows the security selection methodology to be adjusted until past returns are maximized. Actual performance may differ significantly from backtested performance.
Unigestion (UK) Ltd. is authorised and regulated by the UK Financial Conduct Authority (FCA). It is also registered with the Securities and Exchange Commission (SEC). Unigestion SA is authorised and regulated by the Swiss Financial Market Supervisory Authority (FINMA). Unigestion Asset Management (France) S.A. is authorised and regulated by the French Autorité des Marchés Financiers (AMF). Unigestion Asset Management (Canada) Inc., with offices in Toronto and Montreal, is regulated in Canada by the securities regulatory authorities in Ontario, Quebec, Alberta, Manitoba, Saskatchewan, Nova Scotia, New Brunswick and British Columbia. Its principal regulator is the Ontario Securities Commission. Unigestion Asia Pte Limited is authorised and regulated by the Monetary Authority of Singapore.
Management fees and expenses all may be associated with investment funds. The indicated rates of return are gross of management fees and net of expenses and are the historical monthly compounded total returns including changes in unit value and reinvestment of all distributions but do not take into account possible sales or redemption charges or income taxes payable.