In July, the PBoC eased its monetary policy to support credit growth. This action is in sharp contrast to the direction taken by most developed and emerging market central banks, which are gradually reducing their monetary support, either by reducing of their balance sheets or via rate hikes. Indeed, more generally, in terms of fiscal, monetary, geopolitical and regulatory policy, China has recently diverged from the “aggressive policy mix” put in place by most countries to revive their economies following the health crisis. What are the consequences of this “isolationism”?

What’s The Difference

What’s Next?
Different policy mix …
The Covid-19 crisis significantly modified the “Washington consensus” which imposed 1) fiscal discipline, 2) a flexible monetary policy, and 3) liberalisation of economies, allowing for strong growth in trade and competition. To support their economies and to smooth the negative impact of lockdowns, most countries implemented unprecedented fiscal support of about 10% of GDP on average via public spending and huge investment programmes. These were typically supported by extremely accommodative monetary policy, combining low interest rates and liquidity injections via central bank balance sheet expansion. While China has participated in this paradigm shift, its current position diverges on two levels. First, from an historical perspective, its support has been much lower than that implemented in 2008 and 2015. Between 2015 and 2018, China’s debt increased from 40% of GDP to 53%, a 13% increase, whereas it only increased by 9.8% between 2019 and 2021 (compared to 18% for the US over the same period). Second, relative to the other G7 economies, the injection of liquidity into its economy was much weaker, as represented by the evolution of the growth rate of China’s M2 monetary base (Figure 1).
Figure 1: M2 Money Supply Growth (YoY, %)
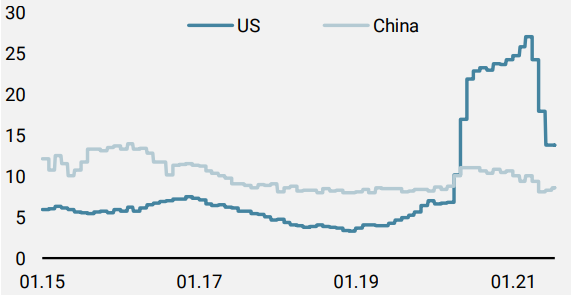
Source: Unigestion, Bloomberg, as of 16 July 2021.
This divergence in policy mix is taking place in a challenging geopolitical framework marked by trade war and data control. Recently, large companies in China’s technology sector have had to contend with a double layer of risk premia: on one hand, by changes in the regulation of ADRs for companies listed in the US, and on the other, by greater state control over the development of certain companies/sectors in China through stronger internal regulation. This last element largely explains the underperformance of Chinese equity indices and legitimises the premium demanded by investors over US technology counterparts.
…has led to divergences in macro momentum
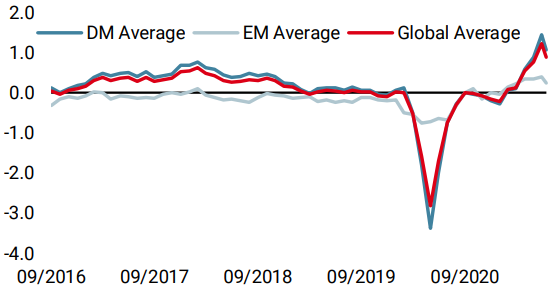
As highlighted by our Nowcasters (Figure 2), the Chinese economy is experiencing a clear deceleration versus a strong expansion in the major developed economies. While 2020 saw a cycle lag between China and the other economies, given that it was affected by the Covid-19 crisis first but recovered earlier, recent developments highlight that the lag has turned into a divergence.
Figure 2: Growth Nowcaster
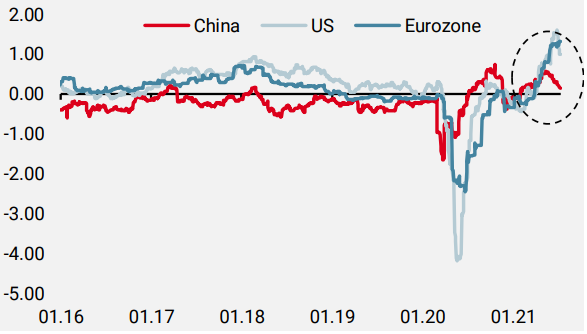
Source: Unigestion, Bloomberg, as of 16 July 2021.
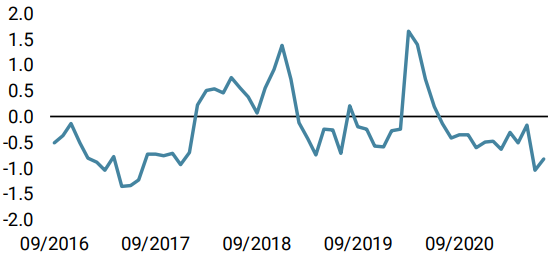
We observe the same pattern for our Chinese and US Inflation Nowcasters despite China’s greater sensitivity to rising commodity prices. The analysis of our Growth Nowcasters’ components between EM and DM countries highlights that this divergence touches all sectors and appears broad-based (Figure 3). Importantly, the “housing” sector, which is strongly supported in developed countries by the aggressive policy mix, is currently weak in emerging economies and in China. The slowdown observed in Chinese credit growth combined with the lack of a fiscal boost in major EM countries seems to be the key driver of this difference. The absence of a massive stimulus policy in these regions also has negative implications for corporate investment, as highlighted by the “Investment” component of our Nowcasters.
Figure 3: Growth Nowcaster by components
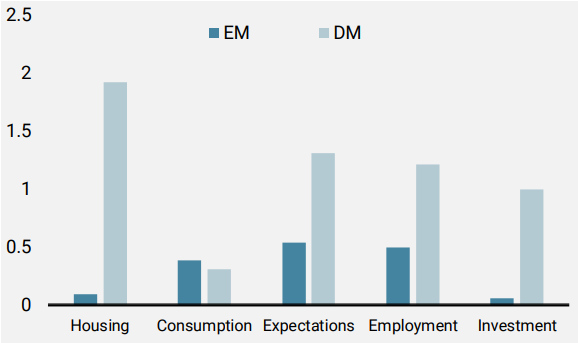
Source: Unigestion, Bloomberg, as of 16 July 2021.
Have Chinese equities become attractive?
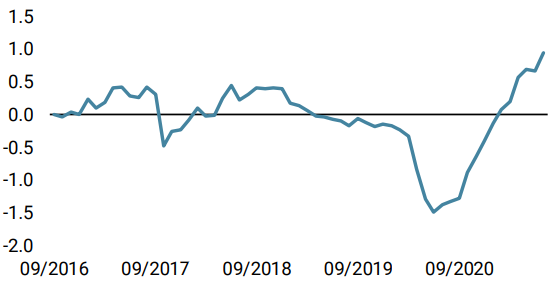
These economic, political and regulatory differences have led to a broad adjustment in risk premia for Chinese assets and mainly for Chinese equities in recent months. The “macro momentum gap”, represented by the difference in level between our Chinese and US Growth Nowcasters, stands currently in the 90th percentile over the last five years while the ratio between the MSCI US and MSCI China is in its 99th percentile (Figure 4).
Figure 4: Relative equity performance (MSCI US/MSCI China ratio)
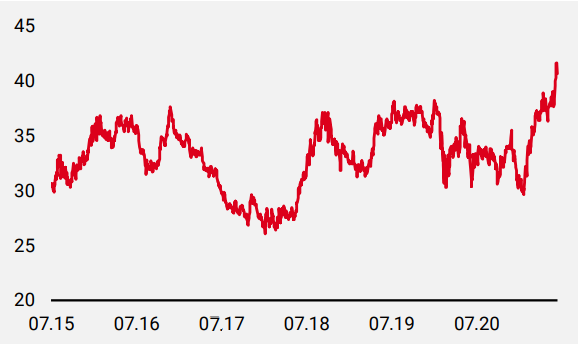
Source: Unigestion, Bloomberg, as of 16 July 2021.
Such a gap tends to increase the attractiveness of Chinese assets relative to US assets. Moreover, Chinese growth remains strong and the tools available to the Chinese authorities to support the economy are large and underused relative to their history. Are these factors sufficiently supportive to bet on Chinese equities? In our view, the uncertainty factor remains high both in terms of regulation and geopolitics. Consequently, only a significant improvement in our Growth Nowcaster for China could compensate for these negative elements and justify tactically playing catch-up with Chinese stocks.
Unigestion Nowcasting
World Growth Nowcaster
World Inflation Nowcaster
Market Stress Nowcaster
Weekly Change
- Last week, our World Growth Nowcaster remained steady at elevated levels, as a slowdown in data from India was offset by improvements in North America.
- Our World Inflation Nowcaster also remained steady at elevated levels with slightly lower inflation pressures in the developed world offset by increasing pressures in emerging markets.
- Our Market Stress Nowcaster remained steady as improved liquidity conditions offset a modest deterioration in spreads.
Sources: Unigestion. Bloomberg, as of 16 July 2021
Important Information
This document is provided to you on a confidential basis and must not be distributed, published, reproduced or disclosed, in whole or part, to any other person.
The information and data presented in this document may discuss general market activity or industry trends but is not intended to be relied upon as a forecast, research or investment advice. It is not a financial promotion and represents no offer, solicitation or recommendation of any kind, to invest in the strategies or in the investment vehicles it refers to. Some of the investment strategies described or alluded to herein may be construed as high risk and not readily realisable investments, which may experience substantial and sudden losses including total loss of investment.
The investment views, economic and market opinions or analysis expressed in this document present Unigestion’s judgement as at the date of publication without regard to the date on which you may access the information. There is no guarantee that these views and opinions expressed will be correct nor do they purport to be a complete description of the securities, markets and developments referred to in it. All information provided here is subject to change without notice. To the extent that this report contains statements about the future, such statements are forward-looking and subject to a number of risks and uncertainties, including, but not limited to, the impact of competitive products, market acceptance risks and other risks.
Data and graphical information herein are for information only and may have been derived from third party sources. Although we believe that the information obtained from public and third party sources to be reliable, we have not independently verified it and we therefore cannot guarantee its accuracy or completeness. As a result, no representation or warranty, expressed or implied, is or will be made by Unigestion in this respect and no responsibility or liability is or will be accepted. Unless otherwise stated, source is Unigestion. Past performance is not a guide to future performance. All investments contain risks, including total loss for the investor.
Unigestion SA is authorised and regulated by the Swiss Financial Market Supervisory Authority (FINMA). Unigestion (UK) Ltd. is authorised and regulated by the UK Financial Conduct Authority (FCA) and is registered with the Securities and Exchange Commission (SEC). Unigestion Asset Management (France) S.A. is authorised and regulated by the French “Autorité des Marchés Financiers” (AMF). Unigestion Asset Management (Canada) Inc., with offices in Toronto and Montreal, is registered as a portfolio manager and/or exempt market dealer in nine provinces across Canada and also as an investment fund manager in Ontario and Quebec. Its principal regulator is the Ontario Securities Commission (OSC). Unigestion Asset Management (Copenhagen) is co-regulated by the “Autorité des Marchés Financiers” (AMF) and the “Danish Financial Supervisory Authority” (DFSA). Unigestion Asset Management (Düsseldorf) SA is co-regulated by the “Autorité des Marchés Financiers” (AMF) and the “Bundesanstalt für Finanzdienstleistungsaufsicht” (BAFIN).