“Wonderland” – Malia, 2007
The short-term outlook for the European economy can be assessed from two perspectives. The first is positive: an extension to Article 50 reduces the risk of a ‘no-deal’ Brexit, which would likely have pushed the European economy into recession. The second is more negative. Mario Draghi has repeated that the risks to the Euro area remain tilted to the downside and long-term rates will stay lower for longer. Over the longer term, the situation is clear: “Wonderland” will be anywhere but Europe while it lags the rest of the world in innovation, as highlighted by the WIPO’s recent study on intellectual property.
What’s Next?
Today’s research is tomorrow’s leadership
There is extensive academic research on the effects of innovation on economic performance. Articles as early as Solow (1956) showed how technical progress could be a significant driver of long-run growth in developed economies. In an OECD paper released in 2004, Nathan Rosenberg from Standford University highlighted how technological innovation is “considered as a major force in economic growth”. Nobel prize winner, Douglass C North demonstrated how innovation was a driver of reductions in the transactional costs and the economic development of the world from “local exchange within the village” to “long distance trades” and finally to “global capital market”. Today, innovation can be multidimensional and affects all sectors: industrial and services, private and public. However, one thing remains: today’s research will determine tomorrow’s performance and future leadership. One way to assess where we are in terms of technological innovation and technological research is to track the international patent applications across countries. The WIPO, the UN agency that tracks it, recently released its 2018 report. The main findings illustrate how the world has changed with the emergence of new leaders.
Asia is leading, US is following, Europe is disappearing
In 2004, the breakdown in terms of intellectual property rights was as follows: Asia accounted for 40% of world applications, Europe 36%, North America 12%. In 2018, North America represented 8% of total applications, Asia 69% and Europe 16%. Around 253,000 international applications were filed in 2018, up 3.9% on 2017, representing the ninth consecutive year of growth. Applicants based in the US filed the most applications, followed by China and Japan. At a country level, the US is still first, although its yearly growth is slightly negative, while China, in second place, grew by 9% over the year, like Korea (+8%) and Japan (+3%). In Europe, Germany is first with only 20k international applications filed in 2018 versus more than 50k for the US (56K), China (53k) and Japan (50k). The gap between Europe and Asia is large and growing. We observe a similar trend at the company level. The study shows that China-based telecoms giant Huawei Technology was the top filer of international patent applications in 2018 (based on published applications), followed by Mitsubishi Electric of Japan, and Intel and Qualcomm of the US. Note the gap in terms of the number of patent applications between the leader, Huawei, which filed 5k applications in 2018 and Mitsubishi (2.8k). The first European company is Ericsson with 1.6k applications. Here again the gap is large between Asia and US firms on one side and European ones on the other side.
Regarding sectors, service sectors are dominated by China, which is first for Digital Communication and second for Computer Technology, while the US is first for Computer Technology and second for Medical Technology. In industrial sectors, former champions such as Japan and Germany lead the way, coming top in Electrical Machinery and second for Transport, respectively. The information, communications and technology revolution has made possible a great unbundling of production chains. This generated vast new quantities of “supply-chain trade”, increasingly concentrated in Asia where, by the late 1990s, supply-chain trade had overtaken that of Europe, the US and Canada. The OECD Index of Participation to Global Supply Chain shows that Europe is lagging other countries, with 30% versus 50% for China, 45% for US and 70% for Taiwan.

What does it mean for the future?
Technological innovation has several economic implications. Economic leadership is the most widely known, as illustrated by the current trade war between China and the US. Others concern regulation and social inequality. Over the last three decades, the size of services sectors has increased significantly at the expense of industry. To illustrate, the proportion of added value and employment in services measured by the World Bank jumped massively over the period in most developed and emerging countries. China’s efforts to rebalance growth from external to internal demand focused on the development of services, currently representing 57% of employment versus 28% in 2000. Services tend to be increasingly intangible and therefore more difficult to evaluate in terms of added value, and to regulate for taxation and security purposes. As a result, this raises the question of an efficient policy mix. Innovation affects GDP and CPI estimations, and monetary and fiscal policy as a result. In 2017, during the Economic Policy Symposium organized by the Fed at Jackson Hole, one theme was “Fostering Business Dynamism and Ensuring Competitive Markets“. During the discussion, economist Alan Blinder noted: “In the 1990s, we talked a lot about B2B, business to business, and B2C, business to consumers. It seems to me that a lot of the recent wave of innovation has been C2C, consumer to consumer, and some of that is fun. Fun was never supposed to be a part of the GDP or of industrial productivity, and it’s not. So, that’s not a measurement error; it was never meant to be in the GDP”. However, “fun” could be the future and represent the “Wonderland” but in Europe, we are still waiting for the next Google, Alibaba, Apple, Huawei or Netflix.

Wonderland

Strategy Behaviour
Our medium-term views remain cautious, and we are pairing an overweight in government bonds with an underweight in high yield corporate credit. We are also complementing our equity exposure with options to protect the portfolio in the case of equity drawdowns.
Performance Review
Last week, the Multi Asset Risk Targeted Strategy was down -0.3% versus 0.5% for the MSCI AC World Index and 0.1% for the Barclays Global Aggregate (USD hedged). Year to date, Multi Asset Risk Targeted Strategy has returned 4.9% versus 15% for the MSCI AC World index, while the Barclays Global Aggregate (USD hedged) index is up 2.6%.
* The Multi Asset Risk Targeted Strategy performance is shown in USD net of fees for the representative account of the Multi Asset Risk Targeted (Medium) USD Composite and reflects the deduction of advisory fees and brokerage commission and the reinvestment of all dividends and earnings. Past performance is not indicative of future performance. This information is presented as supplemental information only and complements the GIPS compliant presentation provided on the following page.
Unigestion Nowcasting
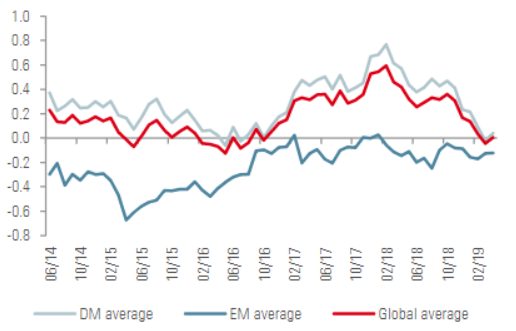
World Growth Nowcaster
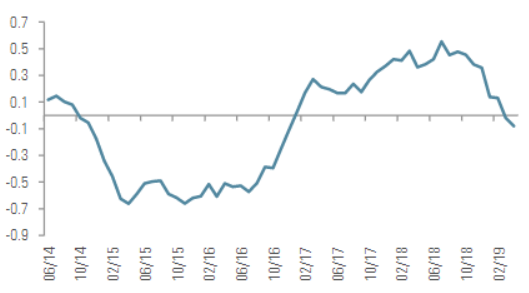
World Inflation Nowcaster
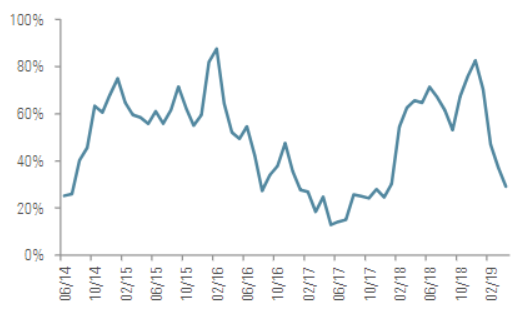
Market Stress Nowcaster
Weekly Change
- Our world Growth Nowcaster marginally increased over the week, mainly across developed markets (DM): only Canada gave signs of a further deceleration over the past week in the DM group.
- Our world Inflation Nowcaster decreased again this week, as the expected inflation component to our US Inflation Nowcaster fell.
- Market stress decreased over the week, driven by the lower volatilities and spreads.
Sources: Unigestion. Bloomberg, as of 15 April 2019
Important Information
Past performance is no guide to the future, the value of investments can fall as well as rise, there is no guarantee that your initial investment will be returned. This document has been prepared for your information only and must not be distributed, published, reproduced or disclosed by recipients to any other person. This is a promotional statement of our investment philosophy and services only in relation to the subject matter of this presentation. It constitutes neither investment advice nor recommendation. This document represents no offer, solicitation or suggestion of suitability to subscribe in the investment vehicles it refers to. Please contact your professional adviser/consultant before making an investment decision. Where possible we aim to disclose the material risks pertinent to this document, and as such these should be noted on the individual document pages. Please contact Unigestion for a complete list of all the applicable risks. Some of the investment strategies described or alluded to herein may be construed as high risk and not readily realisable investments, which may experience substantial and sudden losses including total loss of investment. These are not suitable for all types of investors. To the extent that this report contains statements about the future, such statements are forward-looking and subject to a number of risks and uncertainties, including, but not limited to, the impact of competitive products, market acceptance risks and other risks. As such, forward looking statements should not be relied upon for future returns. Data and graphical information herein are for information only and may have been derived from third party sources. Unigestion takes reasonable steps to verify, but does not guarantee, the accuracy and completeness of this information. As a result, no representation or warranty, expressed or implied, is or will be made by Unigestion in this respect and no responsibility or liability is or will be accepted. All information provided here is subject to change without notice. It should only be considered current as of the date of publication without regard to the date on which you may access the information. Rates of exchange may cause the value of investments to go up or down. An investment with Unigestion, like all investments, contains risks, including total loss for the investor.
Depending on your country of residence, this document is distributed by Unigestion UK Limited, Unigestion SA, Unigestion Asset Management (France) S.A., Unigestion Asia Pte Limited or Unigestion Asset Management (Canada) Inc. Unigestion UK Limited is authorised and regulated by the UK Financial Conduct Authority (“FCA”). Unigestion UK Limited is also registered as an investment adviser with the U.S. Securities and Exchange Commission (“SEC”). Unigestion SA is authorised and regulated by the Swiss FINMA. Unigestion Asset Management (France) S.A. is authorised and regulated by the French Autorité des Marchés Financiers. Unigestion Asia Pte Limited is authorised and regulated by the Monetary Authority of Singapore. Unigestion Asset Management (Canada) Inc. is authorised and regulated by the Ontario Securities Commission.
Unigestion Multi Asset Risk-Targeted (USD): 31 December 2014 Through 31 December 2018
| Year | Composite Return Gross of Fees |
Composite Net Return | Benchmark Return | Number of Accounts | Internal Dispersion | Composite 3-Yr Std Dev | Benchmark 3-Yr Std Dev | Composite AUM (M) | Firm AUM (M) |
| 2015 | -1.61% | -2.80% | – | 1 | – | – | – | 127.24 | 15’550.31 |
| 2016 | 5.05% | 3.79% | – | 1 | – | – | – | 129.66 | 18’144.46 |
| 2017 | 11.16% | 9.82% | – | 1 | – | – | – | 169.51 | 22,340.80 |
| 2018¹ | -2.91% | -4.08% | – | 1 | – | – | – | 286.93 | 21,403.49 |
Special Disclosure: For presentations prior to 31.03.2018 the strategy was measured against the LIBOR 3M USD + 4%. Beginning April 2018 the firm determined that the benchmark did not accurately reflect the strategy mandate and the benchmark was removed.
Definition of the Firm: For the purposes of applying the GIPS Standards, the firm is defined as Unigestion. Unigestion is responsible for managing assets on the behalf of institutional investors. Unigestion invests in several strategies for institutional clients: Equities, Hedge Funds, Private Assets and the solutions designed for the clients of our Cross Asset Solution department. The GIPS firm definition excludes the Fixed Income Strategy Funds, which started in January 2001 and closed in April 2008, and the accounts managed for private clients. Unigestion defines the private clients as High Net Worth Families and Individual investors.
Policies: Unigestion policies for valuing portfolios, calculating performance, and preparing compliant presentations are available upon request.
Composite Description: The Multi Risk Targeted (Medium) composite was defined on 15 December 2014. It consists of accounts which aim to deliver consistent smooth returns of cash + 5% gross of fees across all market conditions over a 3-year rolling period. It seeks to achieve this by capturing the upside during bull markets while protecting capital during market downturns.
Benchmark: Because the composites strategy is absolute return and investments are permitted in all asset classes, no benchmark can reflect this strategy accurately.
Fees: Returns are presented gross of management fees, administrative fees but net of all trading costs and withholding taxes. The maximum management fee schedule is 1.2% per annum. Net returns are net of model fees and are derived by deducting the highest applicable fee rate in effect for the respective time period from the gross returns each month.
List of Composites: A list of all composite descriptions is available upon request.
Minimum Account Size: The minimum account size for this composite is 5’000’000.- USD.
Valuation: Valuations are computed in US dollars (USD). Performance results are reported in US dollars (USD).
Internal Dispersion & 3YR Standard Deviation: The annual composite dispersion presented is an asset-weighted standard deviation calculated for the accounts in the composite the entire year. When internal dispersion is not presented it is as a result of an insufficient number of portfolios in the composite for the entire year. When the 3 Year Standard Deviation is not presented it is as a result of an insufficient period of time.
Compliance Statement Unigestion claims compliance with the Global Investment Performance Standards(GIPS®) and has prepared and presented this report in compliance with the GIPS standards. Unigestion has been independently verified for the periods 1 January 2003 to 31 December 2016. The verification report(s) is/are available upon request. Verification assesses whether (1) the firm has complied with all the composite construction requirements of the GIPS standards on a firm-wide basis and(2) the firms policies and procedures are designed to calculate and present performance in compliance with the GIPS standards. Verification does not ensure the accuracy of any specific composite presentation.