MiViews Q1 2019: Preparing for rougher seas
- Slowing global growth points to pockets of weakness but not recession. The risk/reward of pro-growth assets have been significantly reduced and selectivity will be key.
- Monetary policy will likely continue to be a headwind for growth assets as central banks reduce their balance sheets. We are taking a cautious stance regarding overall portfolio risk levels.
- Convergence in monetary policy and contracting growth differentials versus the US tilt the risks of the US dollar to the downside.
Overview
With global stock indices in or close to bear territory, investors are concerned that the global economy may be heading into a recession. A variety of macroeconomic and market-based indicators suggests that we are still some time away from the end of the current expansion. However, the picture for growth-oriented assets is nonetheless quite worrisome as we head into the first quarter of 2019.
Historically, bear markets have rarely occurred outside of recessions but the disconnect between market expectations and macro fundamentals points to further downside risk ahead. Central banks will shift from being net providers of liquidity in financial markets to reducing it on net. Typical correlations that benefit long beta exposures also look to be at risk given this liquidity contraction and growth slowdown.
On the positive side, expectations of corporate earnings growth have come down significantly. An upside surprise in the earnings season starting in January may provide a boost to equity markets if investors regain confidence in the broader growth picture.
Markets are pricing in lower growth
The fourth quarter of 2018 saw a significant repricing of risky assets. While there were a variety of factors contributing to the market moves, one of the major drivers was a retrenchment of growth expectations, especially in the US. Chart 1 illustrates how this dynamic evolved by considering the cumulative changes in the MSCI US Growth index versus the broader US index. As the chart shows, growth expectations rose steadily throughout the year (including through the February sell-off) until October when they reversed their trend. Importantly, it looks to us like there is further repricing ahead: our US Growth Nowcaster has continued to deteriorate and shows growth in the US quickly falling to potential. This context supports our view that the balance of risks to growth are tilted the downside.
Chart 1: Market pricing for US growth
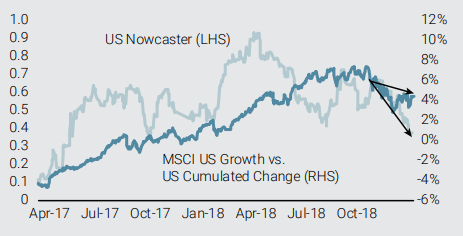
Source: Bloomberg, Unigestion (as of 27 December 2018)
The economic slowdown is not just a US phenomenon however. As Chart 2a shows, our global Growth Nowcaster has receded, driven by both developed markets (DM) and emerging markets (EM), with EM failing to break past their potential levels. Chart 2b shows the evolution of our Growth Nowcaster’s diffusion index, further highlighting the recent sharp deceleration with nearly 65% of data declining. The last time we saw such a sharp deceleration was March 2018, but today global growth has already weakened so continued deceleration from this level will drive growth to potential levels or below.
Chart 2a: Growth Nowcaster
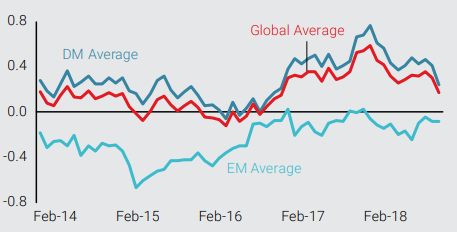
Chart 2b: Growth Nowcaster Diffusion Index
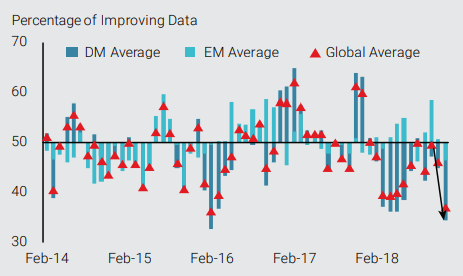
Source: Bloomberg, Unigestion (as of 26 December 2018)
Looking more granularly, we see that the global expansion is not as robust and broad-based as it was earlier in the year. The US is the only major economy expanding healthily above potential, with growth in the Eurozone and China both meaningfully below potential (Chart 3).
Chart 3: Breakdown of Growth Nowcaster
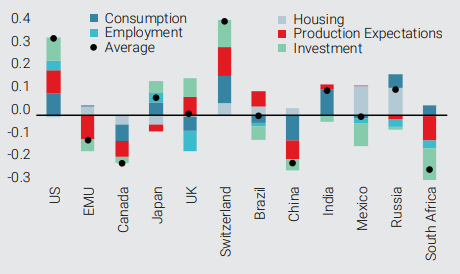
Source: Bloomberg, Unigestion (as of 26 December 2018)
Fiscal stimulation in response to deteriorating growth may help to offset this trend but its effectiveness is unclear. In the US, political gridlock has already led to a government shutdown and the prospects for the bipartisan legislation required to pass a split Congress and an unpredictable president seem low. In the Eurozone, the lack of fiscal union and the high government debt levels of its most vulnerable members will make it difficult to deal with the slowdown already evident in some of its key economies. Finally, Chinese policymakers have announced stimulation measures but, with non-financial private debt levels already at 200% of GDP according to the IMF, the impact of this stimulation will likely be reduced. Indeed, their stimulation measures earlier this year were not sufficient to turn the tide and growth stagnated. Nonetheless, we are paying close attention here as a recovery in Chinese growth would have a broad impact on the global economy. Additionally, we are monitoring the lagged effect of lower oil prices on demand but have yet to see a material boost.
Does this mean we are on the brink of recession?
The economic slowdown has made recession forecasting a favourite pastime for some market participants over the last year. Indeed, searches for ‘recession’ on Google have increased significantly over the last couple of months (see Chart 4), suggesting that fears of a global recession extend beyond the investment world. But one of the difficulties in predicting recessions is that they are typically a surprise and the cause only becomes evident afterwards. For example, few thought the repricing of tech stocks during the 2000 equity bubble would trigger a recession in the US, even if many agreed valuations were at extremes. Rather than go looking for a particular trigger, we consider a host of data, both macroeconomic and markets-based, to see if there are any emerging indicators of recession. We believe that if the economy was heading into a recession, this would be evident across a variety of economic variables as well as market prices. When we look today, we see few reasons to believe a recession is on the horizon.
Chart 4: Google Search Index For “Recession” (100 = January 2008)
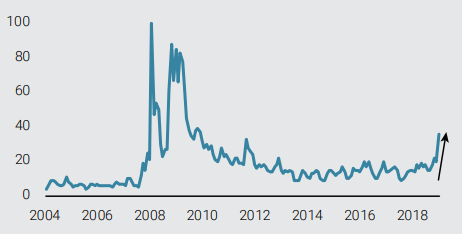
Source: Google Trends, Unigestion (as of 26 December 2018)
In terms of macroeconomic data, our Growth Nowcaster points to a low likelihood of recession in the near term, although the number has risen since September. As we discussed above, global growth has clearly decelerated but it is critical to understand that it is still far from recessionary levels in most economies. By converting our Growth Nowcaster into a recession probability, we see that, although not impossible, it is highly unlikely that we are entering into a global recession (see Chart 5). While the likelihood of recession in DM economies has grown, driven largely by Canada and the Eurozone, it is still below 25%. Importantly, conditions in the US remain positive and the chance of recession there remains very low. In EM economies, improving conditions in China are offsetting deteriorating conditions in South Africa and recession risk there remains below 30%.
Chart 5: Recession probabilities by region
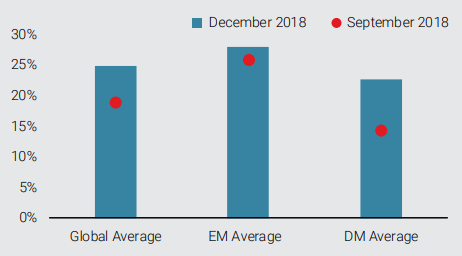
Source: Bloomberg, Unigestion (as of 30 December 2018)
For the markets-based likelihood of recession, we take two different approaches, a top-down approach using select market variables and a bottom-up approach using principal components analysis (PCA). For the top-down approach, we consider proxies of the growth premium embedded in different assets. For example, for equity markets, we look at changes in analyst earnings-per-share (EPS) growth estimates for the next year versus this year, giving us a view into analysts’ projections for profit growth over the next 12–24 months. In fixed income, we look at both the slope of the yield curve and changes in high yield corporate debt spreads. For the PCA, we consider a range of equity indices, nominal and real yields, breakevens, commodity indices and currencies. Of course, as with any PCA, one must be careful in assigning intuition to components, and we only consider the first component, which alone accounts for about 35% of the variance and has strong evidence supporting it as a growth factor.
Chart 6 shows the evolution of these two approaches through time. For the bottom-up growth factor, it is important to keep in mind that it is the cumulated changes of the underlying factor, thus the level is not nearly as important as the trend. Clearly, both of these indicators have risen significantly over recent months suggesting that markets recognise a deterioration in growth fundamentals.
Chart 6: Market-based recession indicators
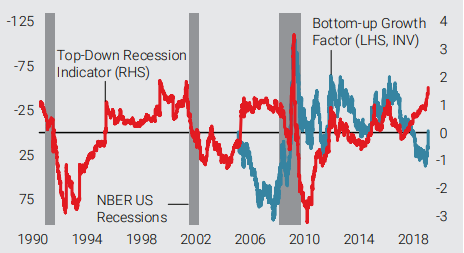
Source: Bloomberg, Unigestion (as of 27 December 2018)
Digging a bit deeper into the top-down indicator, we see that the recent spike is related to the rise in corporate high yield credit spreads. At the same time, the equities and sovereign bond components have also risen steadily for much of 2018 (Chart 7). The current levels are still below the levels before previous recessions, although a continuation of this trend would be quite concerning.
Chart 7: Components of top-down indicator
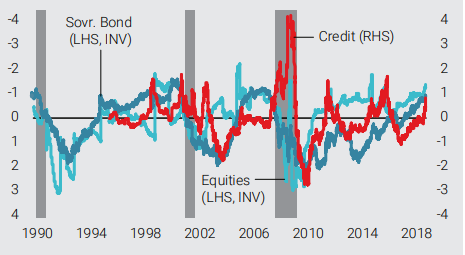
Source: Bloomberg, Unigestion (as of 27 December 2018)
To us, these differing perspectives confirm a growth slowdown, although they do not clearly point to an oncoming recession. The market impact is clear however: the risk/reward of pro-growth assets has been greatly reduced and cautiousness will be key in the early part of 2019.
Monetary policy will likely continue to be headwind for growth assets
At the global level, we have started to see the beginnings of central bank balance sheet reduction that will be a key driver for financial assets over the next few years. This dynamic reverses the waves of balance sheet expansion we have seen since the Great Financial Crisis. As Chart 8 shows, this will be a significant change and the resulting withdrawal of liquidity will raise yields across all assets, just as balance sheet expansion lowered yields across the risk curve.
Chart 8: Change in Global CB Balance Sheets (USD billions)
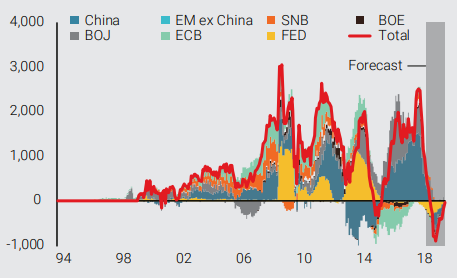
Source: Bloomberg, Unigestion (as of 27 December 2018)
Of course, the other tool in the central bank toolbox is interest rate policy. We saw in 2018 that the Fed is the clear leader among key central banks in rate normalisation, having hiked consistently throughout the year. Although inflation pressures have moderated in the US, they are still tilted to the upside (see Chart 9a). At the same time, the labour market is solidly past full employment and wages continue to grow at healthy rates (Chart 9b).
Chart 9a: US Inflation Surprises vs. Nowcaster
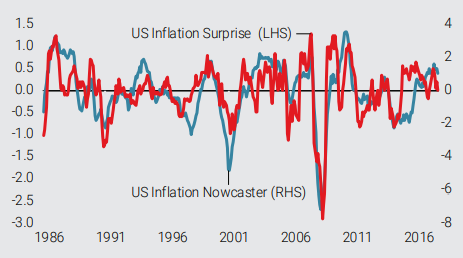
Chart 9b: US Unemployment vs. Wages
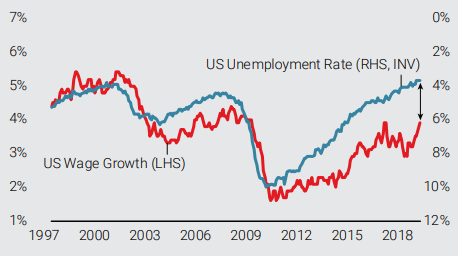
Source: Bloomberg, Unigestion (as of 27 December 2018)
In our view, a primary reason that markets have not priced in further deterioration in growth is that expectations of US monetary policy have shifted meaningfully following Fed Chairman Powell’s speech to the Economic Club of New York this past November. As Chart 10 shows, pricing in the Fed Funds futures markets are currently showing zero interest rate hikes for 2019 and a rate cut in 2020, while the median projection is for two hikes in 2019 and one more in 2020. In other words, the market is discounting the end of the current tightening cycle in the US while the Fed sees at least three more interest rate hikes in the current cycle.
Chart 10: US Interest Rate Expectations (“Dot Plot”)
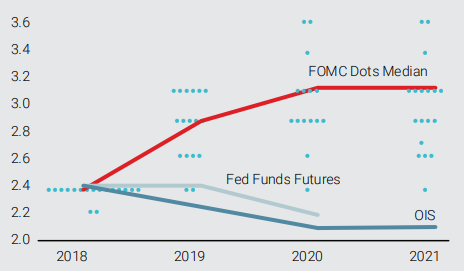
Source: Bloomberg, Unigestion (as of 27 December 2018)
As we have communicated before, “don’t fight the Fed” is a good investment tenet, and the current context looks supportive to us for additional hikes. While we believe the Fed will be patient with further tightening, we expect to see at least one more hike in 2019 given that the US economy remains quite far from recession levels. Indeed, the impact of Fed interest rate policy on risky assets seems tilted to the downside to us: either the Fed delivers on at least one hike next year (our base case) or it backs off tightening because growth has slowed down significantly enough that the economy cannot take further tightening (i.e., we are wrong). In the former case, markets would likely reel from the adjustment to unexpectedly tighter monetary policy. If the latter case were to transpire, we would be in a context quite dire for growth, and any positive support from more dovish policy would be offset by further deterioration in growth expectations. Thus, in our view, the risk-reward of pro-growth assets is quite poor heading into 2019.
Asset allocation will be challenging and require dynamic risk management
As 2018 demonstrated, we are in a difficult environment for financial markets. Many risky markets were down significantly on the year, and traditional diversifiers were less effective than usual as structural dynamics like historically low government bond yields led to asymmetry in returns. These challenges are likely to continue in the beginning of 2019, thereby making multi asset portfolios with long-term horizons susceptible to further drawdowns. In this context, we believe there are a few investment themes that stand out as we start the new year:
1. Reduce beta exposure: We believe the best approach to deal with this diminished diversification benefit is to take a cautious stance and lower the exposure of the portfolio to overall market risk. Chart 11 illustrates how correlations to global equities have retreated over the past couple of years, thereby handicapping portfolios that are overly reliant on long-term correlations for diversification if pro-growth assets continue to sell-off. Interestingly, the one exception to this is the Japanese yen: its diversification benefit has modestly improved despite the Bank of Japan continuing to be one of the most accommodative central banks.
Chart 11: Correlations to the MSCI All Country World Index
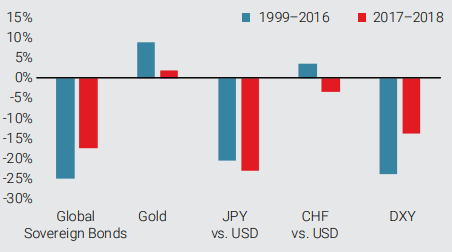
Source: Bloomberg, Unigestion (as of 27 December 2018)
2. Short USD: The risks to the US dollar seem tilted toward the downside to us. We expect monetary policy to converge in 2019, and growth differentials versus the US to contract, given that the impact of US fiscal stimulus is now behind us. Moreover, positioning remains long the greenback in spite of lower US rates. Clearly, there are supports to the dollar, including its safe haven nature, balance sheet normalisation and a potential hawkish move by the Fed. However, netting these pressures, we believe the US dollar will retrace some of its 2018 appreciation.
3. Discriminate among growth assets: As discussed above, we believe the risk/reward of growth assets has been reduced although the likelihood of a global recession remains muted. In situations like these, it is critical to be selective across and within asset classes. In our view, corporate credit spreads look vulnerable especially against equities. While spreads have risen recently, they remain below the levels seen in 2011 and 2015 when global growth concerns surfaced. At the same time, equity markets have sold off significantly, with valuations below long- term medians across the board despite global growth still meaningfully above potential (see Chart 12a). Moreover, if expectations about earnings continue to decline (Chart 12b), we believe most of the downside will be priced in going into earnings season in mid-January. It is likely that results will be strong given the still-healthy pace of global growth at the end of 2018, setting the stage for an upside trigger for equity markets at the beginning of the year, especially against credit spreads.
Chart 12a: 12 Month Forward P/E Ratios (10th– 90th Percentile)
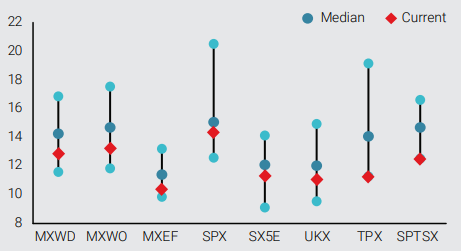
Chart 12b: Analyst Estimates for EPS Growth in 1 Year, 1 Year Forward
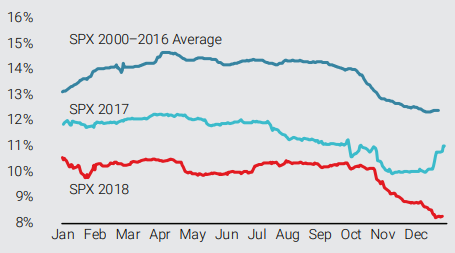
Source: Bloomberg, Unigestion (as of 27 December 2018).
Important Information
The information and data presented in this page may discuss general market activity or industry trends but is not intended to be relied upon as a forecast, research or investment advice. It is not a financial promotion and represents no offer, solicitation or recommendation of any kind, to invest in the strategies or in the investment vehicles it refers to. Some of the investment strategies described or alluded to herein may be construed as high risk and not readily realisable investments, which may experience substantial and sudden losses including total loss of investment.
The investment views, economic and market opinions or analysis expressed in this page present Unigestion’s judgement as at the date of publication without regard to the date on which you may access the information. There is no guarantee that these views and opinions expressed will be correct nor do they purport to be a complete description of the securities, markets and developments referred to in it. All information provided here is subject to change without notice. To the extent that this page contains statements about the future, such statements are forward-looking and subject to a number of risks and uncertainties, including, but not limited to, the impact of competitive products, market acceptance risks and other risks.
Data and graphical information herein are for information only and may have been derived from third party sources. Although we believe that the information obtained from public and third party sources to be reliable, we have not independently verified it and we therefore cannot guarantee its accuracy or completeness. As a result, no representation or warranty, expressed or implied, is or will be made by Unigestion in this respect and no responsibility or liability is or will be accepted. Unless otherwise stated, source is Unigestion.
Past performance is not a guide to future performance. All investments contain risks, including total loss for the investor.