- Equities
- Papers
- Perspectives

Alessandro Laurent, PhD
Senior Portfolio Manager
Equities
- Next 12 months dividend growth can be forecasted with exceptional accuracy using a machine learning model
- Combining dividend yield with the forecasted dividend growth overcomes many of the shortcomings of a traditional equity income strategy
- Such a strategy can achieve a significantly higher risk-adjusted return
Overview
Income investing has long been of interest to equity investors seeking capital growth and attractive yields. Ageing populations and historically low interest rates have increased demand for such investments further. But income investing is not without its complexities. How can artificial intelligence help asset managers overcome these potential pitfalls and deliver consistent outperformance for clients?
In this study, we apply our capabilities in a subset of artificial intelligence – machine learning – to forecast which high yield companies are most likely to reduce their dividend in the next twelve months, and which ones on the other hand show a robust, sustainable yield. We found that the most significant characteristics to predict the future dividend growth of a company are its current dividend yield and the stock volatility adjusted price momentum, together with profitability and valuation metrics. Conversely, the model demonstrated that sell side consensus does not seem to do an impressive job in predicting future dividend growth.
Applying this information to a Robust Equity Income (REI) strategy results in consistent outperformance and improved fundamental metrics (higher ROE, lower long-term debt to total-assets and higher earnings growth) compared with a traditional high dividend strategy. Moreover, excluding companies with a high likelihood of a dividend cut does not come at the cost of a significant reduction in dividend yield but significantly benefits the overall performance of the strategy.
Introduction
Investing in high dividend paying companies has long been of interest to investors seeking capital appreciation and attractive yields. In the aftermath of the global financial crisis and the Zero Interest Rate Policies (ZIRP) pursued by central banks worldwide, the search for alternative sources of yield became even more popular.
Investing in high yielding stocks, however, comes with potential pitfalls and there are three key elements of income investing that investors must be aware of:
- An investment strategy should not focus solely on dividends, as these might not be sustainable in the future. Changes in corporate fortunes may force a company to cut its dividend, with significant negative consequences for the price performance of the stock. A significant recent example is Credit Suisse. Prior to its acquisition by UBS in 2023, the Bank saw its dividend yield fall from around 6% in 2016 to just 2% only two years later, before a final cut to just over 1% in 2021.
- A generous dividend policy might be the symptom of a lack of future company growth plans. Telecoms and Oil & Gas are a good example of saturated industries with relatively lacklustre growth potential and attractive – but possibly not sustainable – dividend yields. This lack of future growth is often linked to a lower stock quality and lower profitability, measured for instance as return on equity (ROE). It can also be related to higher levels of debt.
- Pure yield strategies tend to be concentrated on few sectors like Financials, Real Estate and Telecoms, leading to a potentially risky lack of diversification.
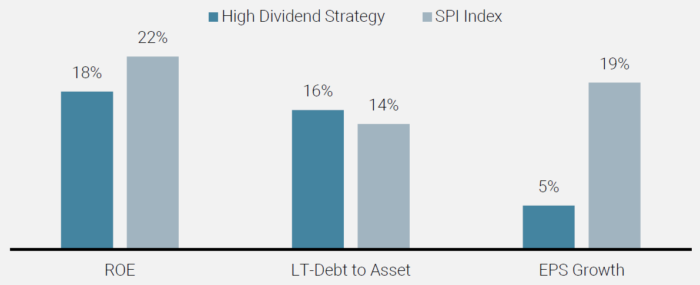
Figure 1 shows the hypothetical average sector exposure of a naïve Swiss dividend yield portfolio compared to the SPI index from January 2003 to December 2023, while Figure 2 shows the average ROE, long-term debt to total assets, and EPS growth.
Figure 1: Average Sector Composition of a Naïve Dividend Yield Strategy Compared to the SPI Index (2003–2023)
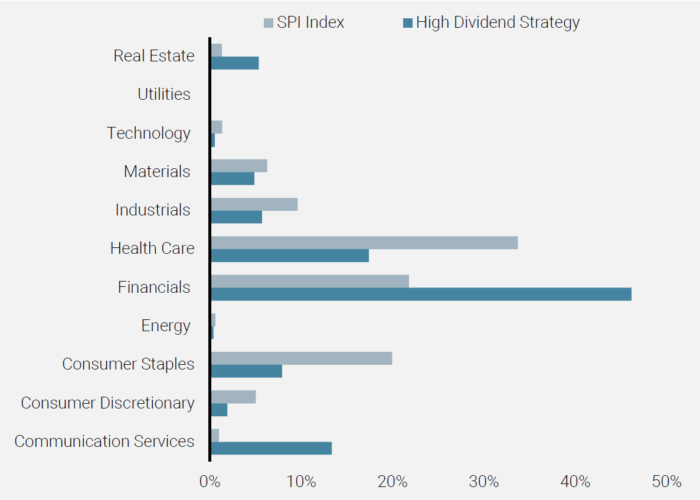
Figure 2: Average ROE, LT Debt-to-Total Assets and EPS Growth of a Dividend Yield Strategy Compared to the SPI Index (2003–2023)
Source: Unigestion.
These results highlight the main potential problem of a strategy that focuses uniquely on dividend yield. While the lack of earnings growth might justify the higher yield, the management may have no alternative means to generate shareholder value by investing in the company and therefore generating future earnings. At the same time, this lack of growth might be precisely why the dividend proves unsustainable over the long term.
So, when considering a dividend yield strategy, it is important to consider not only the current level of dividend yield but also the sustainability of the dividend, future potential growth, and the quality of the companies and industries selected.
How can the high yield investor use machine learning to achieve this?
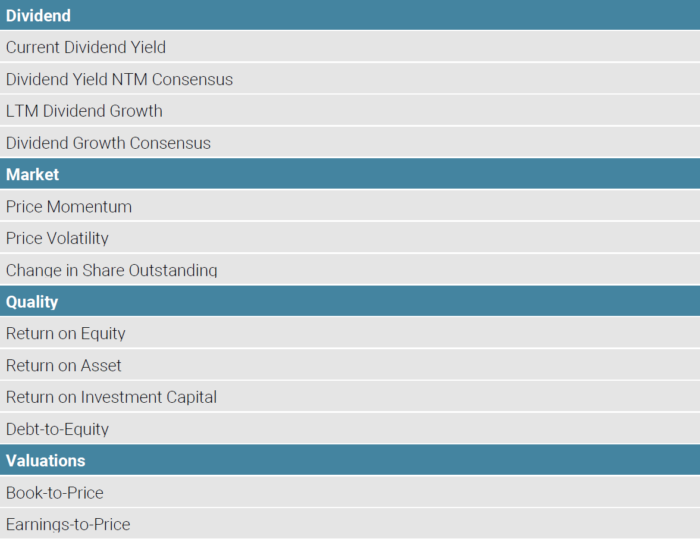
Table 1: Group of Company Characteristics Used to Train a Random Forest Algorithm on Next Twelve Months Dividend Growth
Our results show that the most significant characteristics to predict the future dividend growth of a company are its current dividend yield and the stock volatility adjusted price momentum. Importantly, taking a cautious approach to dividend yield is better than simply maximising a high yield. As explained in the previous section, a high dividend yield is more difficult to sustain in itself, let alone to form a base from which to deliver future dividend growth. Hence, the observed negative correlation between current dividend yield and future dividend growth. On the other hand, strong and stable equity momentum provides a market signal that a company is doing well, increasing the likelihood of positive growth in future dividends.
Other important characteristics to predict next year dividend growth are the profitability of a company (ROE), and its valuation (book-to-price). Higher profitability and a lower valuation are linked to better dividend growth.
Finally, while the consensus forecasted dividend growth is positively correlated to next year dividend growth, this relationship is not particularly strong. Put simply, sell side consensus does not seem to do an impressive job in predicting future dividend growth.
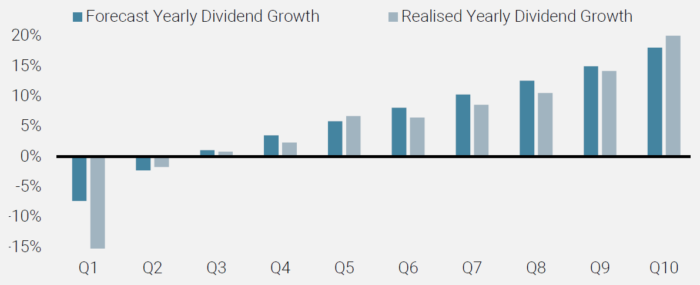
Our model’s predictions of next year dividend growth are highly accurate. Figure 3 compares the average forecasted and realised yearly dividend growth of ten portfolios built on the model forecast. The actual, realised dividend growth increases smoothly with increases in the forecast dividend growth.
Figure 3: Forecasted vs. Realised Average Dividend Growth Rate (2003–2023)
Source: Unigestion
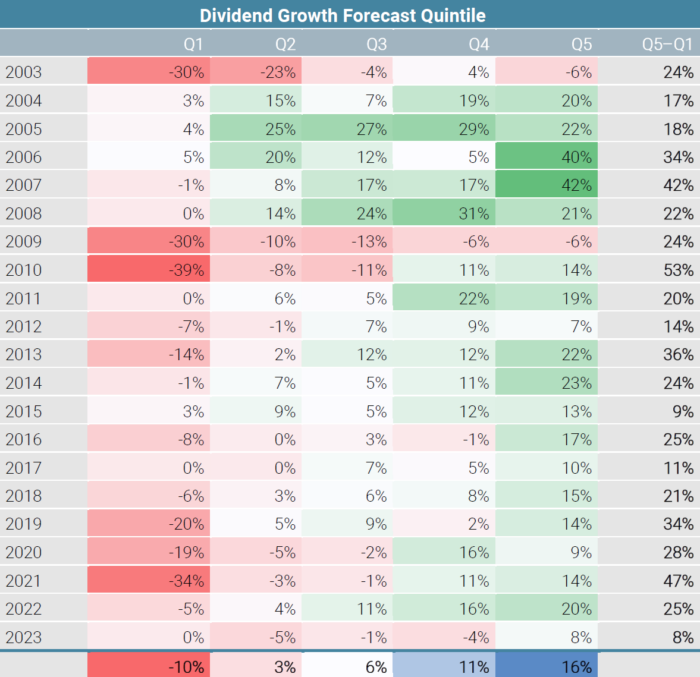
Table 2: Yearly Realised Dividend Growth of Portfolio Sorted on Dividend Growth Forecast (2003–2023)
Source: Unigestion
On average, our ‘highest dividend growth’ portfolio (Q5) achieves a dividend growth 26% higher than the ‘lowest dividend growth’ portfolio (Q1). The difference between the two portfolios, varies from a minimum of 8% in 2023 to a maximum of 47% is 2021. Finally, for each of the 20 observations, the model successfully predicts the portfolio with the lowest dividend growth, while for the portfolio with the highest dividend growth, the hit rate is 15 out of 20.
The results are robust even when controlling for consensus forecast and current dividend yield. Tables 3 and 4 show the average realised dividend growth of portfolios sorted on our dividend growth forecast, as well as FY1 consensus growth and current dividend yield, respectively.
Table 2: Yearly Realised Dividend Growth of Portfolio Sorted on Dividend Growth Forecast (2003–2023)
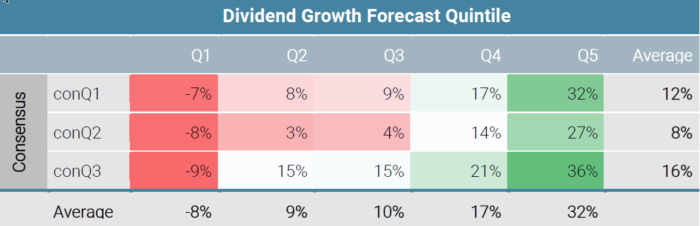
First, note how our forecast is significantly more accurate than sell side estimates. Second, consistent with our previous instincts, high dividend yield companies tend to exhibit lower dividend growth than low yielding companies.
However, our forecast seems to be accurate across each dividend yield quintile, even among companies that pay a high dividend yield. In particular, we can successfully identify the high yielding companies that have an elevated probability of reducing their dividend in the next twelve months. The average yearly dividend reduction of these companies is an astonishing 21%. These are precisely the stocks we should avoid when investing in a dividend yield strategy and that would inevitably enter a portfolio if an investor focused solely on actual dividend yield.
Enhancing a dividend strategy
Using our dividend forecasting model we can combine the observable current dividend yield of a stock with its expected dividend growth to obtain a robust dividend yield variable. This variable should deliver a high score for companies that have a high yield and a low probability of significantly reducing their dividend in the next twelve months. Companies with a lower dividend yield but a high probability of an increase in their dividend policy should also receive a high score.
Figure 4 shows the simulated compounded performance of a traditional dividend yield strategy compared with the robust equity income (REI) strategy and the SPI index, from January 2003 to December 2023.
Figure 4: Cumulative Performance of a Dividend Yield Strategy Compared to the Robust Equity Income (REI) Strategy and the SPI Index (2003–2023)
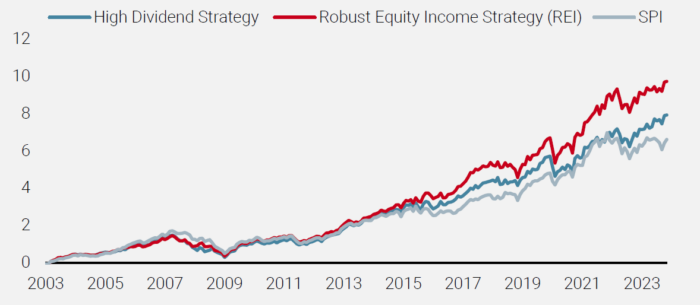
Source: Unigestion. The two dividend strategies are subject to the same liquidity constraints and a Tracking Error constraint of 5%. For illustrative purpose only.
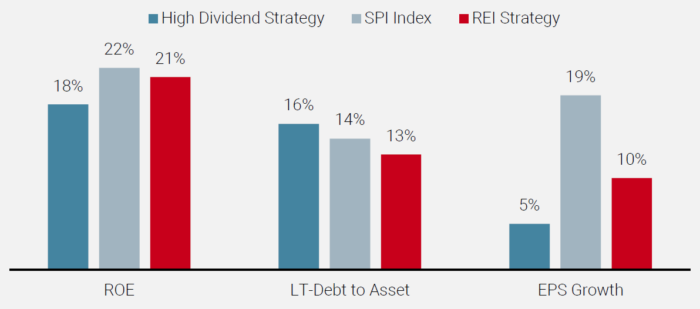
Figure 5: Average ROE, LT Debt-to-Total Assets and EPS Growth of a Robust Equity Income (REI) Strategy Compared to a Strategy Based Solely on DY and the SPI Index (2003–2023)
Source: Unigestion.
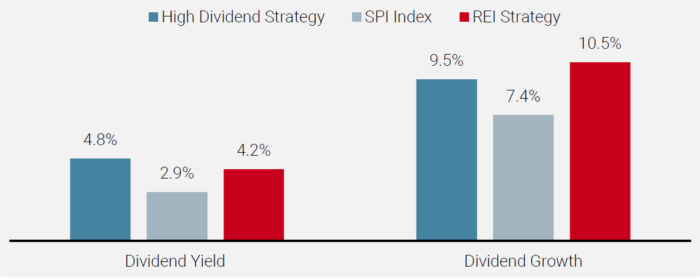
It’s also notable that, on average, over the last 20 years the robust equity income strategy achieves a dividend yield level similar to that provided by the traditional one (Figure 6) – but with a higher yearly dividend growth.
Figure 6: Average Dividend Yield and Dividend Growth of a Robust Equity Income (REI) Strategy Compared to a Strategy Based Solely on DY and the SPI Index (2003–2023)
Source: Unigestion.
Excluding companies with a high likelihood of a dividend cut does not significantly reduce the dividend yield. But, it does improve the overall performance of the strategy.
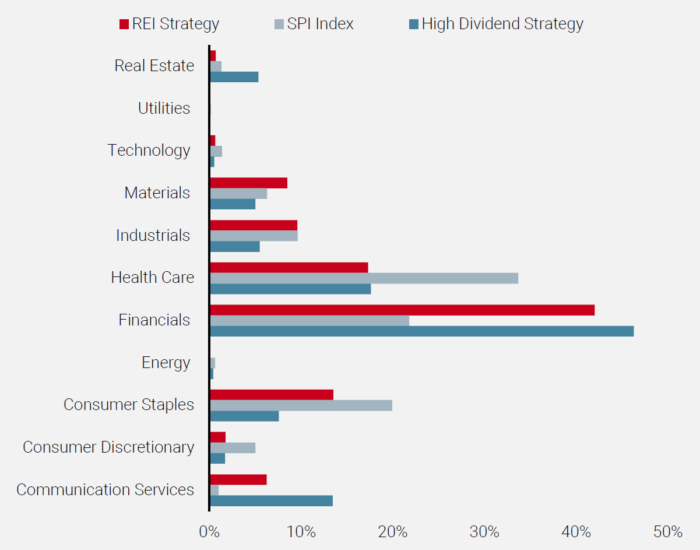
Finally, in terms of sector exposure (Figure 7), the robust equity income strategy reduces the concentration in Financials, Real Estate and Telecoms, and the underweight in industrials and Consumer Staples observed with a traditional dividend strategy.
Figure 7: Average Sector Composition of a Traditional and a Robust Equity Income (REI) Strategy Compared to the SPI Index (2003–2023)
Source: Unigestion
Conclusions and forecast for 2024
Table 5: Dividend Forecasting Model, Worst Quintile for 2024
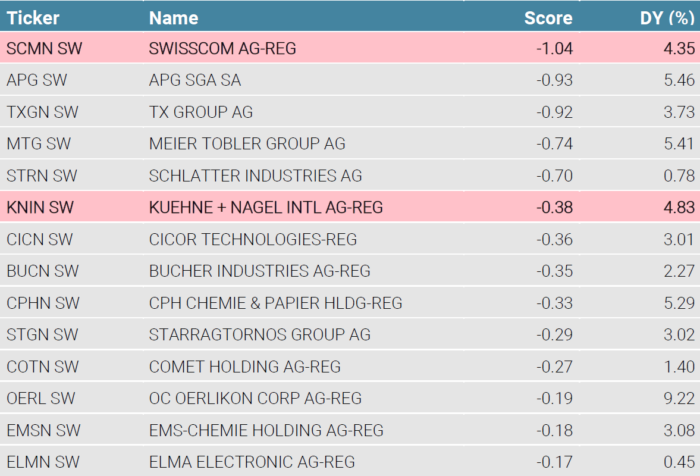
Table 6: Dividend Forecasting Model, Best Quintile for 2024
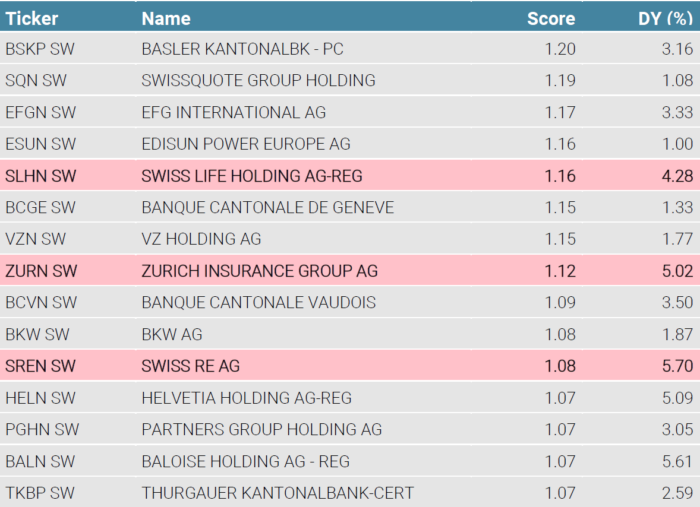
Source: Unigestion. Pink shade – SMI companies. DY represent the current Dividend Yield as of December 2024
Important information
INFORMATION ONLY FOR YOU
This document has been prepared for your information only and must not be distributed, published, reproduced or disclosed (in whole or in part) by recipients to any other person without the prior written consent of Unigestion. It is neither directed to, nor intended for distribution or use by, any person or entity who is a citizen or resident of, or domiciled or located in, any locality, state, country or jurisdiction where such distribution, publication, availability or use would be contrary to law or regulation.
RELIANCE ON UNIGESTION
There is no guarantee that Unigestion will be successful in achieving any investment objectives. An investment strategy contains risks, including the risk of complete loss. Except where otherwise specifically noted, the information contained herein, including performance data and assets under management, relates to the entire affiliated group of Unigestion entities over time. Such information is intended to provide you with background regarding the services, investment strategies and personnel of the Unigestion entities. No guarantee is made that all or any of the individuals involved in generating the performance on behalf of one or more Unigestion entities will be involved in managing any specific client account on behalf of another Unigestion entity.
NOT A RECOMMENDATION OR OFFER
This is a promotional statement of our investment philosophy and services only in relation to the subject matter of this presentation. It constitutes neither investment advice nor recommendation. This document represents no offer, solicitation or suggestion of suitability to subscribe in either the investment vehicles to which it refers or to any securities or financial instruments described herein. Any such offer to sell or solicitation of an offer to purchase shall be made only by formal offering documents, which include, among others, a confidential offering memorandum, limited partnership agreement (if applicable), investment management agreement (if applicable), operating agreement (if applicable), and related subscription documents (if applicable). Such documentation contains additional information material to any decision to invest. Please contact your professional adviser/consultant before making an investment decision.
Reference to specific securities should not be construed as a recommendation to buy or sell such securities and is included for illustration purposes only.
RISKS
Where possible we aim to disclose the material risks pertinent to this document. The views expressed in this document do not purport to be a complete description of the securities, markets and developments referred to in it. Unigestion maintains the right to delete or modify information without prior notice. The risk management practices and methods described herein are for illustrative purposes only and are subject to modification. Investors shall conduct their own analysis of the risks (including any legal, regulatory, tax or other consequences) associated with an investment and should seek independent professional advice. Some of the investment strategies or financial instruments described or alluded to herein may be construed as high risk and not readily realisable investments, and may experience substantial & sudden losses including total loss of investment. These are not suitable for all types of investors. Unigestion has the ability in its sole discretion to change the strategies described herein.
PAST PERFORMANCE
Past performance is not a reliable indicator of future results, the value of investments, can fall as well as rise, and there is no guarantee that your initial investment will be returned.
If performance is shown gross of management fees, you should be aware that the inclusion of fees, costs and charges will reduce investment returns.
Returns may increase or decrease as a result of currency fluctuations.
NO INDEPENDENT VERIFICATION OR REPRESENTATION
No separate verification has been made as to the accuracy or completeness of the information herein. Data and graphical information herein are for information only and may have been derived from third party sources. Unigestion takes reasonable steps to verify, but does not guarantee, the accuracy and completeness of information from third party sources. As a result, no representation or warranty, expressed or implied, is or will be made by Unigestion in this respect and no responsibility or liability is or will be accepted. All information provided here is subject to change without notice. It should only be considered current as of the date of publication without regard to the date on which you may access the information. An investment with Unigestion, like all investments, contains risks, including total loss for the investor.
FORWARD-LOOKING STATEMENTS
This document may contain forward-looking statements, including observations about markets and industry and regulatory trends as of the original date of this document. Forward-looking statements may be identified by, among other things, the use of words such as “expects,” “anticipates,” “believes,” or “estimates,” or the negatives of these terms, and similar expressions. Forward-looking statements reflect Unigestion’s views as of such date with respect to possible future events and are subject to a number of risks and uncertainties, including, but not limited to, the impact of competitive products, market acceptance risks and other risks. Actual results could differ materially from those in the forward-looking statements as a result of factors beyond a strategy’s or Unigestion’s control. You are cautioned not to place undue reliance on such statements. No party has an obligation to update any of the forward-looking statements in this document.
TARGET RETURNS
Targeted returns reflect subjective determinations by Unigestion based on a variety of factors, including, among others, internal modeling, investment strategy, prior performance of similar products (if any), volatility measures, risk tolerance and market conditions. Target returns and/or forecasts are based on Unigestion’s analytics including upside, base and downside scenarios and might include, but are not limited to, criteria and assumptions such as macro environment, enterprise value, turnover, EBITDA, debt, financial multiples and cash flows. Targeted returns are not intended to be actual performance and should not be relied upon as an indication of actual or future performance.
If target returns, forecasts or projections are shown gross of management fees, the inclusion of fees, costs and charges will reduce such numbers.
USE OF INDICES
Information about any indices shown herein is provided to allow for comparison of the performance of the strategy to that of certain well-known and widely recognized indices. There is no representation that such index is an appropriate benchmark for such comparison. You cannot invest directly in an index and the indices represented do not take into account trading commissions and/or other brokerage or custodial costs. The volatility of the indices may be materially different from that of the strategy. In addition, the strategy’s holdings may differ substantially from the securities that comprise the indices shown.
HYPOTHETICAL, BACKTESTED OR SIMULATED PERFORMANCE
Hypothetical, backtested or simulated performance is not an indicator of future actual results and has many inherent limitations. The results reflect performance of a strategy not currently offered to any investor and do not represent returns that any investor actually attained. One of the limitations of hypothetical performance results is that they are generally prepared with the benefit of hindsight.
Hypothetical performance may use, among other factors, historical financials (turnover, EBITDA, debit, financial multiples), historical valuations, macro variables and fund manager variables. Hypothetical results are calculated by the retroactive application of a model constructed on the basis of historical data and based on assumptions integral to the model which may or may not be testable and are subject to losses. Changes in these assumptions may have a material impact on the hypothetical (backtested/simulated) returns presented. Certain assumptions have been made for modeling purposes and are unlikely to be realized. No representations and warranties are made as to the reasonableness of the assumptions.
This information is provided for illustrative purposes only. Specifically, hypothetical (backtested/simulated) results do not reflect actual trading or the effect of material economic and market factors on the decision-making process. Hypothetical trading does not involve financial risk, and no hypothetical trading record can completely account for the impact of financial risk in actual trading. For example, the ability to withstand losses or to adhere to a particular trading program in spite of trading losses are material points which can also adversely affect actual trading results. Since trades have not actually been executed, results may have under- or over-compensated for the impact, if any, of certain market factors, such as lack of liquidity, and may not reflect the impact that certain economic or market factors may have had on the decision-making process. Further, backtesting allows the security selection methodology to be adjusted until past returns are maximized.
If hypothetical, backtested or simulated performance is shown gross of management fees, the inclusion of fees, costs and charges will reduce such numbers.
ASSESSMENTS
Unigestion may, based on its internal analysis, make assessments of a company’s future potential as a market leader or other success. There is no guarantee that this will be realised.
Legal Entities Disseminating This Document
UNITED KINGDOM
This material is disseminated in the United Kingdom by Unigestion (UK) Ltd., which is authorized and regulated by the Financial Conduct Authority (“FCA”). This information is intended only for professional clients and eligible counterparties, as defined in MiFID directive and has therefore not been adapted to retail clients.
UNITED STATES
In the United States, Unigestion is present and offers its services in the United States as Unigestion (US) Ltd, which is registered as an investment advisor with the U.S. Securities and Exchange Commission (“SEC”) and/or as Unigestion (UK) Ltd., which is registered as an investment advisor with the SEC. All inquires from investors present in the United States should be directed to clients@unigestion.com. This information is intended only for institutional clients that are qualified purchasers as defined by the SEC and has therefore not been adapted to retail clients.
EUROPEAN UNION
This material is disseminated in the European Union by Unigestion Asset Management (France) SA which is authorized and regulated by the French “Autorité des Marchés Financiers” (“AMF”).
This information is intended only for professional clients and eligible counterparties, as defined in the MiFID directive and has therefore not been adapted to retail clients.
CANADA
This material is disseminated in Canada by Unigestion Asset Management (Canada) Inc. which is registered as a portfolio manager and/or exempt market dealer in nine provinces across Canada and also as an investment fund manager in Ontario, Quebec and Newfoundland & Labrador. Its principal regulator is the Ontario Securities Commission (“OSC”). This material may also be distributed by Unigestion SA which has an international advisor exemption in Quebec, Saskatchewan and Ontario. Unigestion SA’s assets are situated outside of Canada and, as such, there may be difficulty enforcing legal rights against it.
SWITZERLAND
This material is disseminated in Switzerland by Unigestion SA which is authorized and regulated by the Swiss Financial Market Supervisory Authority (“FINMA”).
Related insight
- Private equity
- Corporate
Unigestion has won “Private Equity Manager of the Year” at the European Pensions Awards 2025. The award, which Unigestion has now won seven times, recognises our expertise in the private equity space and our passion for helping Europe’s pension funds get the most from this complex area of the market.
[…]- Equities
- Press releases
Kepler Cheuvreux and Unigestion have now received all regulatory approvals ahead of the launch of Kepler Unigestion, a new partnership focused on quantitative strategies for listed equities.
[…]- Equities
- Webinar
Watch as our excellent panelists, Fundamental Analysts Fleura Shiyanova and Joachim Hermann, dissect the potential impact of renewed trade tensions, policy volatility and market sentiment swings – all hallmarks of the Trump playbook.
[…]- Equities
- Perspectives
Emerging managers, those who are launching their first or second funds, are often viewed sceptically by investors. However, these perceptions are often rooted in myth, not reality.
[…]