- Equities
- Papers
- Perspectives

Alexandre Marquis, CFA
Equities, Executive Director,
Head of Client Portfolio Management
- We have seen the most concentrated rally for the past 25 years but the ‘Magnificent 7’ have lost a bit of their shine recently.
- Investors would be wise to consider the MSCI ACWI ex ‘Magnificent 7’ in a careful way as we approach a pivotal period for equities.
- A regime where interest rates stabilise at a high level is usually favourable to our strategies.
Overview
After a horrendous 2022, where equities and bonds were hammered and the only safe haven appeared to be oil producers and commodities, 2023 has seen a revival of optimism in developed equity markets, while emerging markets have continued to suffer from the sluggish environment in China.
A banking crisis, Russian conflict, tensions around Taiwan…..nothing has seemed bad enough to end the market’s faith in the ‘soft landing’ story, the peak of the tightening cycle and the miracle of AI. Still, investors participated in one of the narrowest markets ever seen in the US and everyone become used to the new stock cluster name: the ‘Magnificent 7s’. Everyone investing in US or global equities and underweight / absent from those mega caps have likely felt tremendous pain in terms of relative performance in 2023. However, outside of the US this effect has been much more muted.
The rise (and fall?) of the “Magnificent 7”
2023 has not been kind to the Growth factors as rising interest rates have put huge pressure on stocks with stretched valuations. Hence, the opinion held by some investors that the tightening cycle was coming to an end acted as a strong tailwind for the fallen angels of the previous year. Additionally, the successful launch of ChatGPT by OpenAI triggered a buying frenzy on the AI theme, propelling semiconductors, in particular GPU producers like Nvidia, through the roof! The mega caps in the US, all claiming to research/develop/provide AI features in their offering, benefited from the same enthusiasm for the most concentrated market rally seen over the past 25 years as shown in Chart 1. It was even more concentrated than the Covid period and the TMT bubble.
Chart 1: Share of the seven largest contributors to MSCI USA calendar performance
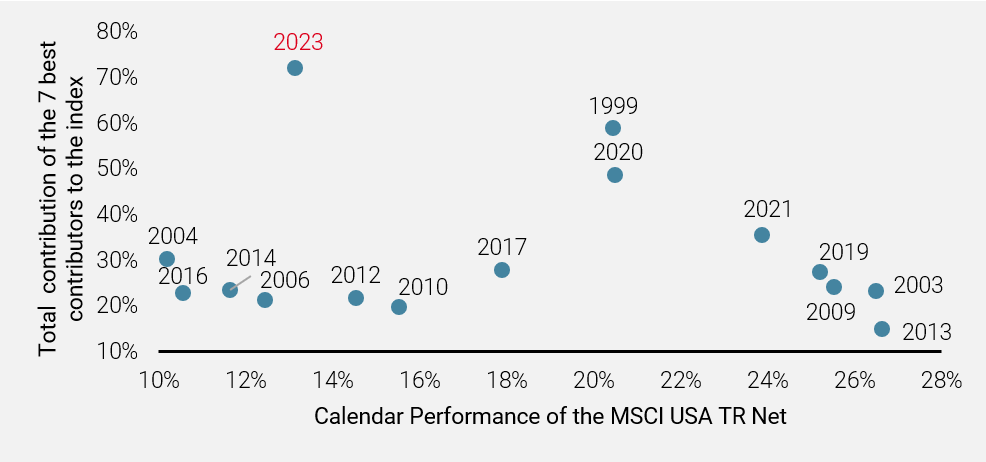
Chart 1: Share of the seven largest contributors to MSCI USA calendar performance
This very narrow leadership has massively distorted the typical analysis one can undertake on which risk factors are driving the market. Indeed, when looking at style performances in the US, and computing the equivalent without the influence of the magnificent 7, the picture changes dramatically, as shown in Chart 2.
Chart 2: Performance of style factors within MSCI USA in 2023 with and without the “Magnificent 7”.
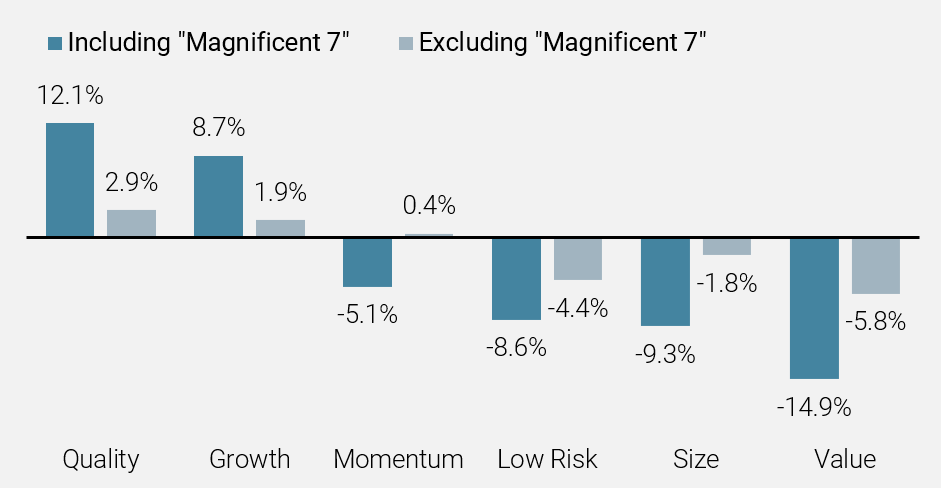
Source: Unigestion, MSCI. Data as of 31.07.2023
While the first seven months of the year have paved the way for this outstanding rally, it seems that the end of summer has been less kind to ‘big tech’, in the midst of further concerns over China, very stretched valuations in the tech space, a looming student debt cliff and an increasingly uncertain trajectory for the Fed. Hence we’ve seen the Magnificent 7 lose a bit of their shine over the past two months, as shown in chart 3.
Chart 3: Performance pattern of the Magnificent 7 and the MSCI USA in 2023.
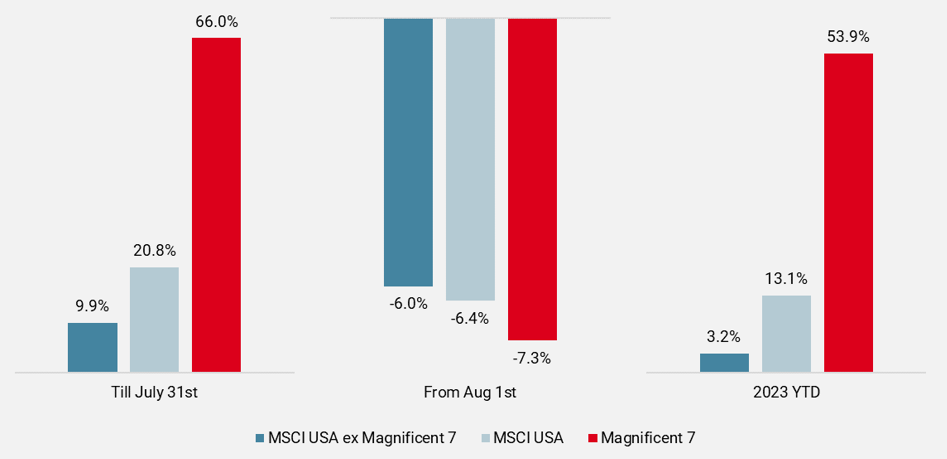
Source: Unigestion, MSCI. Data as of 30.09.2023
Wider impact on global indices
As the Magnificent 7 reach a peak in terms of market capitalisation, the narrow leadership is being felt in the more developed indices, such as the MSCI World Index, or even the MSCI ACWI Index. But local indices without such a large exposure to the theme, such as the MSCI Europe Index and the MSCI Emerging Markets Index have lived a very different story in 2023.
Indeed, the positve performance of Quality has been much more muted across the globe when we neutralise the impact of the Magnificent 7 (chart 4).
Chart 4: Performance of the Quality factor in 2023
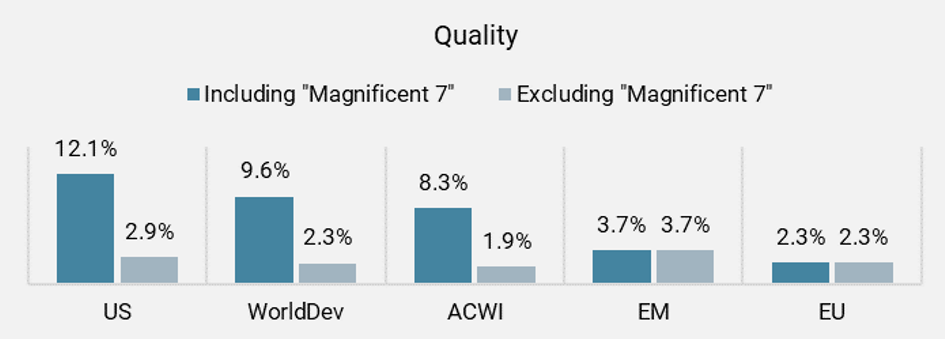
Source: Unigestion, MSCI. Data as of 30.09.2023
Likewise Growth has seen no positive behaviour so far when the Magnificent 7 are excluded (Chart 5).
Chart 5: Performance of the Growth factor in 2023
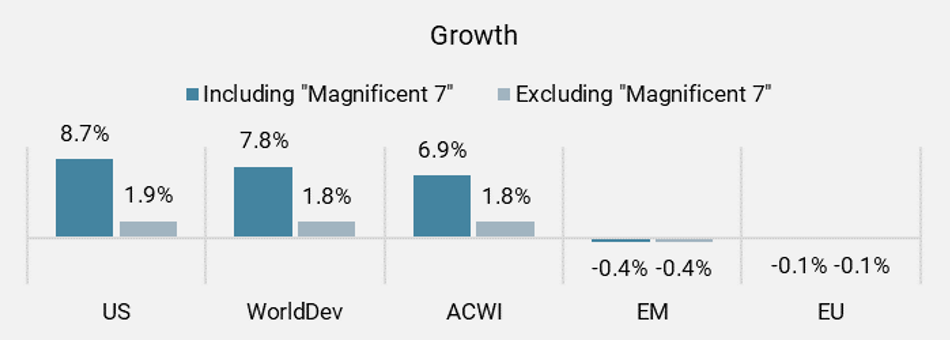
Source: Unigestion, MSCI. Data as of 30.09.2023
Low risk experienced fewer headwinds in US/Global markets, especially as it proved supportive in emerging markets and Europe (Chart 6).
Chart 6: Performance of the Low Risk factor in 2023
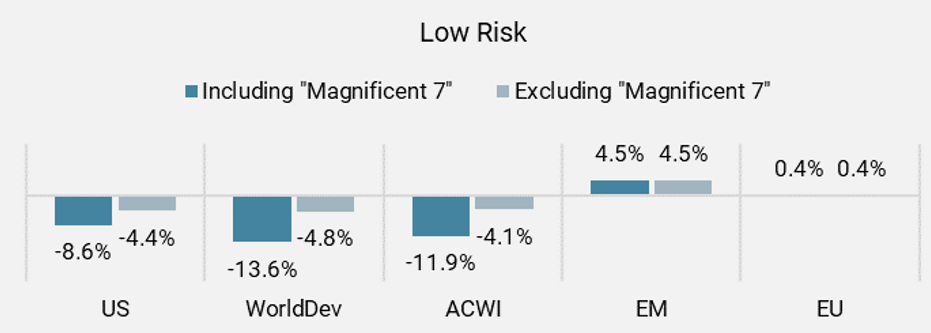
Source: Unigestion, MSCI. Data as of 30.09.2023
Likewise, Value did not suffer as much as one might have imagined, once again supported by a much better profile in non-tech US names, and in other regions.(Chart 7).
Chart 7: Performance of the Value factor in 2023
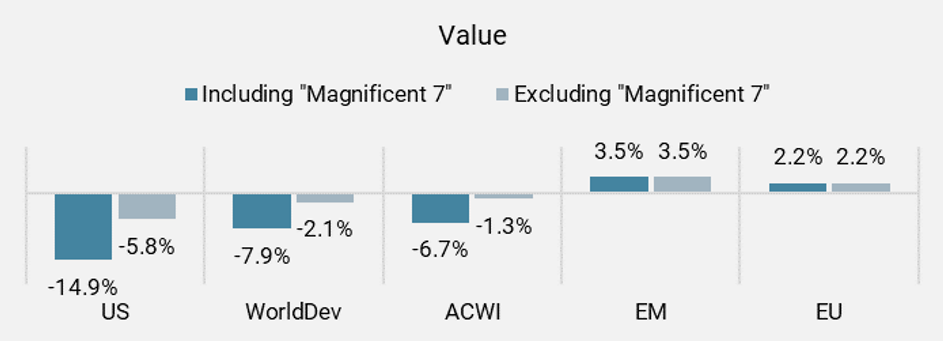
Source: Unigestion, MSCI. Data as of 30.09.2023
Hence, behind the tsunami of the Magnificent 7 which appears to be receding, a second wave – more quiet, more subtle – is currently at play. Investors would be wise to consider the MSCI ACWI ex Magnificent 7 in a careful way as we approach a pivotal period for equities.
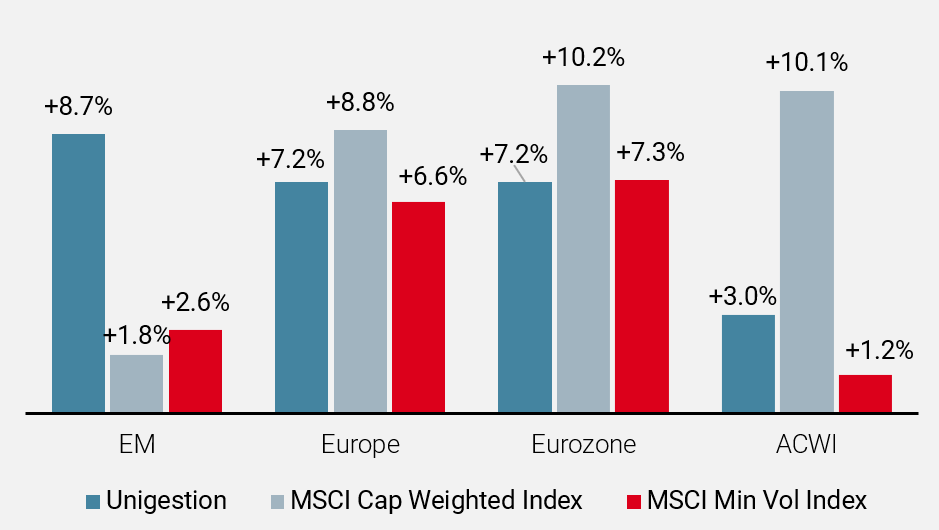
To summarise, when setting the “Magnificent 7” apart, we see (Chart 8):
- Growth has not performed particularly well across regions
- Low Vol has been strong in emerging markets and ok in Europe
- Quality is doing ok across regions, but does not show the same stellar figures when boosted by the Magnificent 7.
Chart 8: Performance of the style factors in 2023, removing the “Magnificent 7”
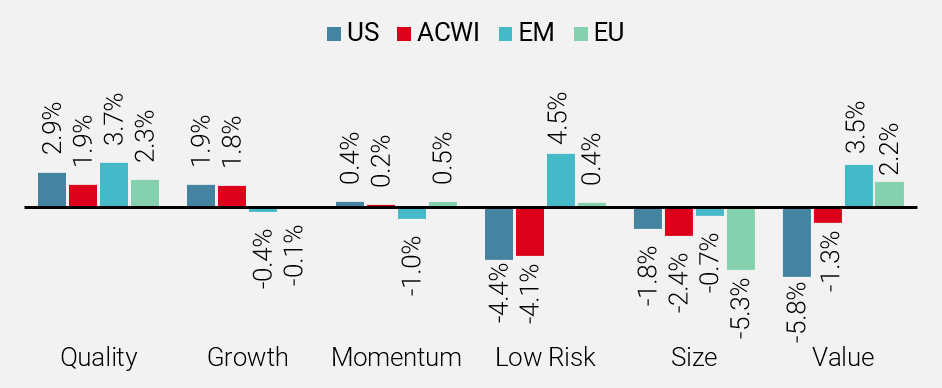
Source: Unigestion, MSCI. Data as of 30.09.2023
Consequently, our strategies – which combine a sophisticated low risk approach associated with adequate controls on Quality, Value and Momentum – are very well positioned to navigate an environment where resilience will be key, as we evidence in the following section.
Riding the quiet wave ?
Across our defensive strategy suite, our portfolios have navigated the turbulence of 2023 pretty well, even if our global strategy suffered – at least for now – from its strong underweight within the Magnificent 7.
Chart 9: Performance of Unigestion flagship funds in 2023
Source: Unigestion, MSCI. Data as of 30.09.2023. Past performance is not indicative of future results. Performance is stated gross fees, in the respective base currency of each strategy.
Hence, we have delivered pretty decent results so far this year (Chart 9), with:
- Our ACWI strategy delivering almost 100% of the rise of the market ex Magnificent 7.
- Our Europe/Eurozone strategies delivering solid upside capture in a strong up market (and even more solid when taking ASML – the European cousin of the Magnificent 7 – out of the picture)
- Our Emerging Markets strategy delivering very strong performance, by capturing the solid returns of emerging markets ex-China, and defensive plays within China.
A good entry point for “Low Vol” investors ?
As we are now in a regime where interest rates should stay higher for longer, we believe our strategies should perform well for the coming quarters/years.
Looking at the full rate of interest rates cycle, we know our strategies tends to suffer during the first weeks/months when interest rates start to increase. However, this is usually short lived and then rising interest rates do not have much of an influence over relative performance.
Nonetheless, a regime where interest rates stabilise at a high level is usually favourable to our strategies as high interest rates penalise the valuation of high growth companies (given the value of their future earnings is strongly diminished by a high discount rate). Companies which are by nature more defensive, with less uncertainty around their earnings growth, are becoming very attractive for investors as visibility on the true value of their earnings is much greater.
The second effect is coming from leverage. Many companies usually attempt to benefit from low interest rates periods to boost their profitability by increasing leverage and using it either to fuel capex, or to return capital to investors through share buyback programs. However, when we shift to a high interest rate regime, those companies face a significant impact on the serving of their financial debt, combined with a more restricted ability to refinance their leverage because of tighter financial conditions. This is typically the type of companies our strategy seeks to avoid; hence our relative performance usually benefits from avoiding those ailing stocks.
For example, below is the realised performance (average monthly excess return) of our European equity strategy during periods of low/medium/high interest rates, and also looking at the three-month trend (rising –stable – falling). We clearly see (Chart 10) that high interest rates create a positive regime, and falling interest rates are also very supportive.
Chart 10: Historical behaviour of our European strategy during various rate regimes
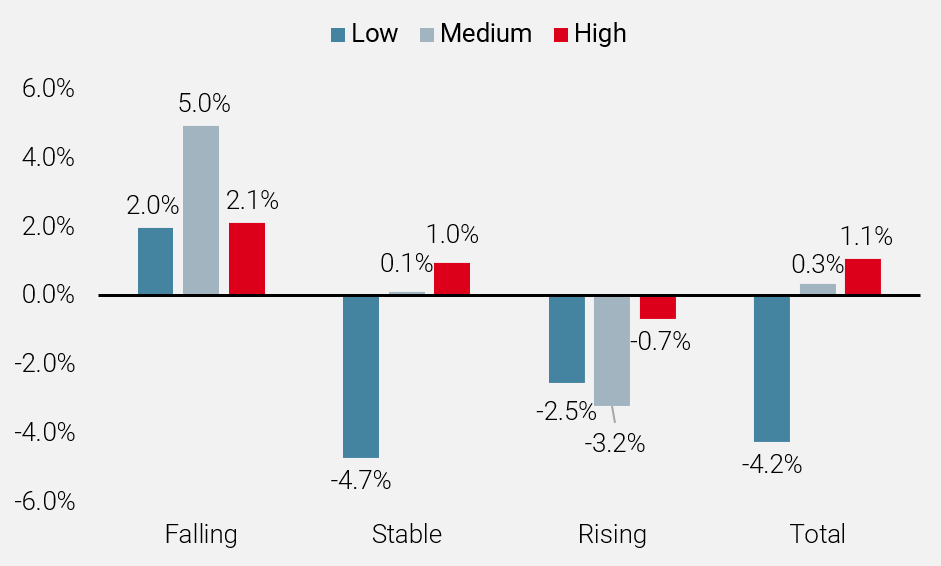
Source: Unigestion, Bloomberg. Data as of 5 October 2023. Average relative strategy of our European strategy, gross of fees, over the next 3 months versus MSCI Europe TR Net USD, from 31.05.2004 to 30.09.2023. Low = Yields below 2%. Medium = Yields ranging from 2% to 4%. High = Rates above 4%. Falling Yields: Yields falling by more than 30bps over the next 3 months. Stable Yield. Yields being in a range of +/-30 bps versus current yield over the next 3 month. Rising Yield :yields increasing by more than 30 bps over the next 3 months.
Important information
INFORMATION ONLY FOR YOU
This document has been prepared for your information only and must not be distributed, published, reproduced or disclosed (in whole or in part) by recipients to any other person without the prior written consent of Unigestion. It is neither directed to, nor intended for distribution or use by, any person or entity who is a citizen or resident of, or domiciled or located in, any locality, state, country or jurisdiction where such distribution, publication, availability or use would be contrary to law or regulation.
RELIANCE ON UNIGESTION
There is no guarantee that Unigestion will be successful in achieving any investment objectives. An investment strategy contains risks, including the risk of complete loss.
Except where otherwise specifically noted, the information contained herein, including performance data and assets under management, relates to the entire affiliated group of Unigestion entities over time. Such information is intended to provide you with background regarding the services, investment strategies and personnel of the Unigestion entities. No guarantee is made that all or any of the individuals involved in generating the performance on behalf of one or more Unigestion entities will be involved in managing any specific client account on behalf of another Unigestion entity.
NOT A RECOMMENDATION OR OFFER
This is a promotional statement of our investment philosophy and services only in relation to the subject matter of this presentation. It constitutes neither investment advice nor recommendation. This document represents no offer, solicitation or suggestion of suitability to subscribe in either the investment vehicles to which it refers or to any securities or financial instruments described herein. Any such offer to sell or solicitation of an offer to purchase shall be made only by formal offering documents, which include, among others, a confidential offering memorandum, limited partnership agreement (if applicable), investment management agreement (if applicable), operating agreement (if applicable), and related subscription documents (if applicable). Such documentation contains additional information material to any decision to invest. Please contact your professional adviser/consultant before making an investment decision.
Reference to specific securities should not be construed as a recommendation to buy or sell such securities and is included for illustration purposes only.
RISKS
Where possible we aim to disclose the material risks pertinent to this document. The views expressed in this document do not purport to be a complete description of the securities, markets and developments referred to in it. Unigestion maintains the right to delete or modify information without prior notice. The risk management practices and methods described herein are for illustrative purposes only and are subject to modification.
Investors shall conduct their own analysis of the risks (including any legal, regulatory, tax or other consequences) associated with an investment and should seek independent professional advice. Some of the investment strategies or financial instruments described or alluded to herein may be construed as high risk and not readily realisable investments, and may experience substantial & sudden losses including total loss of investment. These are not suitable for all types of investors. Unigestion has the ability in its sole discretion to change the strategies described herein.
PAST PERFORMANCE
Past performance is not a reliable indicator of future results, the value of investments, can fall as well as rise, and there is no guarantee that your initial investment will be returned. Returns may increase or decrease as a result of currency fluctuations.
NO INDEPENDENT VERIFICATION OR REPRESENTATION
No separate verification has been made as to the accuracy or completeness of the information herein. Data and graphical information herein are for information only and may have been derived from third party sources. Unigestion takes reasonable steps to verify, but does not guarantee, the accuracy and completeness of information from third party sources. As a result, no representation or warranty, expressed or implied, is or will be made by Unigestion in this respect and no responsibility or liability is or will be accepted. All information provided here is subject to change without notice. It should only be considered current as of the date of publication without regard to the date on which you may access the information. An investment with Unigestion, like all investments, contains risks, including total loss for the investor.
FORWARD-LOOKING STATEMENTS
This document may contain forward-looking statements, including observations about markets and industry and regulatory trends as of the original date of this document. Forward-looking statements may be identified by, among other things, the use of words such as “expects,” “anticipates,” “believes,” or “estimates,” or the negatives of these terms, and similar expressions. Forward-looking statements reflect Unigestion’s views as of such date with respect to possible future events and are subject to a number of risks and uncertainties, including, but not limited to, the impact of competitive products, market acceptance risks and other risks. Actual results could differ materially from those in the forward-looking statements as a result of factors beyond a strategy’s or Unigestion’s control. You are cautioned not to place undue reliance on such statements. No party has an obligation to update any of the forward-looking statements in this document.
TARGET RETURNS
Targeted returns reflect subjective determinations by Unigestion based on a variety of factors, including, among others, internal modeling, investment strategy, prior performance of similar products (if any), volatility measures, risk tolerance and market conditions. Target returns are based on Unigestion’s analytics including upside, base and downside scenarios and might include, but are not limited to, criteria and assumptions such as macro environment, enterprise value, turnover, EBITDA, debt, financial multiples and cash flows. Targeted returns are not intended to be actual performance and should not be relied upon as an indication of actual or future performance.
USE OF INDICES
Information about any indices shown herein is provided to allow for comparison of the performance of the strategy to that of certain well-known and widely recognized indices. There is no representation that such index is an appropriate benchmark for such comparison. You cannot invest directly in an index and the indices represented do not take into account trading commissions and/or other brokerage or custodial costs. The volatility of the indices may be materially different from that of the strategy. In addition, the strategy’s holdings may differ substantially from the securities that comprise the indices shown.
ASSESSMENTS
Unigestion may, based on its internal analysis, make assessments of a company’s future potential as a market leader or other success. There is no guarantee that this will be realised.
No prospectus has been filed with a Canadian securities regulatory authority to qualify the distribution of units of this fund and no such authority has expressed an opinion about these securities. Accordingly, their units may not be offered or distributed in Canada except to permitted clients who benefit from an exemption from the requirement to deliver a prospectus under securities legislation and where such offer or distribution would be prohibited by law. All investors must obtain and carefully read the applicable offering memorandum which contains additional information needed to evaluate the potential investment and provides important disclosures regarding risks, fees and expenses.
Legal Entities Disseminating This Document
United Kingdom
This material is disseminated in the United Kingdom by Unigestion (UK) Ltd., which is authorized and regulated by the Financial Conduct Authority (“FCA”).
This information is intended only for professional clients and eligible counterparties, as defined in MiFID directive and has therefore not been adapted to retail clients.
United States
In the United States, Unigestion is present and offers its services in the United States as Unigestion (US) Ltd, which is registered as an investment advisor with the U.S. Securities and Exchange Commission (“SEC”) and/or as Unigestion (UK) Ltd., which is registered as an investment advisor with the SEC. All inquiries from investors present in the United States should be directed to clients@unigestion.com. This information is intended only for institutional clients that are qualified purchasers as defined by the SEC and has therefore not been adapted to retail clients.
European Union
This material is disseminated in the European Union by Unigestion Asset Management (France) SA which is authorized and regulated by the French “Autorité des Marchés Financiers” (“AMF”).
This information is intended only for professional clients and eligible counterparties, as defined in the MiFID directive and has therefore not been adapted to retail clients.
Canada
This material is disseminated in Canada by Unigestion Asset Management (Canada) Inc. which is registered as a portfolio manager and/or exempt market dealer in nine provinces across Canada and also as an investment fund manager in Ontario, Quebec and Newfoundland & Labrador. Its principal regulator is the Ontario Securities Commission (“OSC”).
This material may also be distributed by Unigestion SA which has an international advisor exemption in Quebec, Saskatchewan and Ontario. Unigestion SA’s assets are situated outside of Canada and, as such, there may be difficulty enforcing legal rights against it.
Switzerland
This material is disseminated in Switzerland by Unigestion SA which is authorized and regulated by the Swiss Financial Market Supervisory Authority (“FINMA”).
Document issued May 2024.
Related insight
- Equities
- Press releases
Kepler Cheuvreux and Unigestion have now received all regulatory approvals ahead of the launch of Kepler Unigestion, a new partnership focused on quantitative strategies for listed equities.
[…]- Equities
- Webinar
Watch as our excellent panelists, Fundamental Analysts Fleura Shiyanova and Joachim Hermann, dissect the potential impact of renewed trade tensions, policy volatility and market sentiment swings – all hallmarks of the Trump playbook.
[…]- Equities
- Perspectives
Emerging managers, those who are launching their first or second funds, are often viewed sceptically by investors. However, these perceptions are often rooted in myth, not reality.
[…]- Corporate
- Press releases
Unigestion, the asset manager focused on private equity’s mid-market leaders, has announced the first close of its third Emerging Manager Choice Fund (EMC III) at EUR 275m. This first closing comes at more than two-thirds of the Fund’s EUR 400m target size.
[…]