- Private equity
- Papers
- Perspectives
Authors
Borja Fernández Tamayo, Vice President, Private Equity, Unigestion
Natalia Sigrist, Partner, Private Equity, Unigestion
Reiner Braun, Universität München, School of Management
Florencio López-de-Silanes, Université Côte d’Azur SKEMA Business School and NBER
Ludovic Phalippou, University of Oxford, Said Business School
- Machine learning algorithms can use both qualitative and quantitative information available to LPs to effectively predict the performance of private equity investments.
- Large language models are effective in extracting valuable insights from qualitative data, such as quarterly reports, and translating them into actionable indicators of future performance.
- In our model, Report Tone and EBITDA Margin Growth are the most influential positive performance predictors, while higher Markdown (%) and Realisation (%) are linked to lower future returns.
Overview
Monitoring the performance of private equity funds is a critical responsibility for Limited Partners (LPs), as it plays a key role in shaping investment decisions throughout the life of a fund. General Partners (GPs) assist LPs in this process by periodically providing detailed reports, with the Multiple on Invested Cost (MOIC) serving as a key metric summarising fund performance. However, the MOIC alone offers a limited snapshot of the fund’s unrealised and realised value.
To provide more context, GPs also include additional financial figures (e.g., sales, EBITDA) and qualitative insights (e.g., drivers of growth, strategic initiatives, and market conditions) about underlying portoflio companies. Such reports help LPs accurately assess a GP’s ability to deliver consistent value over time and whether these assets are positioned for growth. It also supports risk management assessment, provides a deeper understanding of the portfolio’s overall health and, allows LPs to ensure the GP’s investment strategy aligns with broader portfolio diversification goals.
In this paper, we analyse a unique dataset of semi-annual fund reports sent by 162 GPs to Unigestion between June 2000 and June 20241. We employ Natural Language Processing (NLP) to transform the qualitative information in these reports into a summary statistic that captures the GP’s tone toward each portfolio company over time and assess the differences in this tone when GPs are fundraising or not. This enables us to examine whether qualitative data can complement quantitative metrics, such as MOICs, and provide a more comprehensive view of performance to LPs.
Next, we leverage machine learning (ML) algorithms to evaluate how combining qualitative and quantitative information, such as tone and interim performance, can enhance the ability to predict the performance of portfolio companies. This integrated approach provides LPs with a powerful tool for improving the accuracy of performance forecasts, thus supporting more informed decision-making around re-ups, secondary transactions, and broader portfolio management.
Report tone and quantitative information
In the first part of this paper, we explore the relationship between the tone of the reports (Report Tone) and their quantitative metrics. To achieve this we leverage FinBERT, a financial language model developed by Wang and Yang (2023). FinBERT adapts Google’s BERT model, specifically trained for the finance domain, to capture and quantify the tone of GP reports2. Report Tone enables us to evaluate the relationship between the GPs’ narrative descriptions of portfolio companies and performance-related metrics, such as Interim MOIC, MOIC Uplift (exit MOIC – Interim MOIC), Staleness (%) (percentage of past periods without change in MOIC), Markdown (%) (percentage of past periods with MOIC markdown), and Realisation (%) (ratio of all capital distributions to the sum of capital distributions and the last reported Fair Market Value, excluding fees).
Table 1 shows correlations between Report Tone and performance-related metrics. It reveals that higher Interim MOICs are positively associated with a more favourable Report Tone, increased Realisation (%) and some degree of MOIC Uplift. However, the strength of this positive relationship is notably greater for Report Tone and Realisation than for MOIC Uplift, where the effect is more limited. Additionally, a positive Report Tone correlates with fewer markdowns and higher future performance. Notably, more frequent markdowns are associated with lower Interim MOICs and diminished future uplifts. These patterns suggest that the tone of reports and current valuations can provide valuable insights into future performance, with positive reports typically leading to better outcomes.
Table 1: Correlation matrix of Interim MOIC, MOIC Uplift, Staleness (%), Markdown (%), Realisation (%) and Report Tone3
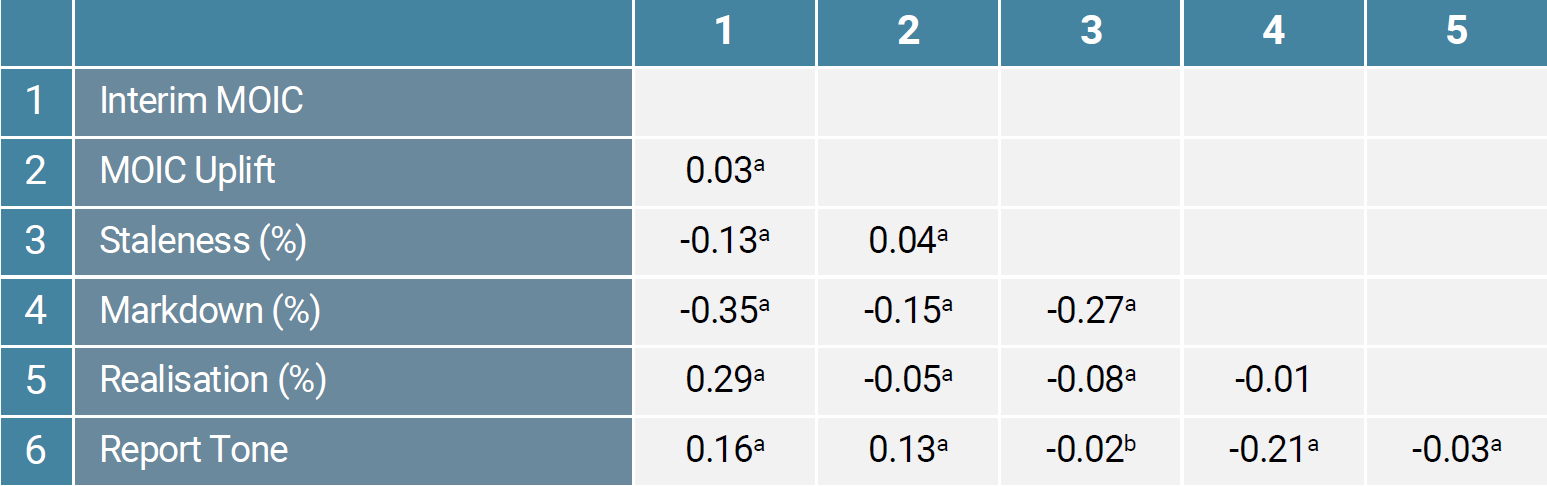
Source: Unigestion
Table 2 presents the average MOIC Uplift and MOIC variation (Mark-up, Stale, Mark-down) across different Report Tone categories (Positive, Neutral, Negative). The results highlight a significant relationship between the tone of reports and subsequent MOIC changes. Positive-toned reports are associated with the highest proportion of mark-ups (43.5%) and the largest mean MOIC uplift (0.86x, significant at 1% level compared to Negative-toned reports). Neutral reports show a more balanced distribution of valuation changes and a moderate uplift (0.64x). In contrast, negative reports have the highest proportion of mark-downs (38.6%) and the lowest mean uplift (0.34x). Overall, there’s a tendency towards mark-ups (39.4%) over mark-downs (23.3%), with a positive aggregate mean MOIC uplift (0.75x).
Table 2: MOIC Uplift and MOIC changes across Report Tone categorie4
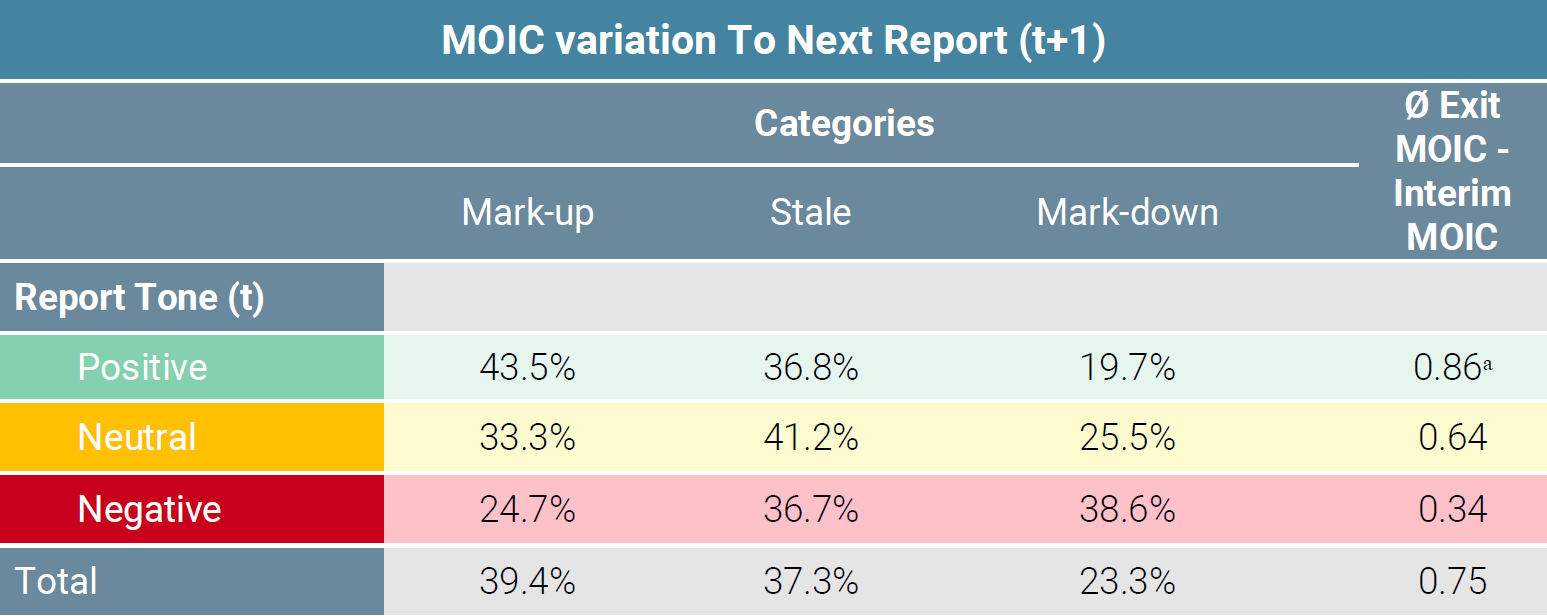
Source: Unigestion
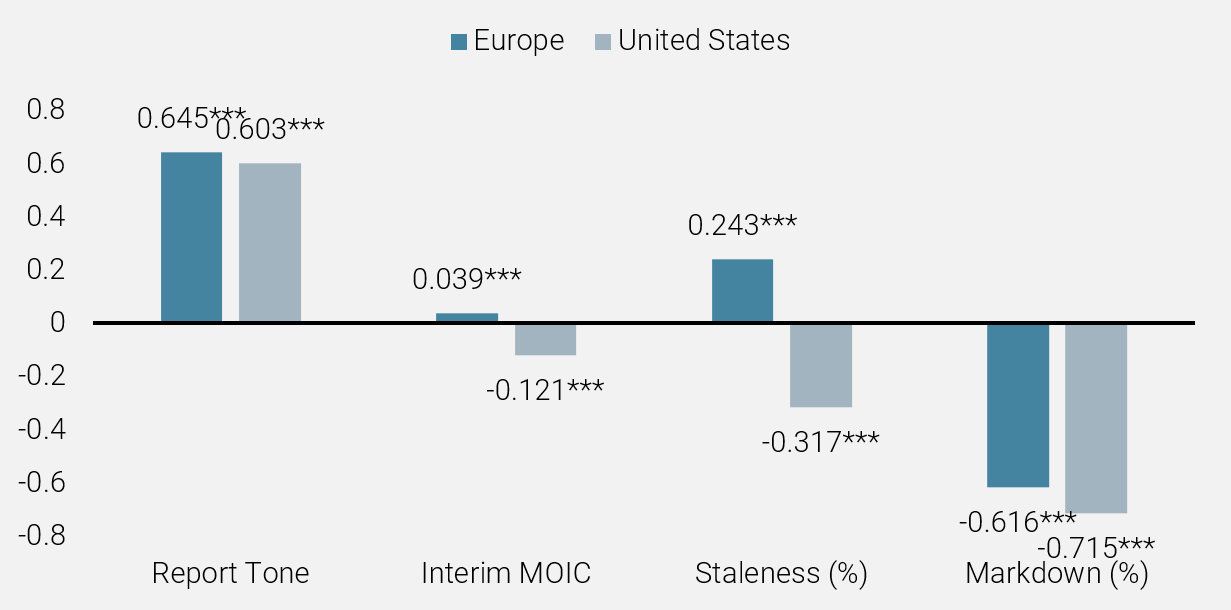
One of the benefits of being a global investor is the ability to compare the relationship betweeen Report Tone and performance metrics across the two most active regional private equity markets in the world: Europe and United States. Figure 1 illustrates how performance-related metrics and Report Tone are associated with MOIC uplift. This analysis takes into consideration various factors, including deal-level performance metrics (e.g., realisation status), industry, region, deal-level financial metrics (e.g., sales growth, EBITDA margin growth, valuation growth), and fund-level controls (e.g., fund size, fund sequence, fund age).
The coefficient of a variable (e.g., Interim MOIC) indicates how changes in that variable relate to changes in MOIC uplift, accounting for all these other factors, across regions. Positive Report Tone is a predictor of better performance in both regions, with slightly stronger effects observed in Europe than in the United States. Conversely, Markdown Frequency exhibits a negative relationship with MOIC Uplift in both regions. Interestingly, MOIC Staleness Frequency and Interim MOIC shows contrasting effects: they are slightly positive in Europe but negative in the United States.
These findings suggest that while there are similar trends in how tone relates to performance across both markets, distinct regional differences in valuation practices and market dynamics emerge, with Europe appearing more conservative overall.
Figure 1: Europe versus North America5
Source: Unigestion
Can Report Tone uncover reporting tricks during fundraising?
GPs typically raise a new fund every three to five years in order to continue investing and secure management fees. Previous literature shows that some GPs inflate interim performance when raising a follow-on fund. While Table 1 suggests that GPs use their tone to communicate important information to LPs, we have dug deeper into fund reports to assess, using econometrics, how Report Tone and Interim MOIC evolve around the time of fundraising.
We examine the relationship between Report Tone and MOIC Uplift, accounting for various deal- and fund-related metrics described above, both during and outside fundraising periods. The results demonstrate that Report Tone remains a strong predictor of final performance, regardless of whether the GP is in a fundraising phase. However, the coefficient of tone is lower when the GP is not fundraising (71 % vs. 85 %). This reinforces our finding that GPs place greater emphasis on tone during fundraising periods. During these times, reports serve as a tool to influence LPs’ evaluations and boost confidence in future performance.
Overall, the findings highlight that LPs should be cautious about relying solely on Interim MOIC as a future performance indicator during fundraising periods, as these values may be less reflective of final outcomes, due to potential overvaluation. In contrast, Report Tone consistently provides meaningful insights into future performance.
Predicting private equity success: the power of Report Tone and Machine Learning
Based on the results shown in Tables 1 and 2 and Figure 1, both Report Tone and Interim MOIC provide valuable, yet distinct, signals about the final performance of investments. This nuanced relationship highlights the need for a more sophisticated approach to fully capture the interplay between these variables and their impact on final outcomes. Additionally, factors such as sales growth, valuation changes, and markdown frequency are likely to contribute to the shape of final performance.
To better leverage the richness of both qualitative and quantitative data, we propose the use of machine learning (ML) models to predict final investment performance. ML algorithms are particularly well-suited to this task as they can process large datasets with multiple interacting variables, detecting patterns that traditional methods might overlook. By integrating Interim MOIC, Report Tone, and other key performance metrics such as sales growth, EBITDA margin, and markdown frequency, ML models can dynamically assess the likelihood of different outcomes, accounting for both the GP’s narrative tone and quantitative trends.
In our analysis, we apply two commonly used techniques in this field: Lasso Regression and Random Forest6. Both techniques are used to predict a binary outperformance measure that benchmarks each deal’s final gross MOIC against the median final gross MOIC for its exit year to define outperformance. In this case, a binary indicator takes the value of one if a company outperforms, and zero otherwise. The algorithms are fed with a wide set of variables, including the Report Tone.
To ensure a rigorous and time-consistent analysis, we adopt a training-test split based on a cut-off period. Specifically, we train the models on deals realised prior to the cut-off date and test them on deals entered within one year after the cut-off date. For the years 2014 to 2020, the training sample consists of deals realised before this period, and the test sample includes deals realised by June 2024. This split ensures there is no look-ahead bias in our analysis, providing a realistic out-of-sample evaluation of the models’ predictive power.
Figure 2 shows the statistical and economic performance of applying the above process by training algorithms with information available one year after investing. The AUC scores7 (0.65 for Random Forest and 0.57 for Lasso) demonstrate that both models have comparable overall predictive accuracy. As far as economic returns are concerned, Random Forest model delivers the best results: deals predicted to outperform show an average MOIC uplift of 2.13x, whereas those predicted to underperform exhibit an average uplift of 1.20x.
Figure 2: MOIC Uplift of underperformers (MOIC uplift<median MOIC uplift) and outperformers (MOIC uplift≥ median MOIC uplift)
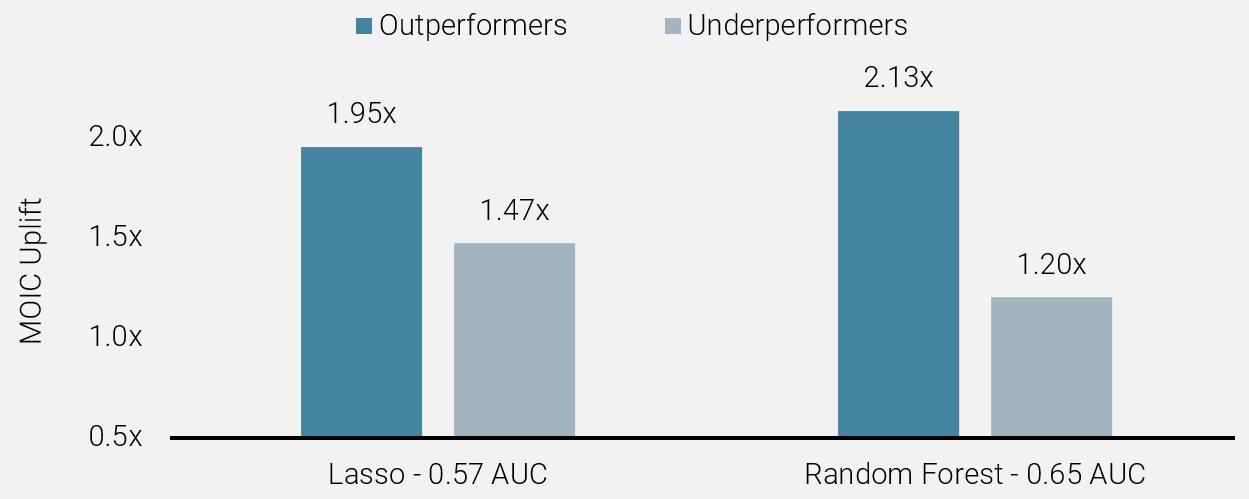
Source: Unigestion
For regression tasks (predicting MOIC Uplift), we train the algorithms to minimise the absolute difference between predicted values and actual values. Table 3 presents the Exit MOIC segmented by quartiles of Lasso-predicted Exit MOIC. It shows that ML models, trained on quantitative and qualitative information provided by GPs, can predict an investment’s final outcome very well.
For example, deals in the highest quartile of predicted outperformance deliver a median MOIC Uplift of 1.19x for the fund – 1.20x higher than the -0.01x median MOIC Uplift observed for deals in the lowest quartile. The difference in performance is significant even when we look at deals that have been in the portfolio for just one year (i.e., 1.53x).
Table 3: MOIC Uplift by Lasso
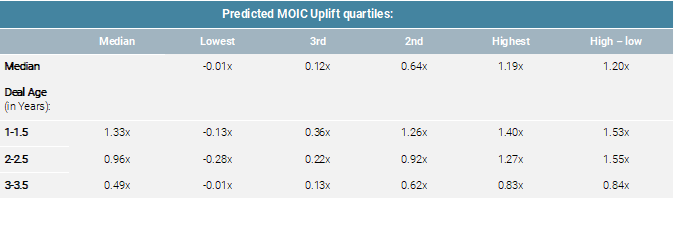
Source: Unigestion
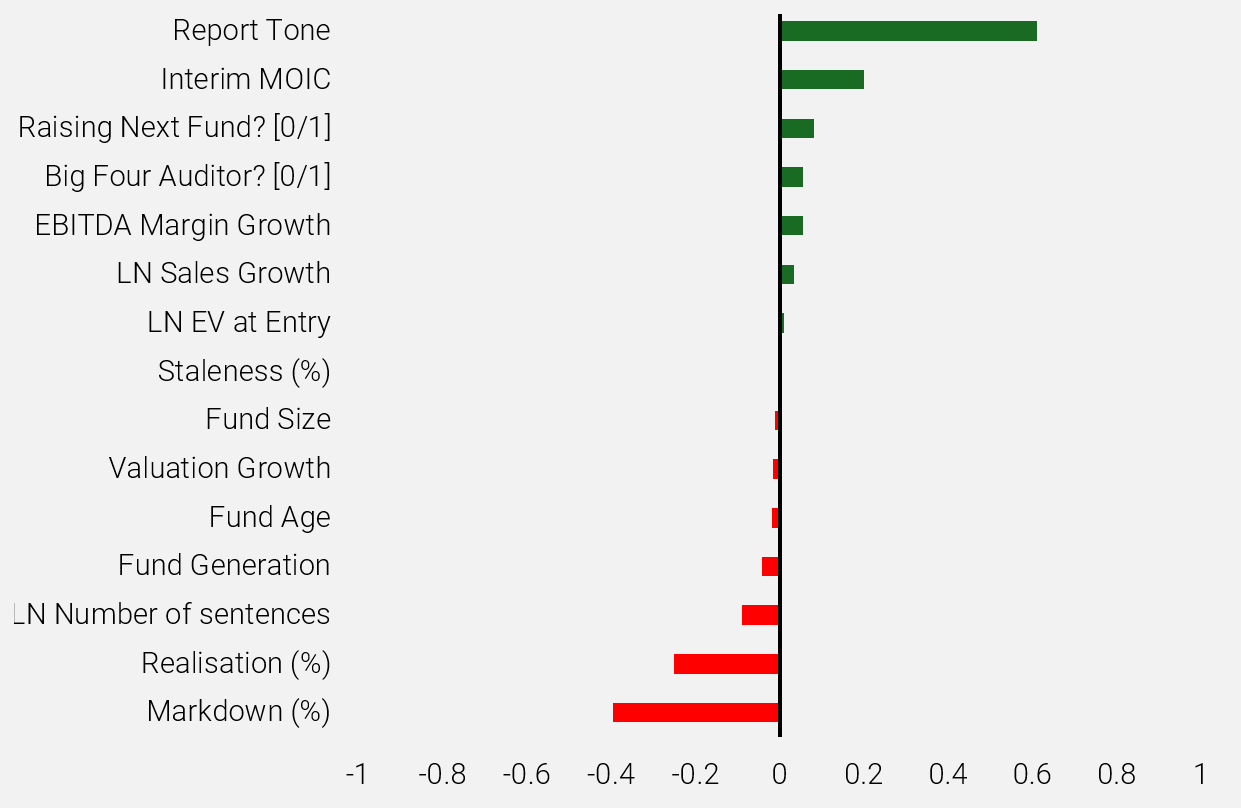
Key predictors of private equity performance
In this final section, we explore which factors have a stronger impact on the MOIC Uplift and whether this impact is positive or negative, as shown in Figure 4. We use the Lasso model trained to predict whether a deal will outperform the median MOIC Uplift (see Figure 3). The model identifies Report Tone and Interim MOIC as the most significant positive predictors of MOIC Uplift. Conversely, Markdown (%) and Realisation (%) have the most substantial negative impact on MOIC uplift. Other important factors include Sales Growth, Big Four Auditor, Fund Age, and Number of sentences although their influence is comparatively smaller. These results emphasise the importance of combining performance metrics with qualitative indicators to create a robust prediction of investment success starting just one year after the investment was made.
Figure 3: Most relevant variables to make predictions
Source: Unigestion
Conclusion
Our results indicate that the combination of qualitative and quantitative information available to LPs throughout a fund’s life can effectively signal its potential performance outcomes, even at the very early stages of investment (e.g. one year post-acquisition). Our study demonstrates the effectiveness of large language models (LLMs) in extracting valuable insights from qualitative information, such as the text in quarterly reports. Moreover, ML models prove to be powerful tools in maximising the value of this information, translating it into clear, actionable indicators of future performance. This makes them highly valuable for pricing secondary transactions and supporting portfolio management. Although this study focuses on buyout and growth capital deals, we believe these algorithms could also be beneficial in venture capital and other private capital asset classes.
References
Fernández Tamayo, B., Braun, R., Lopez-de-Silanes, F., Phalippou, L., & Sigrist, N. (2025). Would I lie to you? On Private Equity Intermediary Reports
Loughran, T., & McDonald, B. (2011). When is a liability not a liability? Textual analysis, dictionaries, and 10‐Ks. The Journal of Finance, 66(1), 35-65.
Huang, A. H., Wang, H., & Yang, Y. (2023). FinBERT: A large language model for extracting information from financial text. Contemporary Accounting Research, 40(2), 806-841.
1 See Fernández Tamayo, Braun, López-de-Silanes, Phalippou, and Sigrist (2025) for the academic paper.
2 Results remain unchanged if we use alternative measure of tone such as Financial-RoBERTa or the dictionary developed by Loughran and McDonald (2011).
3 Significance level: * p<0,10, ** p<0,05, *** p<0,01.
4 Significance level: * p<0,10, ** p<0,05, *** p<0,01.
5 Significance level: * p<0,10, ** p<0,05, *** p<0,01.
6 Lasso Regression is a linear model that provides coefficient estimates, which can be interpreted similarly to traditional regression, with the added benefit of regularisation to avoid overfitting. Random Forest, on the other hand, is a non-linear ensemble method that offers robust predictive power but lacks easily interpretable coefficients.
7 Area Under the Curve (ROC-AUC) metric that measures a model’s ability to distinguish between classes. A ROC-AUC score of 0.5 indicates a model that performs no better than random chance, while a score of 1 indicates perfect predictions.
Important information
INFORMATION ONLY FOR YOU
This document has been prepared for your information only and must not be distributed, published, reproduced or disclosed (in whole or in part) by recipients to any other person without the prior written consent of Unigestion. It is neither directed to, nor intended for distribution or use by, any person or entity who is a citizen or resident of, or domiciled or located in, any locality, state, country or jurisdiction where such distribution, publication, availability or use would be contrary to law or regulation.
RELIANCE ON UNIGESTION
There is no guarantee that Unigestion will be successful in achieving any investment objectives. An investment strategy contains risks, including the risk of complete loss.
Except where otherwise specifically noted, the information contained herein, including performance data and assets under management, relates to the entire affiliated group of Unigestion entities over time. Such information is intended to provide you with background regarding the services, investment strategies and personnel of the Unigestion entities. No guarantee is made that all or any of the individuals involved in generating the performance on behalf of one or more Unigestion entities will be involved in managing any specific client account on behalf of another Unigestion entity.
NOT A RECOMMENDATION OR OFFER
This is a promotional statement of our investment philosophy and services only in relation to the subject matter of this presentation. It constitutes neither investment advice nor recommendation. This document represents no offer, solicitation or suggestion of suitability to subscribe in either the investment vehicles to which it refers or to any securities or financial instruments described herein. Any such offer to sell or solicitation of an offer to purchase shall be made only by formal offering documents, which include, among others, a confidential offering memorandum, limited partnership agreement (if applicable), investment management agreement (if applicable), operating agreement (if applicable), and related subscription documents (if applicable). Such documentation contains additional information material to any decision to invest. Please contact your professional adviser/consultant before making an investment decision.
Reference to specific securities should not be construed as a recommendation to buy or sell such securities and is included for illustration purposes only.
RISKS
Where possible we aim to disclose the material risks pertinent to this document. The views expressed in this document do not purport to be a complete description of the securities, markets and developments referred to in it. Unigestion maintains the right to delete or modify information without prior notice. The risk management practices and methods described herein are for illustrative purposes only and are subject to modification.
Investors shall conduct their own analysis of the risks (including any legal, regulatory, tax or other consequences) associated with an investment and should seek independent professional advice. Some of the investment strategies or financial instruments described or alluded to herein may be construed as high risk and not readily realisable investments, and may experience substantial & sudden losses including total loss of investment. These are not suitable for all types of investors. Unigestion has the ability in its sole discretion to change the strategies described herein.
PAST PERFORMANCE
Past performance is not a reliable indicator of future results, the value of investments, can fall as well as rise, and there is no guarantee that your initial investment will be returned. Returns may increase or decrease as a result of currency fluctuations.
NO INDEPENDENT VERIFICATION OR REPRESENTATION
No separate verification has been made as to the accuracy or completeness of the information herein. Data and graphical information herein are for information only and may have been derived from third party sources. Unigestion takes reasonable steps to verify, but does not guarantee, the accuracy and completeness of information from third party sources. As a result, no representation or warranty, expressed or implied, is or will be made by Unigestion in this respect and no responsibility or liability is or will be accepted. All information provided here is subject to change without notice. It should only be considered current as of the date of publication without regard to the date on which you may access the information. An investment with Unigestion, like all investments, contains risks, including total loss for the investor.
FORWARD-LOOKING STATEMENTS
This document may contain forward-looking statements, including observations about markets and industry and regulatory trends as of the original date of this document. Forward-looking statements may be identified by, among other things, the use of words such as “expects,” “anticipates,” “believes,” or “estimates,” or the negatives of these terms, and similar expressions. Forward-looking statements reflect Unigestion’s views as of such date with respect to possible future events and are subject to a number of risks and uncertainties, including, but not limited to, the impact of competitive products, market acceptance risks and other risks. Actual results could differ materially from those in the forward-looking statements as a result of factors beyond a strategy’s or Unigestion’s control. You are cautioned not to place undue reliance on such statements. No party has an obligation to update any of the forward-looking statements in this document.
TARGET RETURNS
Targeted returns reflect subjective determinations by Unigestion based on a variety of factors, including, among others, internal modeling, investment strategy, prior performance of similar products (if any), volatility measures, risk tolerance and market conditions. Target returns are based on Unigestion’s analytics including upside, base and downside scenarios and might include, but are not limited to, criteria and assumptions such as macro environment, enterprise value, turnover, EBITDA, debt, financial multiples and cash flows. Targeted returns are not intended to be actual performance and should not be relied upon as an indication of actual or future performance.
HYPOTHETICAL, BACKTESTED OR SIMULATED PERFORMANCE
Hypothetical, backtested or simulated performance is not an indicator of future actual results and has many inherent limitations. The results reflect performance of a strategy not currently offered to any investor and do not represent returns that any investor actually attained. One of the limitations of hypothetical performance results is that they are generally prepared with the benefit of hindsight.
Hypothetical performance may use, among other factors, historical financials (turnover, EBITDA, debit, financial multiples), historical valuations, macro variables and fund manager variables. Hypothetical results are calculated by the retroactive application of a model constructed on the basis of historical data and based on assumptions integral to the model which may or may not be testable and are subject to losses. Changes in these assumptions may have a material impact on the hypothetical (backtested/simulated) returns presented. Certain assumptions have been made for modeling purposes and are unlikely to be realized. No representations and warranties are made as to the reasonableness of the assumptions.
This information is provided for illustrative purposes only. Specifically, hypothetical (backtested/simulated) results do not reflect actual trading or the effect of material economic and market factors on the decision-making process. Hypothetical trading does not involve financial risk, and no hypothetical trading record can completely account for the impact of financial risk in actual trading. For example, the ability to withstand losses or to adhere to a particular trading program in spite of trading losses are material points which can also adversely affect actual trading results. Since trades have not actually been executed, results may have under- or over-compensated for the impact, if any, of certain market factors, such as lack of liquidity, and may not reflect the impact that certain economic or market factors may have had on the decision-making process. Further, backtesting allows the security selection methodology to be adjusted until past returns are maximized.
If hypothetical, backtested or simulated performance is shown gross of management fees, the inclusion of fees, costs and charges will reduce such numbers.
ASSESSMENTS
Unigestion may, based on its internal analysis, make assessments of a company’s future potential as a market leader or other success. There is no guarantee that this will be realised.
Legal Entities Disseminating This Document
United Kingdom
This material is disseminated in the United Kingdom by Unigestion (UK) Ltd., which is authorized and regulated by the Financial Conduct Authority (“FCA”).This information is intended only for professional clients and eligible counterparties, as defined in MiFID directive and has therefore not been adapted to retail clients.
United States
In the United States, Unigestion is present and offers its services in the United States as Unigestion (US) Ltd, which is registered as an investment advisor with the U.S. Securities and Exchange Commission (“SEC”) and/or as Unigestion (UK) Ltd., which is registered as an investment advisor with the SEC. All inquiries from investors present in the United States should be directed to clients@unigestion.com. This information is intended only for institutional clients that are qualified purchasers as defined by the SEC and has therefore not been adapted to retail clients.
European Union
This material is disseminated in the European Union by Unigestion Asset Management (France) SA which is authorized and regulated by the French “Autorité des Marchés Financiers” (“AMF”).This information is intended only for professional clients and eligible counterparties, as defined in the MiFID directive and has therefore not been adapted to retail clients.
Canada
This material is disseminated in Canada by Unigestion Asset Management (Canada) Inc. which is registered as a portfolio manager and/or exempt market dealer in nine provinces across Canada and also as an investment fund manager in Ontario, Quebec and Newfoundland & Labrador. Its principal regulator is the Ontario Securities Commission (“OSC”).This material may also be distributed by Unigestion SA which has an international advisor exemption in Quebec, Saskatchewan and Ontario. Unigestion SA’s assets are situated outside of Canada and, as such, there may be difficulty enforcing legal rights against it.
Switzerland
This material is disseminated in Switzerland by Unigestion SA which is authorized and regulated by the Swiss Financial Market Supervisory Authority (“FINMA”).
Related insight
- Private equity
- Perspectives
While exit activity remained subdued in Q4 2025, we continue deliver exits at a consistently high level.
[…]- Private equity
- Perspectives
Monitoring the performance of private equity funds is a critical responsibility for Limited Partners (LPs), as it plays a key role in shaping investment decisions throughout the life of a fund
[…]- Private equity
- Perspectives
Despite geopolitical and macro-economic uncertainties, 2025 has been a largely positive year for investors with public markets posting strong gains.
While investment conditions are far from perfect, inflation globally is moderating, the IMF has slightly upgraded its growth forecasts and many central banks are shifting to a more neutral or easing stance following a significant rate hike cycle that started in 2022.
[…]- Private equity
- Press releases
Unigestion Private Equity, the global specialist in mid-market leaders, is delighted to announce the final close of Unigestion Secondary VI (USEC VI). The fund was oversubscribed at its hard cap of €1.7bn ($2bn).
[…]