The Case for Derisking Portfolios with Low Volatility Equities

Equities, Executive Director, Head of Client Portfolio Management
Key Points
- Low volatility stocks have been shown to deliver comparable or even superior returns compared to the broader market over the long term, but with less risk
- These strategies can lower the overall volatility of the equity bucket, and reduce the risk of the asset mix while preserving the equity exposure. They also tend to be invested to a large extent in stocks where visibility on earnings is strong, and where speculation is less likely
- The valuations of low volatility stocks are not stretched and can be regarded once again as in “very cheap territory”
Executive Summary
With rates at their highest for the past two decades, and fixed income allocation at the lowest due to the bloodbath for duration in 2022, many pension plans intend to reduce their equity allocation to collect the highest coupons they’ve seen for a long time.
In this paper, we argue that all equities should not be treated equally in that reallocation move – while rebuilding a material fixed income exposure makes sense, some equity strategies should not be used to fund this reallocation, namely low volatility equities.
We will start by reviewing what low volatility equities are about, their purpose, and how they work. We will also discuss the concept of the equity premium and how low volatility strategies aim to capture it in a optimal manner before delving into the specific benefits these strategies may provide for pension funds and other institutional investors. We will discuss how they can help in derisking the portfolio, managing the volatility of the funding ratio, and increasing exposure to the equity premium while keeping the plan’s risk in line.
Finally we will analyse the potential advantages of low volatility equity strategies in the current environment of high interest rates, slowing but still high inflation and uncertain growth expectations, and make a case for maintaining or even increasing the allocation to these strategies.
What Purpose Do Low Volatility Equities Strategies Serve?
Low volatility equity strategies aim to provide exposure to the equity premium, which is the expected return on equities over risk-free rates, while minimising the risk associated with equity investments, hence delivering better risk-adjusted returns. These strategies typically involve investing in a diversified portfolio of low-volatility and/or low-correlation stocks, which have been shown to deliver comparable or even superior returns compared to the broader market over the long term, but with less risk. This is contrary to the traditional finance theory, which suggests that higher risk should be associated with higher returns. However, empirical evidence supports the low volatility anomaly, making it an attractive strategy for pension funds that seek to balance return and risk.
Low volatility equity strategies range from naïve volatility ranking schemes, to more sophisticated minimum variance frameworks which capitalise on the pairwise correlation between stocks to provide an optimal low risk portfolio, as opposed to a portfolio of low-risk stocks. The latter provide more robust portfolios but still suffer from the backward-looking nature of risk models, which assume that future volatility reflects past volatility. Therefore, a comprehensive understanding of what risk entails for equities is crucial. This involves utilising a combination of quantitative tools, not limited to traditional risk models, along with prudent human supervision to identify emerging risks. Such an approach is necessary to prevent the mistake of investing in a portfolio that focuses on minimising past volatility, but which remains vulnerable to emerging risks not seen in the past.
Since we started researching the so-called Minimum Variance anomaly in 1995, we have witnessed the superior absolute and risk-adjusted returns delivered by such strategies across geographies and market regimes, as evidenced in Figure 1.
Figure 1: Performance of Unigestion Low Vol Strategies Since Launch
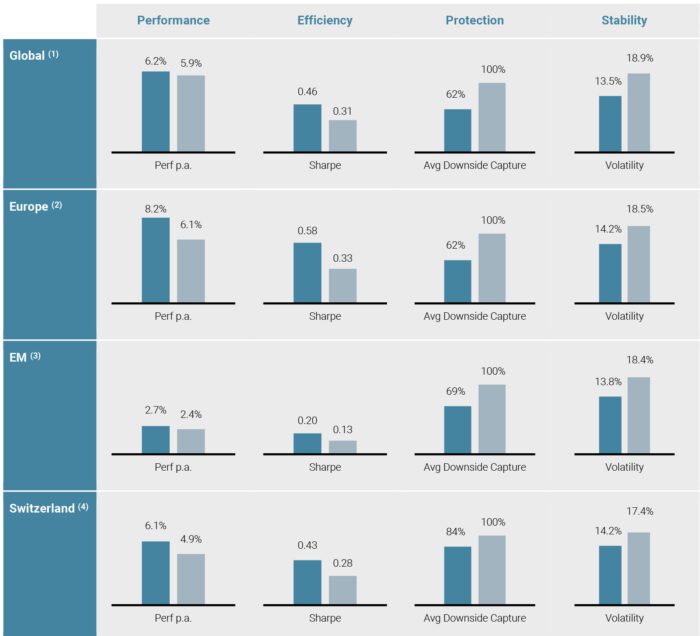
Sources: Unigestion, Bloomberg. Performance is shown gross of fees, in the base currency of each strategy. See the Important Information section for more information on performance.
*Unigestion’s representative account for each regional version of our “low vol” strategies.
** Respective becnhamrk of each Unigestion(*) regional version of thw low vol strategy.
(1)“Global” is represented by Uni-Global Equities World SA-USD, in USD, launched on 17.01.2008, versus MSCI AC World TR Net.
(2)Europe is represented by Uni-Global Equities Europe SA-EUR, in EUR, launched on 04.05.2004, versus MSCI Europe TR Net.
(3)EM is represented by Uni-Global Equities Emerging Markets SA-USD, in USD, launched on 24.03.2010, versus MSCI Emerging Markets TR Net.
(4)Switzerland is represented by Unigestion Swiss Equities Class A, in CHF, launched on 31.10.1999, versus SPI TR.. Data as of 30.06.2023
How to Use Low Vol Strategies in an Asset Mix ?
Beside the attractive long-term profile of low vol strategies, their performance pattern and the diversification characteristics they provide may also be very valuable to any investors wishing to build a robust equity allocation and an optimal asset mix. We explore those benefits in the section hereafter.
Keep Equities While Lowering Risk, or Increase Equities With Steady Risk?
The most obvious case for low volatility strategies is to lower the overall volatility of the equity bucket, and consequently reduce the risk of the asset mix while preserving the equity exposure.
Below is an illustration of such benefits. We computed the volatility of four very basic equities/bonds portfolios, with bonds ranging from 10% up to 50% of the total allocation.
We then replaced part of the equity allocation (represented by the MSCI World) with Unigestion’s low volatility strategy (World).
Figure 2: Volatilities of Traditional Equities/Bonds Portfolios
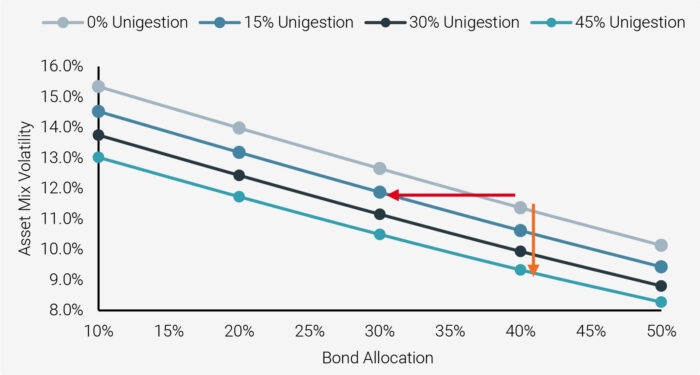
Sources: Unigestion, Bloomberg. Simulated data as of 30.06.2023, based on weekly returns between 31.01.2008 and 30.06.2023, in USD, gross of fees.
We clearly see a significant improvement of the volatility of the total portfolios when adding more of low volatility strategies in the equity mix.
As per the given example on the chart (orange arrow), replacing MSCI World with Unigestion’s low volatility strategy in a traditional 60/40 portfolio would have resulted in a total reduction in volatility for the asset mix by more than 20% (from 11.4% down to 9.3%)!
In a similar fashion, if an investor wishes to increase a portfolio’s equity exposure while preserving its risk level, using low volatility strategies can be an efficient way to reach this goal.
The red arrow shows that investors could increase their allocation to equities from 60% up to 80%, by replacing a part of the bonds allocation with Unigestion’s low volatility strategy, while keeping the volatility of the total asset mix steady at around 11.5%.
Diversifying Style Bias Within the Equity Allocation
Besides the pure risk characteristics of the portfolio, one should look at the underlying portfolio composition offered by low volatility strategies in terms of sector, country, and style exposures. Other desirable characteristics of the underlying portfolio such as its dividend yield should also be considered.
Over the past decade, capitalisation weighted indices have concentrated massively on a handful of stocks (Figure 3), in particular within the Technology Large Caps (the so-called “S&P7”!), reflecting the unlimited search for higher returns, backed by the unofficial “Fed’s put”, which seemed to minimise the need for risk management techniques.
2022 acted a wakeup call for many investors, with these stocks suffering significant setbacks. However, once again we are seeing some strong levels of complacency for high growth prospects in the stock markets, despite interest rates having reached levels not seen for a very long time.
Figure 3: Sector Concentration in the MSCI USA
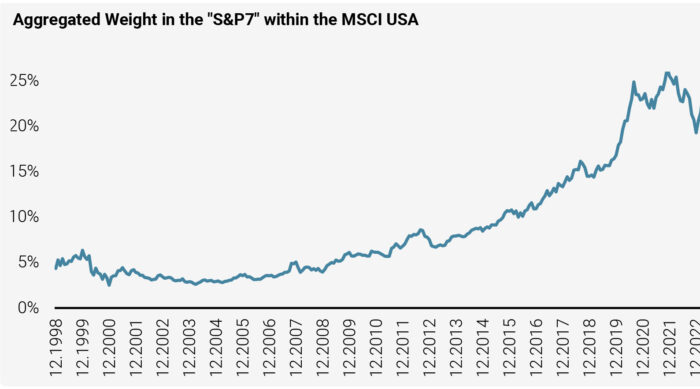
Source: Unigestion, Bloomberg. “S&P7”: 7 large tech—oriented mega caps in the MSCI USA: Apple, Microsoft, Google, Amazon, Tesla, Nvidia, Meta. Data as of 30.06.2023.
Low volatility strategies are a good way of diversifying away from those speculation traps, as volatility of returns is inherently driven by corporate earnings volatility over the long run, and lower speculation around them. Hence low volatility strategies tend to be invested to a large extent in stocks where visibility on earnings is strong, and where speculative valuaiton is less likely. They are also usually less sensitive to the cyclicality of the economy.
Consequently we believe investing in low volatility strategies like ours is a good way to get exposed to more resilient and less speculative stocks, usually with attractive yields. This is evidenced in Figure 4. The additional dividend yield is even more attractive today – a nice feature when today’s current earning yield for equities puts them on a par with bonds.
Figure 4: Relative Dividend Yield of a Low Volatility Strategy vs MSCI World (ACWI)
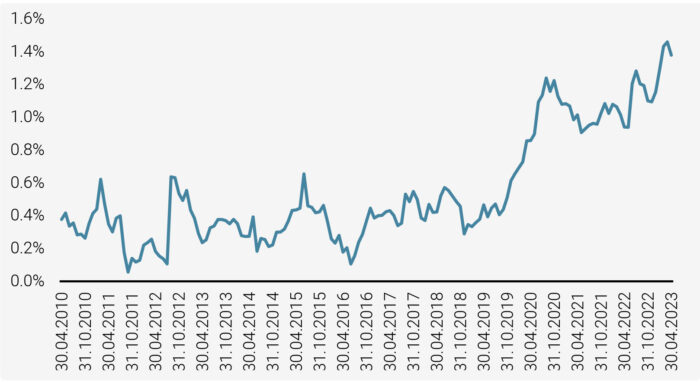
Source: Unigestion, Bloomberg. Data as of 30.06.2023.
Is Today a Good Entry Point for Low Volatility Strategies ?
State of the Economy: Slowing but Persistent Inflation, Gloomy Growth
In the first half of 2023, sentiment was driven by a relatively good mix of rapidly falling inflation with growth slowing down and the largest part of rate hikes in this cycle behind us. Easing supply chains and falling energy prices largely contributed to inflation slowdown (Figure5).
Figure 5: World Inflation Nowcasters
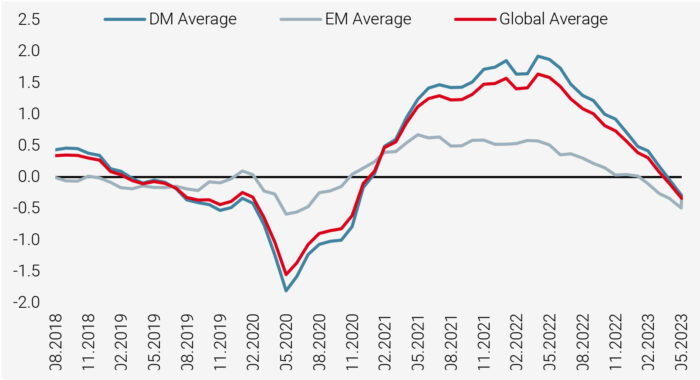
Source: Unigestion. Data as of 30.06.2023
Equity Valuations: Extreme Complacency?
Recession risk has somehow stabilised and economic conditions have remained resilient enough to fuel optimism, especially after companies reported better than expected Q1 earnings. This drove market complacency levels close to extreme levels (Figure 6).
Figure 6: Nasdaq Complacency Indicators
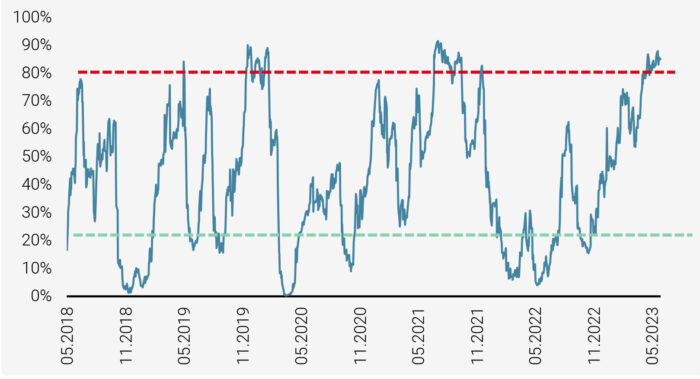
Source: Unigestion. Data as of 30.06.2023
Current Attractivity of Low Vol Stocks
With this extreme optimism in 2023, equity valuations have rebounded massively after the 2022 sell-off. However, while big tech has once again led this rebound, valuations of defensive equity strategies such as low volatility became more attractive in that context given the relative rebound for these stocks in 2022 did not see them recover the ground they lost between 2019 and 2021. Their valuations are by no means stretched and can be regarded once again as in “Very cheap territory”.
Figure 7: Relative Valuation of Low Vol Strategies Using Various Metrics
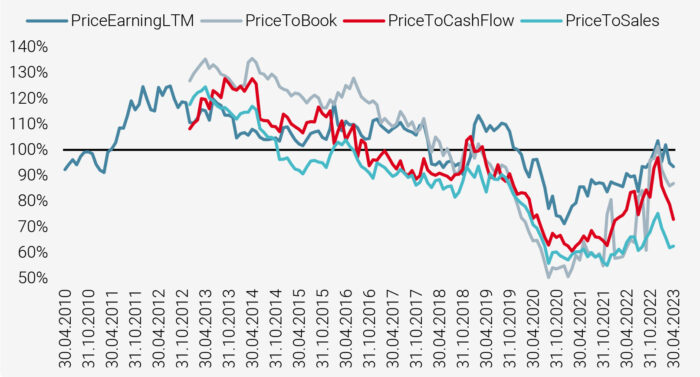
Source: Unigestion, Bloomberg..Data as of 30.06.2023
Looking Forward: Stress Testing the Portfolios
We currently envisage three scenarios for the coming quarters:
- Our core scenario, which we name “mild recession”, reflects a mild recession taking place in most developed countries (this has already started in some countries like Germany). This would be negative for equities, albeit to a limited extent. We assign this median scenario a probability of 60%.
- Our second scenario, named “hard landing”, would see a major hit for the global economy as central banks would struggle to tame inflation and high interest rates would weigh dramatically on the global economy. We assign a probability of 20% to this bearish scenario.
- Finally, our third scenario, “soft landing”, is the most optimistic one, and probably the one investors have hoped for so far this year, propelling equity markets up despite the banking crisis. We assign a probability of 20% to this bullish scenario.
We have stress tested our low volatility strategies against these three scenarios and our portfolio provided strong resilience in the bearish one, attractive outperformance in the core scenario, and an upside lag in line with the philosophy in the bull case, as shown on Figure 8:
Figure 8: Results of Stress Testing the Portfolios
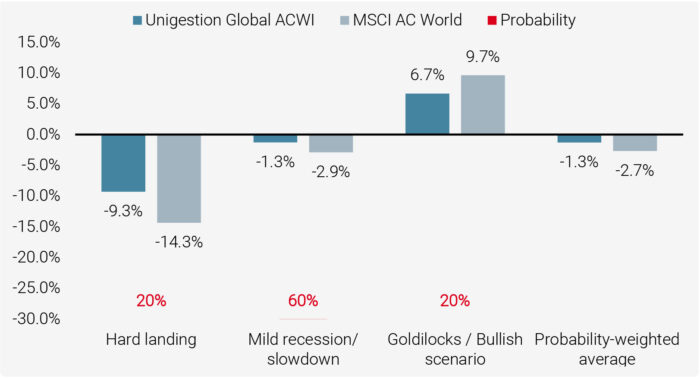
Source: Unigestion, Bloomberg..Data as of 30.06.2023
We will continue to asses the evolution of those scenarios and their probabilities going forward to detect some new and skewed risks which could be mispriced by past volatility. For the time being we are very confident that the current positioning of the portfolio will mitigate the threats currently faced by equities while continuing to capture the growth of the resilient companies we are holding in the portfolio.
Important information
INFORMATION ONLY FOR YOU
This document has been prepared for your information only and must not be distributed, published, reproduced or disclosed (in whole or in part) by recipients to any other person without the prior written consent of Unigestion. It is neither directed to, nor intended for distribution or use by, any person or entity who is a citizen or resident of, or domiciled or located in, any locality, state, country or jurisdiction where such distribution, publication, availability or use would be contrary to law or regulation.
RELIANCE ON UNIGESTION
There is no guarantee that Unigestion will be successful in achieving any investment objectives. An investment strategy contains risks, including the risk of complete loss. Except where otherwise specifically noted, the information contained herein, including performance data and assets under management, relates to the entire affiliated group of Unigestion entities over time. Such information is intended to provide you with background regarding the services, investment strategies and personnel of the Unigestion entities. No guarantee is made that all or any of the individuals involved in generating the performance on behalf of one or more Unigestion entities will be involved in managing any specific client account on behalf of another Unigestion entity.
NOT A RECOMMENDATION OR OFFER
This is a promotional statement of our investment philosophy and services only in relation to the subject matter of this presentation. It constitutes neither investment advice nor recommendation. This document represents no offer, solicitation or suggestion of suitability to subscribe in either the investment vehicles to which it refers or to any securities or financial instruments described herein. Any such offer to sell or solicitation of an offer to purchase shall be made only by formal offering documents, which include, among others, a confidential offering memorandum, limited partnership agreement (if applicable), investment management agreement (if applicable), operating agreement (if applicable), and related subscription documents (if applicable). Such documentation contains additional information material to any decision to invest. Please contact your professional adviser/consultant before making an investment decision.
Reference to specific securities should not be construed as a recommendation to buy or sell such securities and is included for illustration purposes only.
RISKS
Where possible we aim to disclose the material risks pertinent to this document. The views expressed in this document do not purport to be a complete description of the securities, markets and developments referred to in it. Unigestion maintains the right to delete or modify information without prior notice. The risk management practices and methods described herein are for illustrative purposes only and are subject to modification. Investors shall conduct their own analysis of the risks (including any legal, regulatory, tax or other consequences) associated with an investment and should seek independent professional advice. Some of the investment strategies or financial instruments described or alluded to herein may be construed as high risk and not readily realisable investments, and may experience substantial & sudden losses including total loss of investment. These are not suitable for all types of investors. Unigestion has the ability in its sole discretion to change the strategies described herein.
PAST PERFORMANCE
Past performance is not a reliable indicator of future results, the value of investments, can fall as well as rise, and there is no guarantee that your initial investment will be returned. If performance is shown gross of management fees, you should be aware that the inclusion of fees, costs and charges will reduce investment returns. Returns may increase or decrease as a result of currency fluctuations.
NO INDEPENDENT VERIFICATION OR REPRESENTATION
No separate verification has been made as to the accuracy or completeness of the information herein. Data and graphical information herein are for information only and may have been derived from third party sources. Unigestion takes reasonable steps to verify, but does not guarantee, the accuracy and completeness of information from third party sources. As a result, no representation or warranty, expressed or implied, is or will be made by Unigestion in this respect and no responsibility or liability is or will be accepted. All information provided here is subject to change without notice. It should only be considered current as of the date of publication without regard to the date on which you may access the information. An investment with Unigestion, like all investments, contains risks, including total loss for the investor.
TARGET RETURNS, FORECASTS, PROJECTIONS
This document may contain forward-looking statements, including observations about markets and industry and regulatory trends as of the original date of this document. Forward-looking statements may be identified by, among other things, the use of words such as “expects,” “anticipates,” “believes,” or “estimates,” or the negatives of these terms, and similar expressions. Forward-looking statements reflect Unigestion’s views as of such date with respect to possible future events and are subject to a number of risks and uncertainties, including, but not limited to, the impact of competitive products, market acceptance risks and other risks. Actual results could differ materially from those in the forward-looking statements as a result of factors beyond a strategy’s or Unigestion’s control. You are cautioned not to place undue reliance on such statements. No party has an obligation to update any of the forward-looking statements in this document
Targeted returns reflect subjective determinations by Unigestion based on a variety of factors, including, among others, internal modeling, investment strategy, prior performance of similar products (if any), volatility measures, risk tolerance and market conditions. Target returns and/or forecasts are based on Unigestion’s analytics including upside, base and downside scenarios and might include, but are not limited to, criteria and assumptions such as macro environment, enterprise value, turnover, EBITDA, debt, financial multiples and cash flows. Targeted
returns and/or forecasts are not intended to be actual performance and should not be relied upon as an indication of actual or future performance. If target returns, forecasts or projections are shown gross of management fees, the inclusion of fees, costs and charges will reduce such numbers.
USE OF INDICES
Information about any indices shown herein is provided to allow for comparison of the performance of the strategy to that of certain well-known and widely recognized indices. There is no representation that such index is an appropriate benchmark for such comparison. You cannot invest directly in an index and the indices represented do not take into account trading commissions and/or other brokerage or custodial costs. The volatility of the indices may be materially different from that of the strategy. In addition, the strategy’s holdings may differ substantially from the securities that comprise the indices shown.
HYPOTHETICAL, BACKTESTED OR SIMULATED PERFORMANCE
Hypothetical, backtested or simulated performance is not an indicator of future actual results and has many inherent limitations. The results reflect performance of a strategy not currently offered to any investor and do not represent returns that any investor actually attained. One of the limitations of hypothetical performance results is that they are generally prepared with the benefit of hindsight.
Hypothetical performance may use, among other factors, historical financials (turnover, EBITDA, debit, financial multiples), historical valuations, macro variables and fund manager variables. Hypothetical results are calculated by the retroactive application of a model constructed on the basis of historical data and based on assumptions integral to the model which may or may not be testable and are subject to losses. Changes in these assumptions may have a material impact on the hypothetical (backtested/simulated) returns presented. Certain assumptions have been made for modeling purposes and are unlikely to be realized. No representations and warranties are made as to the reasonableness of the assumptions.
This information is provided for illustrative purposes only. Specifically, hypothetical (backtested/simulated) results do not reflect actual trading or the effect of material economic and market factors on the decision-making process. Hypothetical trading does not involve financial risk, and no hypothetical trading record can completely account for the impact of financial risk in actual trading. For example, the ability to withstand losses or to adhere to a particular trading program in spite of trading losses are material points which can also adversely affect actual trading results. Since trades have not actually been executed, results may have under- or over-compensated for the impact, if any, of certain market factors, such as lack of liquidity, and may not reflect the impact that certain economic or market factors may have had on the decision-making process. Further, backtesting allows the security selection methodology to be adjusted until past returns are maximized.
If hypothetical, backtested or simulated performance is shown gross of management fees, the inclusion of fees, costs and charges will reduce such numbers.
ASSESSMENTS
Unigestion may, based on its internal analysis, make assessments of a company’s future potential as a market leader or other success. There is no guarantee that this will be realised.
Legal Entities Disseminating This Document
UNITED KINGDOM
This material is disseminated in the United Kingdom by Unigestion (UK) Ltd., which is authorized and regulated by the Financial Conduct Authority (« FCA »). This information is intended only for professional clients and eligible counterparties, as defined in MiFID directive and has therefore not been adapted to retail clients.
UNITED STATES
This material is disseminated in the United States by Unigestion (UK) Ltd., which is registered as an investment adviser with the U.S. Securities and Exchange Commission (“SEC”). All inquiries from investors present in the United States should be directed to Clients@unigestion.com at Unigestion (UK) Ltd. This information is intended only for institutional clients and qualified purchasers as defined by the SEC and has therefore not been adapted to retail clients.
EUROPEAN UNION
This material is disseminated in the European Union by Unigestion Asset Management (France) SA which is authorized and regulated by the French “Autorité des Marchés Financiers” (« AMF »).
This information is intended only for professional clients and eligible counterparties, as defined in the MiFID directive and has therefore not been adapted to retail clients.
CANADA
This material is disseminated in Canada by Unigestion Asset Management (Canada) Inc. which is registered as a portfolio manager and/or exempt market dealer in nine provinces across Canada and also as an investment fund manager in Ontario, Quebec and Newfoundland & Labrador. Its principal regulator is the Ontario Securities Commission (« OSC »). This material may also be distributed by Unigestion SA which has an international advisor exemption in Quebec, Saskatchewan and Ontario. Unigestion SA’s assets are situated outside of Canada and, as such, there may be difficulty enforcing legal rights against it.
SWITZERLAND
This material is disseminated in Switzerland by Unigestion SA which is authorized and regulated by the Swiss Financial Market Supervisory Authority (« FINMA »).
Document issued July2023.