The art of successful exits in a challenging market

Key Points
- 2023 was the worst year for exits in more than a decade and the bar will remain high
- But liquidity is being generated, and at attractive mutliples, for those companies meeting strict criteria and we have been able to continue returning cash back to our investors
- Active portfolio management using secondaries provides additional opportunities – an area in which we have been active for over 20 years
Overview
We have now seen two successive challenging years in the private equity industry. With geopolitical tensions spreading from Eastern Europe to the Middle East, continued rate rises in developed markets as central bankers fought persistent inflation and poor public market performance in 2022 leading to lower private allocations in 2023, the past 12 months have been tough. Uneven fundraising and a decline in exits have left LPs short of liquidity. The post-Covid frothiness of 2021 seems a very long time ago indeed.
But for all the gloom at a global level, there are reasons for at least some private equity investors to be cheerful. We have been able to provide our LPs with a different narrative to the broader industry picture, delivering a consistently high level of exits with attractive multiples in both 2022 and 2023. Across our direct programmes, in the last two years we have exited eight investments at an average multiple of 3.6x (3.0x net). In the last year alone, we have increased the DPI of our mature direct funds (2015 and 2016 vintages) by 0.44x, around six times higher than the median of peer funds. In aggregate, across directs, secondaries and primaries, we have delivered over USD 2bn back to our investors over 24 months.
This is not by chance. It is the result of a robust, systematic investment process which has a laser-like focus on identifying the potential market leaders of tomorrow and involves our investment teams plotting a clear path to exit from the moment they embark on the due diligence process.
Quick exit? Not so fast….
A rising tide may lift all boats but, as Warren Buffet once said, you can only see who is swimming naked when the tide goes out. As the New Year gets under way, it is clear that 2023 was the worst year for exits in more than a decade, dropping sharply from their peak in 2021. Given that aggregate assets under management (AUM) in the industry has increased three-fold in the last ten years, exit activity as a proportion of AUM is at its lowest since the GFC.
Data from Preqin (see chart 1 below) shows that private equity exits were worth USD 439bn globally in 2023, down from USD 485bn in 2022 and over USD 800bn in 2021. Net cashflow has also been subdued, at 88% in 2023, up from 68% in 2022 but still well below the levels investors would expect. In addition, the number of IPOs saw a further decline in 2023 – down from 1,415 in 2022 to 1,298 in 2023, with proceeds dropping 33% from USD 184.3bn to USD 123.2bn, according to Ernst & Young.
Figure 1: Private equity exit activity (USD bn)
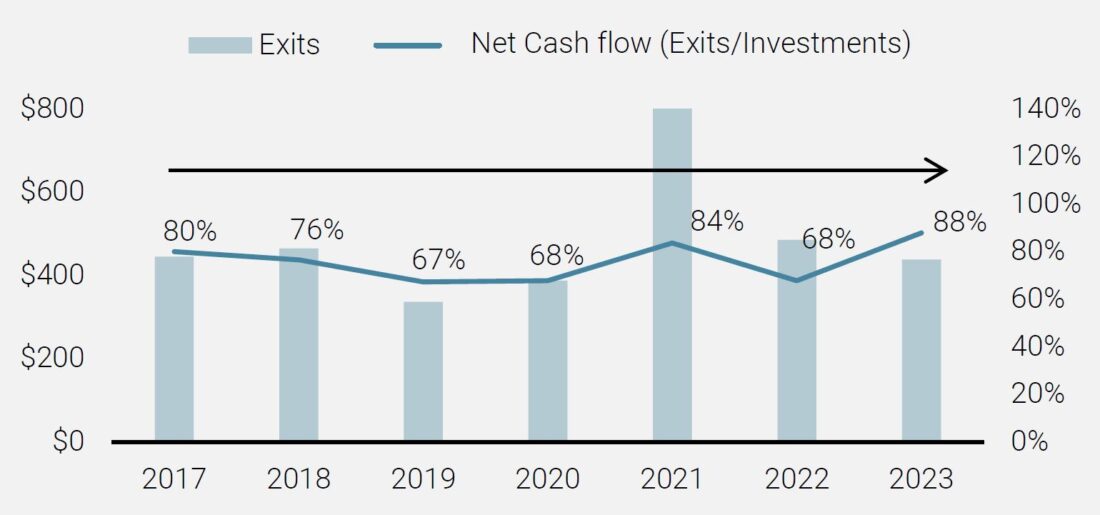
Source: Preqin, January 2024. Buyouts only.
Exits have become more challenging overall for four key reasons:
- Persistently high interest rates – financing costs are high for would-be buyers
- Inflation, although falling, remains at historically high levels – profit margins of many companies are squeezed making them less attractive to buyers
- Recession risk remains high globally – buyers are particularly steering clear of more cyclical sectors
- Supply chains are under stress due to geopolitical uncertainties – buyers would rather wait for more stable conditions
This environment has not just affected the ability of private equity owners to sell their holdings at attractive premiums, but also prospective buyers, who have been delaying their acquisition decisions until there is more clarity.
The bar for exits is very high and we believe only companies meeting strict criteria can be sold at attractive multiples.
So what of 2024? Given many managers sat on their hands in 2023 in the hope exit conditions would improve, firms will be under increasing pressure to monetise investments and return more capital to investors this year. Many will see funds come to the end of their terms and PitchBook analysis suggests that if the current pace of exits continues, 2017 vintages, for example, are on course to reach maturity with up to 26% of invested capital still locked into assets instead of being distributed to investors.
Leverage is also an issue that may pressure some firms into sales at less attractive valuations. Some firms finance buyouts with loans that can reach maturity six or seven years after a deal is completed. A big proportion of debt (from deals done six or seven years ago) is likely to mature in 2024 and may need to be refinanced at significantly higher rates, if it is possible to do so at all in these more difficult times. Those that are unable to refinance will be forced to take other measures to address liquidity needs, such as through net asset value financing or GP-led secondaries.
During 2023 an increasing number of managers turned to net asset value (NAV) financing as a means of providing liquidity to their investors. While NAV financing can be a useful tool for GPs in the short term, helping them do deals quickly, they inevitably add to existing leverage in funds and can eat into total equity returns so GPs are typically efficient about clearing them as quickly as possible. In the current market conditions, this may not be so easy and investors should be alert to any build-up of leverage in funds. GPs must be upfront with investors on financing arrangements, not only that they are being used, but why, how much is left to repay and, by when.
So, 2024 is likely to see an uptick in exit activity with some managers being forced sellers. However, given market conditions remain unsettled, and geopolitical uncertainty will increase in the face of numerous elections taking place, including in the US and UK, there is the likelihood that valuations will be challenged and performance will be under pressure as a result.
Those that can, do
While the overall industry picture is one of poor liquidity, the figures mask some clear differences between GPs. It is worth, in particular, separating out the contrasts between large cap GPs and those of us operating in the mid and small cap space.
The dearth of IPOs, for example, is much more of an issue for the larger industry players, who tend to seek IPOs for a large proportion of their exits. IPOs are not a route we typically seek – around 60% of our exits take place with strategic buyers while sales to other private equity firms account for most of the balance.
Interest rates may also be less of a concern in the mid cap arena. Large cap GPs are more likely to use leverage because financial engineering makes up a greater proportion of returns than for smaller deals, where operational enhancements and growth usually drive most of the returns for mid and small cap players.
But it is at the company level that the difference is really made. While the environment is tough, companies can and are being sold – and at attractive multiples. What is required for private equity firms to achieve this holy grail?
We believe the following criteria are important for target companies:
1. Theme-driven, resilient growth
2. Leading company in its sector, leading to strong market position
3. Mission critical offering – customers cannot do without it
4. High EBITDA margin and cash conversion, giving a buffer in case of difficult times
5. Strong balance sheet with limited leverage
In fact, companies with the above features will stand out even more in a tough environment than in better times and thus attract greater interest from buyers.
These factors, combined with the ability for Unigestion to be an active owner, are a core part of our investment strategy, which we call “targeting the market leaders of tomorrow”. Our strict adherence to these principles enabled us to achieve our highest level of exits in 2022 and maintain the pace in 2023 (see chart 2). Furthermore, the DPI for our direct strategy over the past year has increased by an average of +0.44x, compared to an average of +0.07x for GPs overall, according to Preqin.
Chart 2: Unigestion exit activity (USD m)
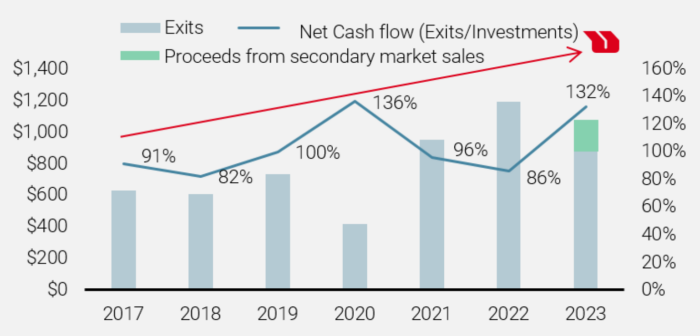
Source: Unigestion, January 2024. Buyouts only.
By moving into the mainstream, secondaries are providing an increasingly attractive exit route and source of liquidity for GPs and LPs, enabling private equity managers to take a more active approach to managing their portfolios over the life cycle of a fund.
While GPs are catching on to the benefits of using secondaries to create additional liquidity, it is something we have been doing for 20 years. During 2023, we sold EUR 266m of portfolio investments through secondary sales while in 2015, exits via secondaries totaled EUR 210m. And it is not just single investments: we are able to package up a number of portfolio investments creating significant portfolios which can then be auctioned off to the larger secondary players leading to potentially attractive realised gains for our investors.
Chart 3: Unprecedented transaction volume growth
Source: Greenhill – Global Secondary Market Review, as at 30.6.2023.
We apply these principles across all of our strategies: direct investments, secondaries, emerging and established managers, and climate impact investments. The result has been portfolios of attractive characteristics: (i) robust returns driven by sustainable growth, (ii) performance uncorrelated to both the public market and large cap private equity, (iii) low risk and volatility and (iv) liquidity throughout the cycle.
By being so laser-focused on these attributes at the point of investment, we find that potential buyers, be they large corporates or other private equity firms, ultimately want to own our portfolio companies – irrespective of the macro environment.
Active portfolio management
Planning for the exit at the point of investment is not the only solution: for almost 20 years, we have been taking an active approach to portfolio management during the lifecycle of our funds, creating additional liquidity for our investors through secondary sales.
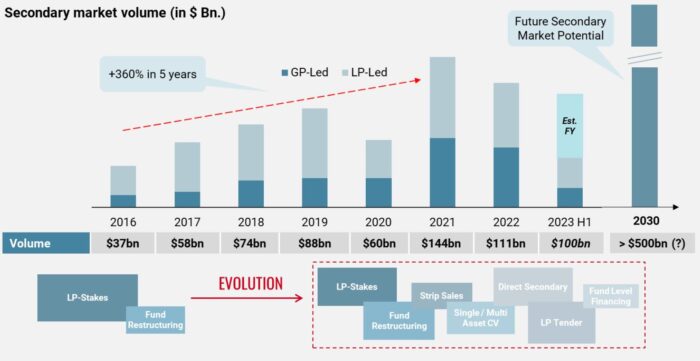
This part of the private equity industry has ballooned alongside the wider growth of the private equity industry in recent years. As chart 3 shows, over the past six years we have seen the volume of global secondary transactions rising from USD 37bn in 2016 to USD 111bn in 2022 and volumes are expected to continue growing at a compound annual growth rate of 20% to 30%.
Chart 3: Unprecedented transaction volume growth
Source: Greenhill – Global Secondary Market Review, as at 30.6.2023.
By moving into the mainstream, secondaries are providing an increasingly attractive exit route and source of liquidity for GPs and LPs, enabling private equity managers to take a more active approach to managing their portfolios over the life cycle of a fund.
While GPs are catching on to the benefits of using secondaries to create additional liquidity, it is something we have been doing for 20 years. During 2023, we sold EUR 266m of portfolio investments through secondary sales while in 2015, exits via secondaries totaled EUR 210m. And it is not just single investments: we are able to package up a number of portfolio investments creating significant portfolios which can then be auctioned off to the larger secondary players leading to potentially attractive realised gains for our investors.
Chart 4: Secondaries sales carried out by Unigestion (EUR m)
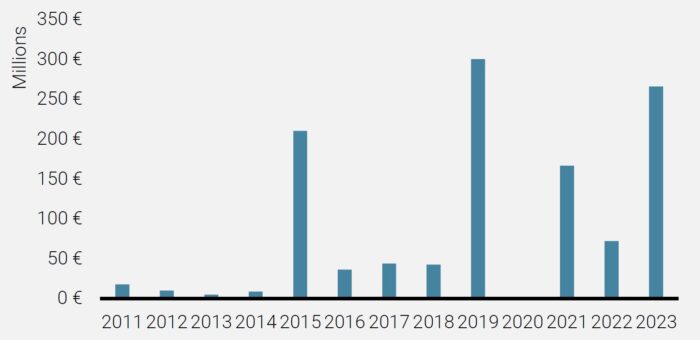
Source: Unigestion as at 31 December 2023.
How to achieve premium exits in practice
So how have we been exiting companies from our portfolios in practice? By remaining focused on seeking the market leaders of tomorrow, we have continued to achieve exits throughout the challenging environment of the past two years and the pipeline for 2024 remains highly positive. Some examples of our exits are highlighted below
 |
Case study – Tapi Strategy: Directs Region: Global Transaction: sold to Stirling Square Capital Partners in February 2023 for EUR 320m, 5.0x (4.1x net) cost Angle: Tapi is a global leader in the high-growth, premium bottle closures market with production facilities in Italy, France, Mexico and Argentina. We invested in the company alongside Wise Equity in 2017 when the company had revenues of EUR 35m. Thanks to investments in production capacity and efficiency as well as M&A activity (the group notably acquired Les Bouchages Delage in 2019), Tapi’s revenue has almost quadrupled since we initially invested. |
| Case study – Transporeon Strategy: Directs Region: North America Transaction: sold to Trimble in April 2023 for USD 2bn, returning 2.5x (2.1x net) cost Angle: Transporeon is a leading European freight connectivity SaaS platform which provides applications to support a global network of more than 150,000 carriers and 1,400 shippers and retailers with an integrated suite of IT tools. Since our investment in 2019, the business has shown strong growth. The sale followed a competitive process with interest from multiple parties (both private equity and trade). |
|
 |
Case study – Guestline Strategy: Directs Region: UK Transaction: sold to Access Group in July 2023, returning 2.8x (2.4x net) cost Angle: Guestline is a UK-based provider of mission critical software for the hospitality sector. Guestline serves a broad customer base, spanning leading independent hotels, multi-property groups, and delivering a leading end-to-end, distribution, hotel property management and guest experience system that unlocks more revenue, guest satisfaction and agility. This is another good example of the resilience of a market leader. During COVID, the hospitality sector overall suffered but given the mission criticality of the offering, the company was able to limit the impact and then thrive on the COVID recovery. |
 |
Case study – Polyplus Strategy: Secondaries Region: Europe Transaction: sold to Sartorius for 3.8x (3.5x net) cost Angle: Polyplus is a global leader in transfection reagents and plasmids, which are key components in the manufacturing of viral vectors used in cell and gene therapies and other advanced medicinal therapeutic products. The unique position within the gene therapy value chain and the high margins attracted us to the transaction, while the close relationship with the lead investor gave us access to this global niche leader. After a 3-year holding period, the company was sold to a listed strategic buyer. |
 |
Case study – Costal Waste & Recycling Strategy: Secondaries Region: North America Transaction: sold to Macquarie at 4.8x (4.5x net) cost Angle: Coastal Waste is a vertically integrated waste management company in South Florida in which we invested in Q3 2021. We were initially attracted by the strong tailwinds, the predictable revenues of long customer contracts, a highly aligned and experienced GP and, importantly, a visible pipeline of acquisition targets. In April 2023, after less than two years, the company was sold to an infrastructure fund. |
 |
Case study – Avania Strategy: Co-Investment Region: Europe Transaction: Sold to Astorg for 3.3x (2.8x net) cost Angle: Avania is a full service Clinical Research Organisation (“CRO”) for medical devices in which we invested in 2020. The Company is the only pure play medical devices CRO with a global offering in a highly fragmented and strongly growing market. Driven by aforementioned market growth, Avania’s leading positioning, the experienced management team as well as a dedicated buy-and-build strategy, led to strong interest during the sales process in Q2 2022. Eventually, Astorg was chosen as preferred buyer and Unigestion invested alongside Astorg to benefit from further growth potential. |
Conclusion
Private equity investments are, by their nature, illiquid but investors are prepared to lock their capital up for longer to achieve premium returns.
However, investors would typically expect a steady flow of liquidity throughout the life of an investment and even make further commitments to funds on the assumption that the distributions from prior investments will fund the drawdowns to these new commitments. Thus, the continued slow rate of exits relative to the large outstanding NAV will be a significant concern.
However, not all GPs are created equal. There is liquidity for private equity investors who have attractive portfolio companies with the right set of criteria.
Furthermore, smart portfolio management, by tapping into the sophisticated secondaries market, can enhance the flow of steady cash back to investors.
So, even when the tide goes out, there is a way for investors to be sure that they have their bathing suits on and are the first ones back to the beach bar!
Important information
INFORMATION ONLY FOR YOU
This document has been prepared for your information only and must not be distributed, published, reproduced or disclosed (in whole or in part) by recipients to any other person without the prior written consent of Unigestion. It is neither directed to, nor intended for distribution or use by, any person or entity who is a citizen or resident of, or domiciled or located in, any locality, state, country or jurisdiction where such distribution, publication, availability or use would be contrary to law or regulation.
RELIANCE ON UNIGESTION
There is no guarantee that Unigestion will be successful in achieving any investment objectives. An investment strategy contains risks, including the risk of complete loss.
Except where otherwise specifically noted, the information contained herein, including performance data and assets under management, relates to the entire affiliated group of Unigestion entities over time. Such information is intended to provide you with background regarding the services, investment strategies and personnel of the Unigestion entities. No guarantee is made that all or any of the individuals involved in generating the performance on behalf of one or more Unigestion entities will be involved in managing any specific client account on behalf of another Unigestion entity.
NOT A RECOMMENDATION OR OFFER
This is a promotional statement of our investment philosophy and services only in relation to the subject matter of this presentation. It constitutes neither investment advice nor recommendation. This document represents no offer, solicitation or suggestion of suitability to subscribe in either the investment vehicles to which it refers or to any securities or financial instruments described herein. Any such offer to sell or solicitation of an offer to purchase shall be made only by formal offering documents, which include, among others, a confidential offering memorandum, limited partnership agreement (if applicable), investment management agreement (if applicable), operating agreement (if applicable), and related subscription documents (if applicable). Such documentation contains additional information material to any decision to invest. Please contact your professional adviser/consultant before making an investment decision.
Reference to specific securities should not be construed as a recommendation to buy or sell such securities and is included for illustration purposes only.
RISKS
Where possible we aim to disclose the material risks pertinent to this document. The views expressed in this document do not purport to be a complete description of the securities, markets and developments referred to in it. Unigestion maintains the right to delete or modify information without prior notice. The risk management practices and methods described herein are for illustrative purposes only and are subject to modification.
Investors shall conduct their own analysis of the risks (including any legal, regulatory, tax or other consequences) associated with an investment and should seek independent professional advice. Some of the investment strategies or financial instruments described or alluded to herein may be construed as high risk and not readily realisable investments, and may experience substantial & sudden losses including total loss of investment. These are not suitable for all types of investors. Unigestion has the ability in its sole discretion to change the strategies described herein.
PAST PERFORMANCE
Past performance is not a reliable indicator of future results, the value of investments, can fall as well as rise, and there is no guarantee that your initial investment will be returned.
If performance is shown gross of management fees, you should be aware that the inclusion of fees, costs and charges will reduce investment returns.
Returns may increase or decrease as a result of currency fluctuations.
NO INDEPENDENT VERIFICATION OR REPRESENTATION
No separate verification has been made as to the accuracy or completeness of the information herein. Data and graphical information herein are for information only and may have been derived from third party sources. Unigestion takes reasonable steps to verify, but does not guarantee, the accuracy and completeness of information from third party sources. As a result, no representation or warranty, expressed or implied, is or will be made by Unigestion in this respect and no responsibility or liability is or will be accepted. All information provided here is subject to change without notice. It should only be considered current as of the date of publication without regard to the date on which you may access the information. An investment with Unigestion, like all investments, contains risks, including total loss for the investor.
TARGET RETURNS, FORECASTS, PROJECTIONS
This document may contain forward-looking statements, including observations about markets and industry and regulatory trends as of the original date of this document. Forward-looking statements may be identified by, among other things, the use of words such as “expects,” “anticipates,” “believes,” or “estimates,” or the negatives of these terms, and similar expressions. Forward-looking statements reflect Unigestion’s views as of such date with respect to possible future events and are subject to a number of risks and uncertainties, including, but not limited to, the impact of competitive products, market acceptance risks and other risks. Actual results could differ materially from those in the forward-looking statements as a result of factors beyond a strategy’s or Unigestion’s control. You are cautioned not to place undue reliance on such statements. No party has an obligation to update any of the forward-looking statements in this document
Targeted returns reflect subjective determinations by Unigestion based on a variety of factors, including, among others, internal modeling, investment strategy, prior performance of similar products (if any), volatility measures, risk tolerance and market conditions. Target returns and/or forecasts are based on Unigestion’s analytics including upside, base and downside scenarios and might include, but are not limited to, criteria and assumptions such as macro environment, enterprise value, turnover, EBITDA, debt, financial multiples and cash flows. Targeted returns and/or forecasts are not intended to be actual performance and should not be relied upon as an indication of actual or future performance.
If target returns, forecasts or projections are shown gross of management fees, the inclusion of fees, costs and charges will reduce such numbers.
USE OF INDICES
Information about any indices shown herein is provided to allow for comparison of the performance of the strategy to that of certain well-known and widely recognized indices. There is no representation that such index is an appropriate benchmark for such comparison. You cannot invest directly in an index and the indices represented do not take into account trading commissions and/or other brokerage or custodial costs. The volatility of the indices may be materially different from that of the strategy. In addition, the strategy’s holdings may differ substantially from the securities that comprise the indices shown.
HYPOTHETICAL, BACKTESTED OR SIMULATED PERFORMANCE
Hypothetical, backtested or simulated performance is not an indicator of future actual results and has many inherent limitations. The results reflect performance of a strategy not currently offered to any investor and do not represent returns that any investor actually attained. One of the limitations of hypothetical performance results is that they are generally prepared with the benefit of hindsight.
Hypothetical performance may use, among other factors, historical financials (turnover, EBITDA, debit, financial multiples), historical valuations, macro variables and fund manager variables. Hypothetical results are calculated by the retroactive application of a model constructed on the basis of historical data and based on assumptions integral to the model which may or may not be testable and are subject to losses. Changes in these assumptions may have a material impact on the hypothetical (backtested/simulated) returns presented. Certain assumptions have been made for modeling purposes and are unlikely to be realized. No representations and warranties are made as to the reasonableness of the assumptions.
This information is provided for illustrative purposes only. Specifically, hypothetical (backtested/simulated) results do not reflect actual trading or the effect of material economic and market factors on the decision-making process. Hypothetical trading does not involve financial risk, and no hypothetical trading record can completely account for the impact of financial risk in actual trading. For example, the ability to withstand losses or to adhere to a particular trading program in spite of trading losses are material points which can also adversely affect actual trading results. Since trades have not actually been executed, results may have under- or over-compensated for the impact, if any, of certain market factors, such as lack of liquidity, and may not reflect the impact that certain economic or market factors may have had on the decision-making process. Further, backtesting allows the security selection methodology to be adjusted until past returns are maximized.
If hypothetical, backtested or simulated performance is shown gross of management fees, the inclusion of fees, costs and charges will reduce such numbers.
ASSESSMENTS
Unigestion may, based on its internal analysis, make assessments of a company’s future potential as a market leader or other success. There is no guarantee that this will be realised.
Legal Entities Disseminating This Document
UNITED KINGDOM
This material is disseminated in the United Kingdom by Unigestion (UK) Ltd., which is authorized and regulated by the Financial Conduct Authority (« FCA »). This information is intended only for professional clients and eligible counterparties, as defined in MiFID directive and has therefore not been adapted to retail clients.
UNITED STATES
This material is disseminated in the U.S. by Unigestion (UK) Ltd., which is registered as an investment adviser with the U.S. Securities and Exchange Commission (“SEC”). This information is intended only for institutional clients and qualified purchasers as defined by the SEC and has therefore not been adapted to retail clients.
EUROPEAN UNION
This material is disseminated in the European Union by Unigestion Asset Management (France) SA which is authorized and regulated by the French “Autorité des Marchés Financiers” (« AMF »).
This information is intended only for professional clients and eligible counterparties, as defined in the MiFID directive and has therefore not been adapted to retail clients.
CANADA
This material is disseminated in Canada by Unigestion Asset Management (Canada) Inc. which is registered as a portfolio manager and/or exempt market dealer in nine provinces across Canada and also as an investment fund manager in Ontario, Quebec and Newfoundland & Labrador. Its principal regulator is the Ontario Securities Commission (« OSC »). This material may also be distributed by Unigestion SA which has an international advisor exemption in Quebec, Saskatchewan and Ontario. Unigestion SA’s assets are situated outside of Canada and, as such, there may be difficulty enforcing legal rights against it.
SWITZERLAND
This material is disseminated in Switzerland by Unigestion SA which is authorized and regulated by the Swiss Financial Market Supervisory Authority (« FINMA »).
Document issued November 2023.