Persistence will pay off
Key Points
- Despite low levels of investment activity globally, we continue to see strong exit activity across all of our maturing portfolios. Over the last two years, we have now achieved eight exits from our direct funds at an average multiple of 3.6 x (3.0 x net)
- We expect exit activity to increase in 2024 but a record number of auctions will fail, leading to attractive investment opportunities. GP-led continuation funds will be the main driver behind growth in the secondary market
- Mid-market returns should be materially higher than large cap returns during 2024 and reshoring, healthcare innovation and education services are tipped as the key investment themes
Overview
2023 was a challenging year for the private equity industry, equivalent to running uphill into a stiff wind. Interest rates continued to rise in developed markets as central bankers fought persistent inflation, while geopolitical tensions heightened around the world.
Both investment and exit activity fell for the third successive year. Surprisingly, it was a record year for fundraising in terms of volume but a nine-year low in terms of number of funds raised. This increased concentration in fundraising suggests that the flight to “mega cap” safety continues. The current situation raises a number of intriguing questions for 2024: (1) How will investors resolve their liquidity pains? (2) Which segments of the market should see the best dealflow? (3) Will private equity returns remain robust? We are in store for another exciting year.
Down and Down
Private equity investment activity was down by over 30% at almost USD 500bn[1]. This was mainly driven by a big fall in North America (-39%) and APAC (-34%), while Europe was marginally up (+8%).
Exit activity also fell in 2023, by 10% to USD 439bn. This was driven by North America (-11%) and APAC (+13%), while Europe was up (+13%)[2].
In absolute terms, investment and exit activity are close to 2018/2019 levels. However, given that industry aggregate assets under management (calculated as aggregate NAV plus dry powder) have more than doubled since 2018, relative investment and exit activity are the lowest in over a decade.
Part of this can be explained by the elevated fundraising activity for large and mega funds in recent years, which led to an acceleration in industry AUM. In 2023, a record $387bn was raised globally for buyout funds, 34% higher than 2022 However, last year the 15 largest funds accounted for almost 50% of the total[3]. Simply put, many of these large and mega cap managers are fundraising more quickly than they can invest the capital, and then exit.
Figure 1: Exit activity
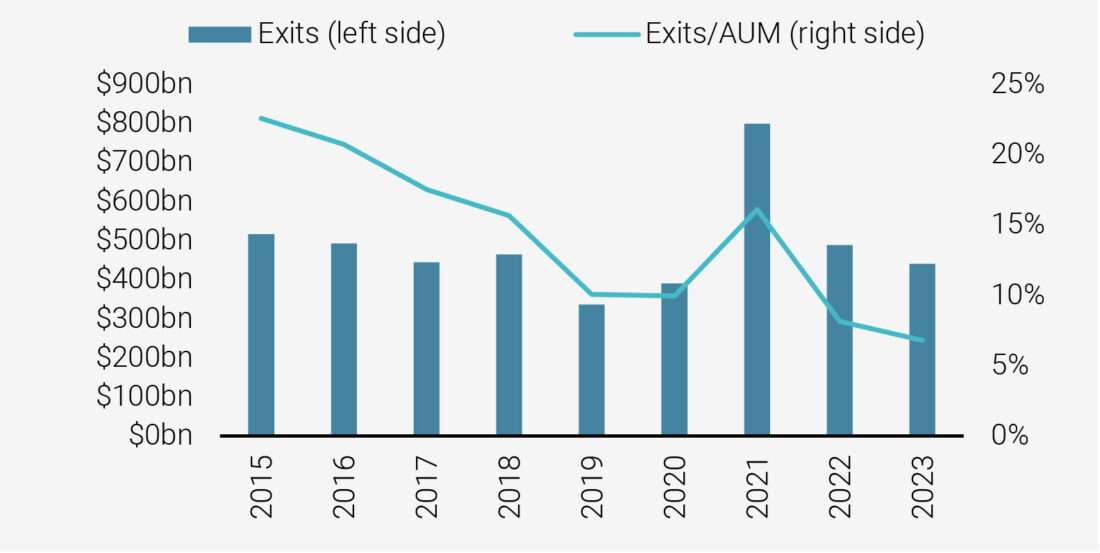
Source: Preqin, Prequin 2024.
In 2023, we continued investing our third Directs strategy, taking the portfolio to seven investments. Despite the difficult environment we have remained disciplined and have been able to invest in high quality, high growth companies playing our key investment themes at attractive valuations.
Furthermore, we have already seen promising development within the portfolio. On average, over the calendar year 2023, the seven portfolio companies grew revenues by 27% and EBITDA margins from 24.6% to 24.9%.
While all companies are doing well, the two standout performers are Frontier Waste Solutions and Bradford Health Services. When we invested in Frontier Waste, a Texas-based provider of solid waste services to the municipal, residential, commercial and industrial markets, the company was already an emerging leader having posted 23 consecutive quarters of revenue growth. We also had high confidence in the GP, Summer Street Capital, with whom we scored a 4.8x (4.5x net) realised return with Florida-based Coastal Waste in 2022. For the 12 months to the end of Q1 2024, the company is projected to deliver EBITDA of over USD 45m, more than double the EBITDA at which we invested in October 2022. This was achieved through multiple contract wins and a large landfill acquisition.
Similarly, we originally identified Bradford Health Services as a sector leader in the provision of substance use disorder treatment with over 40 facilities in five states. The GP, Lee Equity, had previous form with two other specialist treatment clinics where they achieved over 4x (3.3x net) realised returns on both companies. For the 12 months to November 2023, Bradford delivered EBITDA of over USD 46m, more than three times the EBITDA at which we invested in October 2022. This was achieved through a combination of organic growth and three add-on acquisitions.
On the back of this strong performance, we conservatively expect the portfolio to be valued at 1.4x (1.3x net) cost. We expect to have a final close for this strategy at the end of August 2024.
As we have written previously, we continue to see strong exit activity across all of our maturing portfolios. Over the last two years, we have now achieved eight exits from our direct funds at an average multiple of 3.6x (3.0x net). With several more companies ripe for exit, we anticipate that 2024 should be an even stronger year for exits, with as many as four exits expected from our second Directs strategy.
On the secondaries front, in 2023, we launched the fundraising period for our sixth secondaries strategy, targeting EUR 1.5bn. We had a first close in October 2023, enabling us to complete our first deal, Project Pandora, a sidecar fund consisting of three high growth enterprise software companies with Avataar, an Indian growth capital manager.
Project Pandora consists of Capillary, a global leading loyalty SaaS business, Chalo, India’s number one bus transport technology provider and Amagi, a global leading cloud-based provider for content creation, distribution and monetisation.
Project Pandora is a typical Unigestion secondary deal: it consists of leading assets in sectors with strong tailwinds, we are entering at an inflection point where growth is expected to accelerate due to concrete initiatives, early exits are expected from at least one of the assets, we know the GP extremely well having invested previously with them and, given this relationship, we have negotiated favourable terms with no management fee and tiered carried interest.
Given the broader malaise in exit activity, the secondaries market continues to be highly attractive. We will discuss the specific trends in the market in the coming quarters.
Our Private Equity outlook for 2024
It was largely predicted by market participants that 2023 would bounce back after a lull in 2022. This clearly did not come to pass and begs the question whether the bounce back is simply being delayed until 2024. We do not think it will be quite so simple.
However, despite the continued slowdown in activity, our 2023 predictions were directionally correct, if not right in magnitude.
First, while at time of writing it looks like the secondaries market was slightly higher in 2023 than 2022 (USD 115bn vs USD 110bn), it will be short of the record set in 2021 (USD 135bn)[4]. Given that LPs are not yet motivated enough to sell at any price, the bid-ask spread remained wide enough to dampen the growth in secondaries activity, especially at the large end of the market[5].
Second, we were correct that entry prices would shrink in the mid-market. In fact, median mid-market multiples in North America and Europe fell from 13.0x EBITDA in 2022 to 11.4x EBITDA, the lowest since 2016 and well below the peak of 14.3x set in 2019[6]. Given that investment activity was muted across the board, dry powder still grew by 7% among small and mid-market funds. Meanwhile, dry powder grew over 15% among large and mega cap funds, taking it to a record USD 500bn.
Third, secondary buyouts as an exit route did see an increase in 2023 against an overall decrease in exit activity – but only marginally. The number of exits via secondary buyouts increased from 663 to 680[7]. Based on our own experience of the large cap players often being prepared to outbid the trade buyers (4 out of 8 of our direct exits were to private equity buyers), we expect this trend to continue into 2024.
Fourth, while evidence is only anecdotal, family offices were, on average, willing to increase their allocation to private equity in 2023 (as reported by UBS, 38% wanted to increase while 13% wanted to decrease)[8]. Institutional investors, except for some of the largest sovereign wealth funds, were typically constrained by a lack of distributions.
For obvious reasons, it is extremely difficult to make predictions in the current environment. Nonetheless, we hope that our 2024 outlook provides some interesting reading and rationale behind the potential short- and long-term opportunities in the private equity market.
Exit activity will increase but a record number of auctions will fail, leading to attractive investment opportunities. Given the slow level of exit activity over the last two years, the aggregate exit pipeline has become more crowded than ever. Only the most attractive companies with strong financial fundamentals, clean balance sheets and demonstrable sustainable growth will make the cut in 2024. In addition, GPs may be over-ambitious on valuations. Therefore, while we expect the sell-side intermediaries to have a very busy year bringing private equity-backed companies to the market, we expect that a large number of auctions will not produce the desired price for the GP. Thus, in many cases, GPs will look for other alternatives for liquidity.
GP-led continuation funds will be the main driver behind growth in the secondary market. Given the overflowing exit pipeline mentioned above, many GPs will seek to use continuation funds as an alternative to provide liquidity for their best performing assets. This should provide a rich seam of attractive GP-led deal flow for secondary investors. Meanwhile, the growth in LP-stake activity will be constrained by LPs unwilling to accept material discounts. In addition, with higher interest rates, the large secondary investors are less able to execute on the large portfolio transactions which have traditionally been reliant on leverage. Nevertheless, the savvy secondary investor will still be able to selectively target high quality single fund LP-stakes, especially in cases where LPs can get liquidity without crystallising material losses.
Mid-market returns should be materially higher than large cap returns. In 2023, mid-market net annual returns were on average 15%, marginally higher than large (11%) and mega cap (14%)[9]. However, going into 2024, the relative advantage of mid-market over large and mega cap has never been stronger. Firstly, dry powder of large and mega cap funds continues to grow at twice the rate of that of mid-market funds. Secondly, mid-market EV/EBITDA multiples have fallen more quickly than overall market multiples (see above for both these points). Finally, overall debt to EBITDA multiples have fallen from 5.9x in 2022 to 5.0x in 2023[10]. Leverage is a much more important driver of returns for larger managers than for mid-market managers. Taking all of this together, we believe that mid-market returns should show clear outperformance in 2024.
The key investment topics for 2024 will be reshoring, healthcare innovation and education services. With increasing geopolitical tensions, supply chains are under scrutiny more than ever. This will lead to opportunities around reshoring and logistics services. Meanwhile, healthcare innovation is undergoing a boom, particularly in biopharma and life sciences, which will only increase with further AI penetration into this sector. Finally, with the continued shift to digital content, application of AI and the increasing skills gap amongst workers, innovative education services companies will benefit. We believe that there will be a notable uptick in deal flow in all of these sectors, especially in the mid-market.
Whatever happens, the diligent and persistent investor will be sure to find attractive opportunities in the face of continued challenging conditions. Limited partners and private equity managers will need to work hard to create alpha and, in some cases, will be forced out of their comfort zones. We are excited to embark on another year of deal doing and exit generating.
Unigestion Private Equity Activity
Here are the highlights of some of the investments and exits that we completed in Q4.
| In October, Cow Corner I, a portfolio fund of Emerging Manager Choice I, sold ISMS.online to ECI after a successful four-year investment partnership. ISMS.online is a market leading SaaS Information Security Management System (ISMS). ISO 27001 certifications have increased by 450% in the last ten years, and ISMS.online provides global SMEs and enterprise customers with an easy-to-use cloud-hosted ISMS to facilitate the adoption of ISO 27001 and over 100 other standards. Following the investment by Cow Corner in 2019, ISMS.online has built a best-in-class platform and became a market leader in the ISMS space. The exit was at 11.0x (10.3x net) TVPI and resulted in distributions to Emerging Manager Choice I of around EUR 8 million. | |
| In October as well, Unigestion completed a co-investment in Evora alongside Farview Equity Partners. Founded in 2011, Evora is a London-headquartered provider of environmental sustainability consulting, managed services and software, offering end-to-end solutions for commercial real estate funds. The client base is headquartered mainly in the UK, North America and Germany. The company is the largest contributor of reporting into GRESB standard and offers specialist knowledge around Net Zero Carbon, Green Finance, TCFD, and SFDR with the ability to frame into financial outcomes. The company is uniquely positioned as a strong provider of an integrated consulting and software product to benefit from strong tailwinds stemming from strong regulatory pressure and requirements to exploit emission data into actionable actions to reduce building emission. | |
| Also in October, after a holding period of just under three years, Unigestion, together with Afinum, sold Germany-based ERP software implementation and consulting firm Yaveon to VOLPi Capital. Yaveon is a leading ERP software and consulting company specializing in the Microsoft Dynamics ERP platform. It serves small and medium-sized companies operating in the biotechnology sector and offers a proprietary suite of industry extensions for process manufacturing. Headquartered in Germany, the company employs approximately 200 people and has a global customer base of over 600 active customers. The exit was at 3.3x (3.0x net) TVPI and resulted in distributions to Euro Choice Secondary II of around EUR 38 million. | |
| In the same month, Gilde Equity Management IV, a portfolio fund of Euro Choice VI, exited Team Eiffel to Towerbrook. Team EIFFEL is a high-end contingent workforce solutions provider serving a wide variety of end-markets with over 2,500 professionals. During Gilde’s holding period, a leading industry platform consisting of specialized business units has been created and together with eight add-ons over the past years, EBITDA has grown from EUR 8 million to expected EUR 45 million in 2023. The exit was at 3.7x (3.4x net) TVPI and resulted in distributions to Euro Choice VI of around EUR 11 million. | |
 |
At the end of October, we completed a direct secondary investment in CarbonFree Chemicals alongside Braemar Energy Ventures. Founded in 2005 and headquartered in Texas, CarbonFree has developed a technology, so-called SkyCycle, to directly capture CO2 emissions from a variety of hard-to-abate industry processes and convert the captured CO2 into carbon free chemicals – precipitated calcium carbonate (PCC) and hydrochloric acid (HCI) – with lower energy usage and costs than the market standards. CarbonFree has therefore a dual climate impact – the company significantly reduces GHG emissions from high emitting industries and serves the market with a carbon free product that will reduce Scope 3 GHG emissions of manufacturers across several industries, e.g. paper, paints, food, pharma. The company currently operates one facility in San Antonio, Texas, which has been profitably operating at full capacity for two years and a second facility is under development. |
| In December, Unigestion invested in Healthcare Australia through a single asset continuation fund managed by Crescent Capital Partners. Healthcare Australia is the #1 healthcare staffing and workforce management company in Australia. The business was founded in 1972 and covers healthcare staff recruitment, age care services, National Disability Insurance Scheme (NDIS) and training courses with more than 16’000 healthcare professionals. Healthcare Australia is the largest player in the workforce solutions business in Australia and is expected to see steady grow underpinned by the growing aging population increasing prevalence of chronic disease and treatment intensity. | |
| n December as well, CGS III, a portfolio fund of Euro Choice V, has listed R&S International Holding AG on the Swiss Exchange via a majority sale to VT5 Acquisition Company AG. VT5 was founded as an Special Purpose Acquisition Company (SPAC) and listed since 2015. R&S International Holding AG is one of the leading suppliers of electrical infrastructure products in key markets in Europe and the Middle East with more than 700 employees worldwide. With six production facilities and offices in Europe and the Middle East as well as a broad global partner network, R&S International Holding AG offers customers high-quality service and prompt support. Strong innovation skills and a high degree of flexibility enable the development of modern products and solutions that meet the demanding needs of customers. The exit was at 6.0x (5.6x net)TVPI and resulted in distributions to Euro Choice V of around EUR 17 million. | |
| Also in December, Unigestion committed to Lee Equity IV. Lee Equity is an established New York-based private equity firm that targets US mid-market businesses. The firm focuses on three core sectors: financial services, healthcare services and business services. It specifically targets growth opportunities, corporate carve-outs, public to privates, and buy-and-build platforms. Unigestion has built a strong relationship with Lee Equity since 2016 through a secondary and stapled primary investment, and several co-investments (including its recent exit of Captive Resources at 3.2x (3.0x net) TVPI) over the years. |
[1] [2]and [3] Preqin, January 2024.
[4]PJT PCS Market Intelligence, January 2024
[5]Preqin, January 2024
[6]Pitchbook, Apollo, Data as of 30 September 2023
[7]Pitchbook, Apollo, Data as of 30 September 2023
[8]UBS Global Family Office Report 2023 published in May 2023
[9]Preqin, January 2024 (performance for the 12 months to 30 September 2023)
[10]Pitchbook, Apollo, Data as of 30 September 2023
Important information
INFORMATION ONLY FOR YOU
This document has been prepared for your information only and must not be distributed, published, reproduced or disclosed (in whole or in part) by recipients to any other person without the prior written consent of Unigestion. It is neither directed to, nor intended for distribution or use by, any person or entity who is a citizen or resident of, or domiciled or located in, any locality, state, country or jurisdiction where such distribution, publication, availability or use would be contrary to law or regulation.
RELIANCE ON UNIGESTION
There is no guarantee that Unigestion will be successful in achieving any investment objectives. An investment strategy contains risks, including the risk of complete loss.
Except where otherwise specifically noted, the information contained herein, including performance data and assets under management, relates to the entire affiliated group of Unigestion entities over time. Such information is intended to provide you with background regarding the services, investment strategies and personnel of the Unigestion entities. No guarantee is made that all or any of the individuals involved in generating the performance on behalf of one or more Unigestion entities will be involved in managing any specific client account on behalf of another Unigestion entity.
NOT A RECOMMENDATION OR OFFER
This is a promotional statement of our investment philosophy and services only in relation to the subject matter of this presentation. It constitutes neither investment advice nor recommendation. This document represents no offer, solicitation or suggestion of suitability to subscribe in either the investment vehicles to which it refers or to any securities or financial instruments described herein. Any such offer to sell or solicitation of an offer to purchase shall be made only by formal offering documents, which include, among others, a confidential offering memorandum, limited partnership agreement (if applicable), investment management agreement (if applicable), operating agreement (if applicable), and related subscription documents (if applicable). Such documentation contains additional information material to any decision to invest. Please contact your professional adviser/consultant before making an investment decision.
Reference to specific securities should not be construed as a recommendation to buy or sell such securities and is included for illustration purposes only.
RISKS
Where possible we aim to disclose the material risks pertinent to this document. The views expressed in this document do not purport to be a complete description of the securities, markets and developments referred to in it. Unigestion maintains the right to delete or modify information without prior notice. The risk management practices and methods described herein are for illustrative purposes only and are subject to modification.
Investors shall conduct their own analysis of the risks (including any legal, regulatory, tax or other consequences) associated with an investment and should seek independent professional advice. Some of the investment strategies or financial instruments described or alluded to herein may be construed as high risk and not readily realisable investments, and may experience substantial & sudden losses including total loss of investment. These are not suitable for all types of investors. Unigestion has the ability in its sole discretion to change the strategies described herein.
PAST PERFORMANCE
Past performance is not a reliable indicator of future results, the value of investments, can fall as well as rise, and there is no guarantee that your initial investment will be returned.
If performance is shown gross of management fees, you should be aware that the inclusion of fees, costs and charges will reduce investment returns.
Returns may increase or decrease as a result of currency fluctuations.
NO INDEPENDENT VERIFICATION OR REPRESENTATION
No separate verification has been made as to the accuracy or completeness of the information herein. Data and graphical information herein are for information only and may have been derived from third party sources. Unigestion takes reasonable steps to verify, but does not guarantee, the accuracy and completeness of information from third party sources. As a result, no representation or warranty, expressed or implied, is or will be made by Unigestion in this respect and no responsibility or liability is or will be accepted. All information provided here is subject to change without notice. It should only be considered current as of the date of publication without regard to the date on which you may access the information. An investment with Unigestion, like all investments, contains risks, including total loss for the investor.
TARGET RETURNS, FORECASTS, PROJECTIONS
This document may contain forward-looking statements, including observations about markets and industry and regulatory trends as of the original date of this document. Forward-looking statements may be identified by, among other things, the use of words such as “expects,” “anticipates,” “believes,” or “estimates,” or the negatives of these terms, and similar expressions. Forward-looking statements reflect Unigestion’s views as of such date with respect to possible future events and are subject to a number of risks and uncertainties, including, but not limited to, the impact of competitive products, market acceptance risks and other risks. Actual results could differ materially from those in the forward-looking statements as a result of factors beyond a strategy’s or Unigestion’s control. You are cautioned not to place undue reliance on such statements. No party has an obligation to update any of the forward-looking statements in this document
Targeted returns reflect subjective determinations by Unigestion based on a variety of factors, including, among others, internal modeling, investment strategy, prior performance of similar products (if any), volatility measures, risk tolerance and market conditions. Target returns and/or forecasts are based on Unigestion’s analytics including upside, base and downside scenarios and might include, but are not limited to, criteria and assumptions such as macro environment, enterprise value, turnover, EBITDA, debt, financial multiples and cash flows. Targeted returns and/or forecasts are not intended to be actual performance and should not be relied upon as an indication of actual or future performance.
If target returns, forecasts or projections are shown gross of management fees, the inclusion of fees, costs and charges will reduce such numbers.
USE OF INDICES
Information about any indices shown herein is provided to allow for comparison of the performance of the strategy to that of certain well-known and widely recognized indices. There is no representation that such index is an appropriate benchmark for such comparison. You cannot invest directly in an index and the indices represented do not take into account trading commissions and/or other brokerage or custodial costs. The volatility of the indices may be materially different from that of the strategy. In addition, the strategy’s holdings may differ substantially from the securities that comprise the indices shown.
HYPOTHETICAL, BACKTESTED OR SIMULATED PERFORMANCE
Hypothetical, backtested or simulated performance is not an indicator of future actual results and has many inherent limitations. The results reflect performance of a strategy not currently offered to any investor and do not represent returns that any investor actually attained. One of the limitations of hypothetical performance results is that they are generally prepared with the benefit of hindsight.
Hypothetical performance may use, among other factors, historical financials (turnover, EBITDA, debit, financial multiples), historical valuations, macro variables and fund manager variables. Hypothetical results are calculated by the retroactive application of a model constructed on the basis of historical data and based on assumptions integral to the model which may or may not be testable and are subject to losses. Changes in these assumptions may have a material impact on the hypothetical (backtested/simulated) returns presented. Certain assumptions have been made for modeling purposes and are unlikely to be realized. No representations and warranties are made as to the reasonableness of the assumptions.
This information is provided for illustrative purposes only. Specifically, hypothetical (backtested/simulated) results do not reflect actual trading or the effect of material economic and market factors on the decision-making process. Hypothetical trading does not involve financial risk, and no hypothetical trading record can completely account for the impact of financial risk in actual trading. For example, the ability to withstand losses or to adhere to a particular trading program in spite of trading losses are material points which can also adversely affect actual trading results. Since trades have not actually been executed, results may have under- or over-compensated for the impact, if any, of certain market factors, such as lack of liquidity, and may not reflect the impact that certain economic or market factors may have had on the decision-making process. Further, backtesting allows the security selection methodology to be adjusted until past returns are maximized.
If hypothetical, backtested or simulated performance is shown gross of management fees, the inclusion of fees, costs and charges will reduce such numbers.
ASSESSMENTS
Unigestion may, based on its internal analysis, make assessments of a company’s future potential as a market leader or other success. There is no guarantee that this will be realised.
Legal Entities Disseminating This Document
UNITED KINGDOM
This material is disseminated in the United Kingdom by Unigestion (UK) Ltd., which is authorized and regulated by the Financial Conduct Authority (« FCA »). This information is intended only for professional clients and eligible counterparties, as defined in MiFID directive and has therefore not been adapted to retail clients.
UNITED STATES
This material is disseminated in the U.S. by Unigestion (UK) Ltd., which is registered as an investment adviser with the U.S. Securities and Exchange Commission (“SEC”). This information is intended only for institutional clients and qualified purchasers as defined by the SEC and has therefore not been adapted to retail clients.
EUROPEAN UNION
This material is disseminated in the European Union by Unigestion Asset Management (France) SA which is authorized and regulated by the French “Autorité des Marchés Financiers” (« AMF »).
This information is intended only for professional clients and eligible counterparties, as defined in the MiFID directive and has therefore not been adapted to retail clients.
CANADA
This material is disseminated in Canada by Unigestion Asset Management (Canada) Inc. which is registered as a portfolio manager and/or exempt market dealer in nine provinces across Canada and also as an investment fund manager in Ontario, Quebec and Newfoundland & Labrador. Its principal regulator is the Ontario Securities Commission (« OSC »). This material may also be distributed by Unigestion SA which has an international advisor exemption in Quebec, Saskatchewan and Ontario. Unigestion SA’s assets are situated outside of Canada and, as such, there may be difficulty enforcing legal rights against it.
SWITZERLAND
This material is disseminated in Switzerland by Unigestion SA which is authorized and regulated by the Swiss Financial Market Supervisory Authority (« FINMA »).
Document issued November 2023.