A year ago, tighter monetary policy, heightened political risks and decelerating macro forces wrong-footed investors as US stocks fell 20% over Q4 2018. Then, one after the other, these headwinds retreated exactly in the order they appeared, starting with monetary policy. US stocks reacted strongly, delivering a performance of around +32% since they bottomed. However, we believe the problem we are now facing is of a different kind: the current recovery has led many equity indices to look expensive. While we have been positive on stocks since early September due to macro stabilisation and overly pessimistic market sentiment, we are now not as positive as before. Is it time to call everything expensive and shop for assets based on their price tag, or are we likely to see a prolonging of this everything-rally period? We see a more limited upside from now, without changing our bullish positioning. Growth drivers have stabilised considerably since June, following the end of the slowdown that started in January 2018. The “mid-cycle” pause called by Fed Chair Jerome Powell has led to a one-of-a-kind situation: world growth remains decent while monetary policy has become once again incrementally more accommodative. This is due to an unlikely combination of factors. First, the trade war between the US and China led to a 3.5% net contraction in global trade between October 2018 and June 2019. Historically, contractions in global trade are reliable recessionary indicators. In 2001, global trade contracted by 6%, by 20% in 2008 and by 2% in 2015. Little wonder central banks adopted a change in tone from unwinding quantitative easing to further easing across the G10 world. The spectre of recession was looming and a prudent reaction was required. In the meantime, the Eurozone was indicating strong signs of deceleration, particularly in historically more robust economies such as Germany. But all of that is now behind us, or so it seems. Private sector economists expect the global economy to grow by 3.1%, 3% for the IMF and 2.9% for the OECD and the World Bank. Did someone say recession? The robustness of the growth has of course a lot to do with the solidity of developed world consumption: +2.6% this year in the US, +1.2% in the Eurozone and +0.9% in Japan. These numbers are dwarfed by +8% in China, but they provide a strong guarantee that we will not see a recession in 2019 or the beginning of 2020. This satisfactory macro situation has been largely confirmed by corporate earnings this year. S&P 500 company sales have grown by more than 3% each quarter, while analysts expect Q4 to be a bottom before sales growth resumes above 4%. In the case of the Eurostoxx 600, sales grew every quarter by at least 1%. The same holds true for many developed economies. Any earnings contraction witnessed this year came mainly from tighter margins. If valuations were attractive in early September, the current situation is different, in our view. Equities have rallied sharply since then, leading most regional indices into higher territories. Using a discounted cash flow model, we can turn the price of regional indices into a 12-month implied earnings growth rate. By doing so, we can judge the expensiveness of equities in relation to the current dynamism of the economy. What is the outcome of this analysis? A mixed picture: the MSCI World index needs to see its earnings growth reach 18% over the next 12 months, driven by US stocks now expecting 24% earnings growth and European stocks, 21%. These numbers are consistent with other valuation metrics: when looking at a cross section of indicators, US and European stocks are expensive. The S&P 500 index sits in its 87th valuation percentile across a large number of metrics. According to our estimates, this usually leads to a -4.5% correction over the following three months. The Eurostoxx index has now reached its 81st percentile: European stocks are no longer cheap and have now reached the valuation danger zone, similar to US stocks. Only emerging and Japanese stocks remain cheaper, with limited expected earnings growth. Are equities the only asset at valuation risk? We do not think so. We look at valuation relative to other risk premia and history, based on carry. This analysis shows that credit (investment grade and high yield) spreads are historically tight. Indeed, most hedging instruments, such as government bonds, gold, inflation breakevens, the yen and the Swiss franc, are equally expensive. What makes this situation exceptional is that everything looks expensive to some extent: both hedges and growth-oriented assets. We think that current valuations are probably the number one risk to our still-positive scenario.“Price Tag” – Jessie J, 2011
What’s Next?
What Recession?
Valuations are Higher than You Think

Sentiment could be the game changer. In the case of equities, high valuations could well become justified by continued macro improvement. If price/earnings ratio expansion becomes justified by strong earnings growth, then the equity rally will continue and hedging assets will be at risk in the coming months. Why is that so? Mainly because the last leg of this year’s equity rally happened with a low participation rate: cash remains king for now in spite of low-to-negative rates. According to our estimates, the multi asset fund industry’s beta to equities remains lower than a year ago, highlighting a lack of investor conviction. Nothing grows forever but earnings growth is likely to continue over Q4 this year and into Q1 2020. If we are right and investors get caught in this late equity fever, the rally is not over yet. This valuation risk has only created a more limited upside potential for now unless we see a large and ample growth improvement. That is where the surprise could come from. Analysts have, on average, a very different view of earnings growth. Throughout the year, their growth forecasts for earnings have decreased continuously (as usual), reaching zero to negative values. On average, analysts are expecting a profit stall. Expectations are most negative for emerging stocks – analysts expect a 10% contraction in profits in 2019. In the case of Europe, this number is around 0.5%, and 2% in the US. Should these expectations be proven wrong, valuations would be amply justified. For all these reasons, we maintain our positive stance towards growth assets and will probably do so until we see a material deterioration in the growth situation. We have started adding hedges against a fall in equities. Yet, given the fact that investor hedge positions are still large, we still expect a constructive investor attitude in the event of a drop in equities.Sentiment: the Game Changer?

Price Tag

Our medium-term view is currently constructive: we are still overweight growth assets and underweight precious metals. We are using option and forex-based strategies to hedge ourselves against adverse market conditions. Month to date, the Multi Asset Risk Targeted Strategy is up 1.17% versus a 2.11% return for the MSCI AC World Index and a -0.50% return for the Barclays Global Aggregate (USD hedged). Year-to-date, the Multi Asset Risk Targeted Strategy has returned 11.45% versus 21.90% for the MSCI AC World index, while the Barclays Global Aggregate (USD hedged) index is up 8.02%. * The Multi Asset Risk Targeted Strategy performance is shown in USD net of fees for the representative account of the Multi Asset Risk Targeted (Medium) USD Composite and reflects the deduction of advisory fees and brokerage commission and the reinvestment of all dividends and earnings. Past performance is not indicative of future performance. This information is presented as supplemental information only and complements the GIPS compliant presentation provided on the following page.Strategy Behaviour
Performance Review
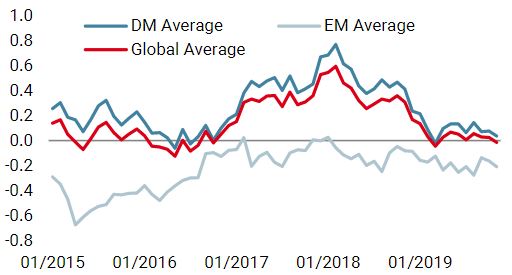
Unigestion Nowcasting
World Growth Nowcaster
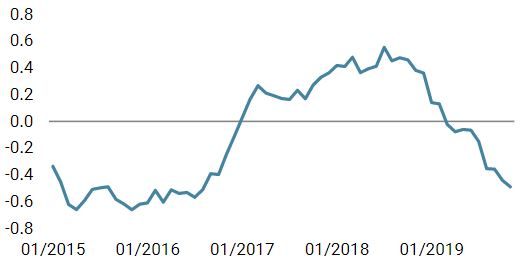
World Inflation Nowcaster
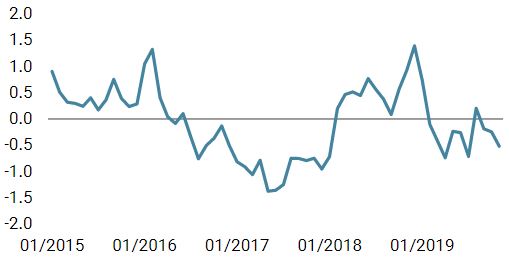
Market Stress Nowcaster
Weekly Change
- Our world Growth Nowcaster declined last week. However, 50% of the data is still improving and growth stabilisation remains on the cards.
- Our world Inflation Nowcaster decreased again and inflation risk remains very low.
- Market stress increased, driven by all its components.
Sources: Unigestion. Bloomberg, as of 18 November 2019.
Important Information
Past performance is no guide to the future, the value of investments can fall as well as rise, there is no guarantee that your initial investment will be returned. This document has been prepared for your information only and must not be distributed, published, reproduced or disclosed by recipients to any other person. This is a promotional statement of our investment philosophy and services only in relation to the subject matter of this presentation. It constitutes neither investment advice nor recommendation. This document represents no offer, solicitation or suggestion of suitability to subscribe in the investment vehicles it refers to. Please contact your professional adviser/consultant before making an investment decision. Where possible we aim to disclose the material risks pertinent to this document, and as such these should be noted on the individual document pages. Please contact Unigestion for a complete list of all the applicable risks. Some of the investment strategies described or alluded to herein may be construed as high risk and not readily realisable investments, which may experience substantial and sudden losses including total loss of investment. These are not suitable for all types of investors. To the extent that this report contains statements about the future, such statements are forward-looking and subject to a number of risks and uncertainties, including, but not limited to, the impact of competitive products, market acceptance risks and other risks. As such, forward looking statements should not be relied upon for future returns. Data and graphical information herein are for information only and may have been derived from third party sources. Unigestion takes reasonable steps to verify, but does not guarantee, the accuracy and completeness of this information. As a result, no representation or warranty, expressed or implied, is or will be made by Unigestion in this respect and no responsibility or liability is or will be accepted. All information provided here is subject to change without notice. It should only be considered current as of the date of publication without regard to the date on which you may access the information. Rates of exchange may cause the value of investments to go up or down. An investment with Unigestion, like all investments, contains risks, including total loss for the investor.
This information is issued by Unigestion (UK) Ltd (“Unigestion”), which is authorised and regulated by the UK Financial Conduct Authority (“FCA”). Unigestion is also registered as an investment adviser with the U.S. Securities and Exchange Commission (“SEC”). This information is intended only for professional clients, institutional clients and eligible counterparties, as defined by the FCA, and qualified purchasers as defined by the SEC and has therefore not been adapted to retail clients.
Unigestion Multi Asset Risk-Targeted (USD): 31 December 2014 to 30 September 2019
| Year | Composite Return Gross of Fees |
Composite Net Return | Benchmark Return | Number of Accounts | Internal Dispersion | Composite 3-Yr Std Dev | Benchmark 3-Yr Std Dev | Composite AUM (M) | Firm AUM (M) |
| 2015 | -1.61% | -2.80% | – | 1 | – | – | – | 127.24 | 15,550.31 |
| 2016 | 5.05% | 3.79% | – | 1 | – | – | – | 129.66 | 18,144.46 |
| 2017 | 11.16% | 9.82% | – | 1 | – | 4.79% | – | 169.51 | 22,340.80 |
| 2018 | -2.91% | -4.08% | – | 1 | – | 3.72% | – | 286.93 | 21,403.49 |
| 20191 | 10.70% | 9.70% | – | 1 | – | 4.43% | – | 361.96 | 20,974.34 |
1: This year is incomplete, it stops in September.
Special Disclosure: For presentations prior to 31.03.2018 the strategy was measured against the LIBOR 3M USD + 4%. Beginning April 2018 the firm determined that the benchmark did not accurately reflect the strategy mandate and the benchmark was removed. Definition of the Firm: For the purposes of applying the GIPS Standards, the firm is defined as Unigestion. Unigestion is responsible for managing assets on the behalf of institutional investors. Unigestion invests in several strategies for institutional clients: Equities, Hedge Funds, Private Assets and the solutions designed for the clients of our Cross Asset Solution department. The GIPS firm definition excludes the Fixed Income Strategy Funds, which started in January 2001 and closed in April 2008, and the accounts managed for private clients. Unigestion defines the private clients as High Net Worth Families and Individual investors. Policies: Unigestion policies for valuing portfolios, calculating performance, and preparing compliant presentations are available upon request. Composite Description: The Multi Risk Targeted (Medium) composite was defined on 15 December 2014. It consists of accounts which aim to deliver consistent smooth returns of cash + 5% gross of fees across all market conditions over a 3-year rolling period. It seeks to achieve this by capturing the upside during bull markets while protecting capital during market downturns. Benchmark: Because the composites strategy is absolute return and investments are permitted in all asset classes, no benchmark can reflect this strategy accurately. Fees: Returns are presented gross of management fees, administrative fees but net of all trading costs and withholding taxes. The maximum management fee schedule is 1.2% per annum. Net returns are net of model fees and are derived by deducting the highest applicable fee rate in effect for the respective time period from the gross returns each month. List of Composites: A list of all composite descriptions is available upon request. Minimum Account Size: The minimum account size for this composite is 5’000’000.- USD. Valuation: Valuations are computed in US dollars (USD). Performance results are reported in US dollars (USD). Internal Dispersion & 3YR Standard Deviation: The annual composite dispersion presented is an asset-weighted standard deviation calculated for the accounts in the composite the entire year. When internal dispersion is not presented it is as a result of an insufficient number of portfolios in the composite for the entire year. When the 3 Year Standard Deviation is not presented it is as a result of an insufficient period of time. Compliance Statement Unigestion claims compliance with the Global Investment Performance Standards(GIPS®) and has prepared and presented this report in compliance with the GIPS standards. Unigestion has been independently verified for the periods 1 January 2003 to 31 December 2016. The verification report(s) is/are available upon request. Verification assesses whether (1) the firm has complied with all the composite construction requirements of the GIPS standards on a firm-wide basis and(2) the firms policies and procedures are designed to calculate and present performance in compliance with the GIPS standards. Verification does not ensure the accuracy of any specific composite presentation.