Earnings Season Provides Only Modest Support
Earnings season for Q4 2021 is in full swing, with over 60% of firms in the S&P 500 and over 35% of firms in the Stoxx 600 having reported thus far. Subdued expectations have led to low hurdle rates for earnings, cleared by 75% of reporting firms in the S&P 500 and 58% of those in the Stoxx 600. As in recent earnings seasons, the market has been less receptive to the results. Looking ahead, healthy (but slowing) global growth and elevated margins, thanks in part to higher productivity, should support 2022 earnings, though too restrictive monetary policy could spoil the profit picture. Strong corporate investment activity should support the markets and the real economy, one of the positive factors behind our modest preference for equities.

I’ve Heard that Song Before

What’s Next?
A familiar tune
Q4 2021 corporate earnings season is shaping up to be quite similar to past earnings seasons: sales and earnings estimates were relatively moderate, and while firms generally outperformed analyst estimates, investors were unimpressed. In aggregate, across the 64% reporting firms in the S&P 500, sales and earnings are up 16% and 27% respectively on a year-over-year basis. The Energy sector is a standout, benefiting from higher energy prices with sales up over 80% y/y (earnings are up over 2800% but that compares to miniscule earnings in Q4 2020). Over 68% of S&P 500 firms have beat their sales estimates, while over 75% have beat on earnings. With a calendar picking up steam this week and 36% of the Stoxx 600 firms having already reported, results thus far are solid: sales are up 26%, while earnings are up 92% (with base effects impacting earnings growth figures). Nearly 75% of Stoxx 600 firms have beat their sales estimates, while 58% have beat on earnings. Despite the healthy results, investors have badly punished the firms missing their estimates and only moderately rewarded the ones that beat theirs: the median 1-day return (relative to the market) of S&P 500 firms missing their estimates was -3.4% while the median return of firms beating was 0.3%. The figures for the Stoxx 600 firms was similar: -2.5% vs 0.2%. As in recent earnings seasons, investors are unimpressed.
Corporate profitability at highs
As we have discussed recently, our Growth Nowcasters point to decent levels of economic activity, even if the pace of economic expansion looks to have slowed considerably. Currently, developed world economies and the overall global economy looks to be expanding at an above-trend pace, which should support continued strong revenue growth. Costs of raw materials, energy, and labour have shot up, as evidenced by increasingly higher price indices. Nonetheless, profitability remains healthy and even improved over recent months: as Figure 1 shows, profit margins are at or above historical highs. The upward trend is especially stark for the energy sector, but also holds true for the broader indices.
Figure 1: Profit Margins (12-month trailing)
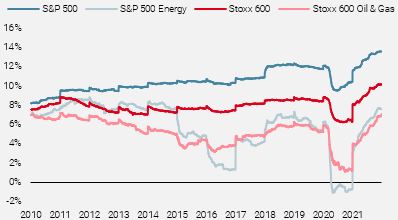
Source: Bloomberg, Unigestion. As of 09.02.2022.
These robust and improving margins reflect a combination of passing costs through to consumers as well as an increase in productivity during the pandemic. Figure 2 shows the annual growth in unit labour costs for nonfarm businesses in the US, reflecting a significant pickup in productivity since mid-2020.
Figure 2: Unit Labour Costs for US Nonfarm Businesses
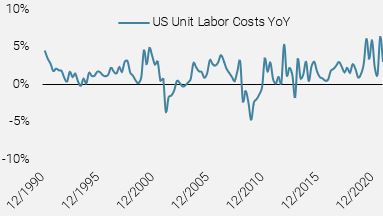
Source: Bloomberg, Unigestion. As of 09.02.2022.
2022 EPS estimates trending higher but remain subdued
A still-strong economic expansion combined with robust profitability would point towards strong earnings for this year. Yet consensus estimates are rather dour: 9% y/y growth for the S&P 500 and 6% for the Stoxx 600. For context, median EPS growth has been 10% y/y for both the S&P 500 (1990 to 2019) and Stoxx 600 (2003 to 2019). Figure 3 shows higher revised 2022 EPS estimates, but that change has largely been driven by rising 2021 EPS. Comparing 2022 EPS year-over-year growth estimates today versus the start of 2021, we see no change for the S&P 500 (8.8% vs 8.7%) and in fact lower expectations for the Stoxx 600 (5.7% vs 7.1%).
Figure 3: 2022 EPS Estimates
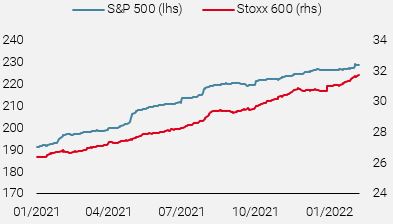
Source: Bloomberg, Unigestion. As of 09.02.2022.
Tightening monetary policy could be a spoiler for corporate earnings: rising short-term rates and bond yields mean higher borrowing costs for consumers and businesses, and the negative wealth effect of higher discount rates may further deter spending. The end of 2021 already saw US personal savings rates tick up, possibly as a precautionary measure. As mentioned above, our Growth Nowcaster has slowed considerably, and the consumption component is now below trend. Monetary tightening into decelerating growth runs the risk of further slowdown, raising the concern of a policy mistake that would put a serious dent into 2022 earnings. However, we believe the Fed will act with more patience and adjust its rhetoric and policy if its actions prove too restrictive (though such a pivot would be months away).
Putting capital to work
The strong revenue and earnings results have helped corporates maintain cash balances at all-time highs. For example, of the S&P 500 non-financial companies reporting thus far, aggregate cash balance sits at 1.4trn USD, down slightly from 1.5trn USD a year ago. The largest use of this cash drawdown has been stock buybacks, which are up 20% q/q and 73% y/y for reporting firms. Indeed, 2021 saw 813bn USD in announced buybacks, second only to 2018’s 939bn USD. For 2022 so far, announced buybacks are just slightly below their 3-year average pace.
The other key use of corporate cash has been capital expenditures, which are up 13% q/q and 18% y/y for S&P 500 firms reporting thus far. As Figure 4 shows, capex has started to recover from the pandemic lows but remains below previous peaks. Having been a major drag for both the S&P 500 and Stoxx 600, the energy sector is now seeing a sharp recovery on the back of strong demand and limited supply.
Figure 4: Capex Growth (year-over-year, 12-month trailing)
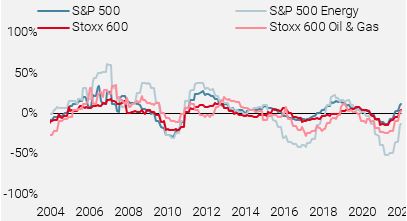
Source: Bloomberg, Unigestion. As of 09.02.2022.
Overall, we have a modest positive view on equities, reflecting the crosscurrents at play today: macro fundamentals are broadly supportive but deteriorating and could collapse if central banks, especially the Fed, tighten too aggressively. Earnings estimates are conservative and lower equity supply should provide support, but various indicators we track suggest that there is room for more downside ahead. Thus, we maintain a relatively light dynamic allocation, with high conviction views reflected in real assets and currencies and only modest exposure to duration and equities.
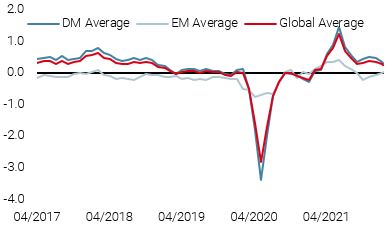
Unigestion Nowcasting
World Growth Nowcaster
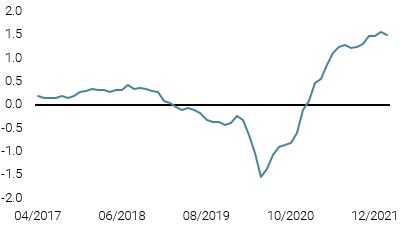
World Inflation Nowcaster
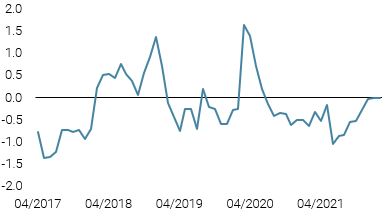
Market Stress Nowcaster
Weekly Change
- Last week, our World Growth Nowcaster moved slightly lower again with less positive data from the US, though Chinese data did improve.
- Our World Inflation Nowcaster was stable over the week, with most countries seeing inflation pressures largely unchanged.
- Our Market Stress Nowcaster moved modestly lower over the week, as improving liquidity offset higher volatility and widening spreads.
Sources: Unigestion, Bloomberg, as of 11 February 2022
Important Information
This document is provided to you on a confidential basis and must not be distributed, published, reproduced or disclosed, in whole or part, to any other person.
The information and data presented in this document may discuss general market activity or industry trends but is not intended to be relied upon as a forecast, research or investment advice. It is not a financial promotion and represents no offer, solicitation or recommendation of any kind, to invest in the strategies or in the investment vehicles it refers to. Some of the investment strategies described or alluded to herein may be construed as high risk and not readily realisable investments, which may experience substantial and sudden losses including total loss of investment.
The investment views, economic and market opinions or analysis expressed in this document present Unigestion’s judgement as at the date of publication without regard to the date on which you may access the information. There is no guarantee that these views and opinions expressed will be correct nor do they purport to be a complete description of the securities, markets and developments referred to in it. All information provided here is subject to change without notice. To the extent that this report contains statements about the future, such statements are forward-looking and subject to a number of risks and uncertainties, including, but not limited to, the impact of competitive products, market acceptance risks and other risks.
Data and graphical information herein are for information only and may have been derived from third party sources. Although we believe that the information obtained from public and third party sources to be reliable, we have not independently verified it and we therefore cannot guarantee its accuracy or completeness. As a result, no representation or warranty, expressed or implied, is or will be made by Unigestion in this respect and no responsibility or liability is or will be accepted. Unless otherwise stated, source is Unigestion. Past performance is not a guide to future performance. All investments contain risks, including total loss for the investor.
Unigestion SA is authorised and regulated by the Swiss Financial Market Supervisory Authority (FINMA). Unigestion (UK) Ltd. is authorised and regulated by the UK Financial Conduct Authority (FCA) and is registered with the Securities and Exchange Commission (SEC). Unigestion Asset Management (France) S.A. is authorised and regulated by the French “Autorité des Marchés Financiers” (AMF). Unigestion Asset Management (Canada) Inc., with offices in Toronto and Montreal, is registered as a portfolio manager and/or exempt market dealer in nine provinces across Canada and also as an investment fund manager in Ontario and Quebec. Its principal regulator is the Ontario Securities Commission (OSC). Unigestion Asset Management (Copenhagen) is co-regulated by the “Autorité des Marchés Financiers” (AMF) and the “Danish Financial Supervisory Authority” (DFSA). Unigestion Asset Management (Düsseldorf) SA is co-regulated by the “Autorité des Marchés Financiers” (AMF) and the “Bundesanstalt für Finanzdienstleistungsaufsicht” (BAFIN).