Reverse Goldilocks Or The End of Easy Money
Head of Macro and Dynamic Allocation, Cross Asset Solutions
During the Fed’s May press conference, President Powell said, “75 basis points isn’t something the FOMC is actively considering”. A few weeks later, however, following higher than expected headline inflation figures, the Fed delivered the largest hike since 1994 with a move of… 75 basis points. This sequence echoes the famous sentence from Alan Greenspan: “I know you think you understand what you thought I said but I’m not sure you realize that what you heard is not what I meant” and illustrates the limited visibility of the current “End of Easy Money” journey. In that context, we believe that a “Reverse Goldilocks” environment entails a higher risk premium through higher implied and realised volatility, reflecting the narrow path between a soft and hard landing as well as between “sticking to the mandate” and making a policy mistake.

Like a Rolling Stone

What’s Next
Reverse Goldilocks means deteriorated market conditions…
After two turbulent years of deep recession and extreme recovery, we see 2022 as the year of normalisation with regards to policy mix, economic activity, and inflation. Over the first part of the year we observed slowing growth, a peak in inflation expectations, and major shifts in monetary policy, as central banks simultaneously started an aggressive cycle of rate hikes coupled with a higher risk of surprise, as shown by last week’s move by the SNB and the guidance delivered by the BoE. Last but not least, we also witnessed a fiscal cliff, as governments ended support measures to households. All of these factors provoked a spike in volatility and triggered large dispersions across and within assets, causing liquidity and market sentiment to deteriorate (Figure 1).
Figure 1: US equity liquidity and breadth
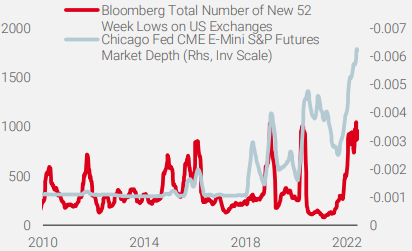
Source: Bloomberg, Unigestion, as of 17 June 2022 (lower market depth means poorer liquidity conditions)
Against this backdrop, flexibility in views and positioning are key to navigate a world where any incremental change could dramatically affect market sentiment. Given the repricing which occurred in the first months of the year, the key question for the coming quarters is: “Where will this journey end?”. Most bullish investors base their views on the following elements: 1) bearish sentiment, 2) no recession, given the strength of US consumers, 3) global post-COVID reopening, and 4) China stimulus and recovery. We prefer staying cautiously positive, mainly because we think that the tightening of global financial conditions is far from over.
We continue to believe that the interplay between real rates, gauged through market based inflation expectations, and the scale of the US economy slowdown, which we track via our proprietary Nowcasters, will provide the best signal to differentiate between a bottom in equities and bear market rally. The good news is that current expectations for monetary policy and earnings growth incorporate a lot of bad news, including a hawkish Fed, weaker macro momentum, and higher uncertainty. As such, our US Growth Nowcaster is far from recessionary levels. The bad news is that the required tightening in financial conditions to curb inflation could be larger than currently priced, which in turn would increase recession risk and lower the growth premium in the coming months. As a result, “Don’t Fight the Fed” would imply higher real rates and tighter financial conditions, which is historically a less favourable context for growth-oriented assets, especially after years of “beta party”, fuelled by an ultra-accommodative policy mix.
Reverse Goldilocks means higher real rates…
We believe that real rates, which reflect the difference between nominal rates and inflation expectations for a given maturity, are good tools for determining the nature of monetary policy. Since the first Fed rate hike in March 2022, US real 10-year rates have risen by roughly 130 bps from -0.7% to 0.6%. Over the last three Fed-hiking cycles since 1999, the change in 10-year real rates was on average 110 basis points, hence a bit lower than the current adjustment. Nevertheless, history also shows that the Fed never stops to tighten financial conditions before 10-year real rates rise above 1% (4.2% in 2000, 2.5% in 2007 and 1.2% in 2018). Current 10-year real rates remain 30 basis points below the 2018 level of 1.2%, which doesn’t seem to be the right policy calibration, as core inflation is at a 6.0%. Indeed, given that the current context features a record overshoot of inflation vs. its target and that the starting point for monetary normalisation is unusually accommodative, it seems reasonable to expect a larger rise in real rates and higher terminal real rates compared to those seen during the previous hiking cycles. This expected rise would be driven by higher Fed fund rates and a shrinking Fed balance sheet.
Regarding the nominal terminal rate (the level at which policy rates – US Fed funds – will stop going up), Fed funds futures currently price it around 3.75%, in line with the latest median Fed dots projection released last week. Putting this into perspective, this would be the second lowest terminal rate in history, after the one of 2015/2018, when Yellen engineered a gentle, well-telegraphed upward cycle, where employment mattered much more than inflation, which has never been as bad as today since 1980. Nevertheless, the change in Fed fund rates would be similar to those observed over the latest 5 hiking cycles (Figure 2).
Figure 2: Current hiking cycle vs history
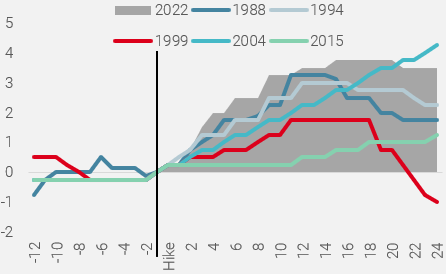
Note: 2022 Fed hiking cycle is based on Fed fund futures. X-axis shows number of months before and after cycle start.
Source: Bloomberg, Fed, Unigestion, as of 17 June 2022.
If we add the impact of quantitative tightening (QT) that started in June (a recent Fed study estimates the coming QT to be equivalent to 50bps of Fed fund rates), the overall tightening for the next 12 months could approach, in cumulated terms, roughly 400 bps, a historically sizeable tightening cycle (Figure 2).
…and tighter financial conditions
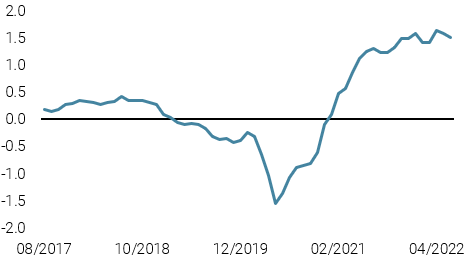
The Chicago Fed Financial Indicator that tracks financial conditions is currently at -0.2 and thereby indicates that current financial conditions are looser than average, which goes counter the views on normalisation expressed by the Fed members. We are therefore convinced that, despite an increase of 0.3 in the National Financial Conditions Index (NFCI) since the Fed’s U-turn on inflation’s transitory effect in Q4 2021, the path to tighter conditions is far from over. When analysing the 1970s Fed tightening episode, we find that during this period of rate hikes, the NFCI was at 0.05 on average, 0.3 higher than current levels. More importantly, across these different periods, the NFCI increased by 1.02 on average during the rate hike cycles. Changes in financial conditions have historically affected growth-oriented assets. Figure 3 shows the difference in the Price Earnings Ratio for US equities when US financial conditions are loose or restrictive. Tighter financial conditions, as measured by the Chicago Fed, implies a lower ratio, corresponding to a 15% to 20% downward adjustment from its historical average over the period.
Figure 3: S&P500 PE Ratio with respect to FCI (1990-2022)
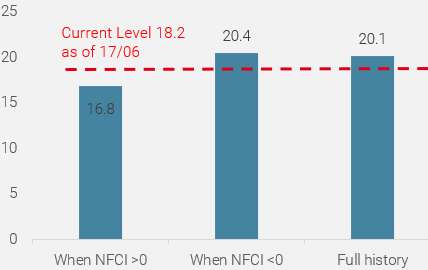
Source: Bloomberg, Unigestion, as of 17 June 2022
In such a financial context, where “easy money”, the biggest support for growth-oriented assets over the last 10 years, has been reversed, we maintain a cautious stance in our tactical positioning. When the Fed and other central bankers are deflating asset prices to curb inflation, there are very few safe places to hide. As such, credit spreads and most equity markets have room to deteriorate further, to incorporate the tighter financial conditions we expect in the coming quarters. In addition, given the slowdown we expect in investment and consumption, real assets should decline from the very high levels reflected in the inflation risk premium. This downward adjustment, combined with higher risk of market turmoil and more attractive yields, should improve the risk-reward for sovereign bonds as a hedge for growth risk. Against that backdrop, the US dollar should stay strong, mainly against funding currencies struggling with deep negative real rates for a long time.
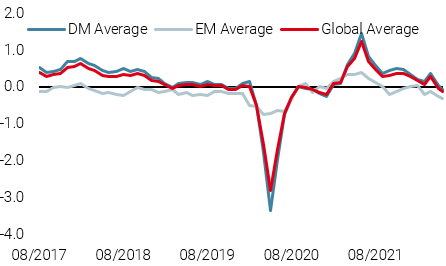
Unigestion Nowcasting
World Growth Nowcaster
World Inflation Nowcaster
Market Stress Nowcaster
Weekly Change
- Last week, our World Growth Nowcaster ticked further below potential, as the Japanese housing market slowed and UK and Canadian consumption data receded.
- Our World Inflation Nowcaster moved down slightly with some easing in inflationary pressures in China.
- Our Market Stress Nowcaster moved higher last week, as volatilities rose and spreads widened.
Sources: Unigestion, Bloomberg, as of 20 June 2022.
Important Information
This document is provided to you on a confidential basis and must not be distributed, published, reproduced or disclosed, in whole or part, to any other person.
The information and data presented in this document may discuss general market activity or industry trends but is not intended to be relied upon as a forecast, research or investment advice. It is not a financial promotion and represents no offer, solicitation or recommendation of any kind, to invest in the strategies or in the investment vehicles it refers to. Some of the investment strategies described or alluded to herein may be construed as high risk and not readily realisable investments, which may experience substantial and sudden losses including total loss of investment.
The investment views, economic and market opinions or analysis expressed in this document present Unigestion’s judgement as at the date of publication without regard to the date on which you may access the information. There is no guarantee that these views and opinions expressed will be correct nor do they purport to be a complete description of the securities, markets and developments referred to in it. All information provided here is subject to change without notice. To the extent that this report contains statements about the future, such statements are forward-looking and subject to a number of risks and uncertainties, including, but not limited to, the impact of competitive products, market acceptance risks and other risks.
Data and graphical information herein are for information only and may have been derived from third party sources. Although we believe that the information obtained from public and third party sources to be reliable, we have not independently verified it and we therefore cannot guarantee its accuracy or completeness. As a result, no representation or warranty, expressed or implied, is or will be made by Unigestion in this respect and no responsibility or liability is or will be accepted. Unless otherwise stated, source is Unigestion. Past performance is not a guide to future performance. All investments contain risks, including total loss for the investor.
Unigestion SA is authorised and regulated by the Swiss Financial Market Supervisory Authority (FINMA). Unigestion (UK) Ltd. is authorised and regulated by the UK Financial Conduct Authority (FCA) and is registered with the Securities and Exchange Commission (SEC). Unigestion Asset Management (France) S.A. is authorised and regulated by the French “Autorité des Marchés Financiers” (AMF). Unigestion Asset Management (Canada) Inc., with offices in Toronto and Montreal, is registered as a portfolio manager and/or exempt market dealer in nine provinces across Canada and also as an investment fund manager in Ontario and Quebec. Its principal regulator is the Ontario Securities Commission (OSC). Unigestion Asset Management (Copenhagen) is co-regulated by the “Autorité des Marchés Financiers” (AMF) and the “Danish Financial Supervisory Authority” (DFSA). Unigestion Asset Management (Düsseldorf) SA is co-regulated by the “Autorité des Marchés Financiers” (AMF) and the “Bundesanstalt für Finanzdienstleistungsaufsicht” (BAFIN).