Markets have recently shown signs of discontent, with the ups-and-downs of the not-so-transparent negotiations between the US and China frustrating investors and harming sentiment. The recent renminbi devaluation, though small in scale, is still a sign that China is far from being knocked out, while the US president is never short of a vindicating tweet. In the meantime, macro data is not bad, but not good either and we see pockets of heightened risk. Finally, inflation is nowhere to be found and this situation is in itself a puzzle for central bankers. These headwinds lead us to wonder what could cause markets to rally from here, moving from an uprising to rising up: looking beyond today’s volatility, here is our “what if” analysis. In our opinion, the current macro picture gives cause for concern: the German IFO indicator reached 95.7 – a level last reached in 2012; 70% of the European Commission survey data is declining; the US ISM moved from 60.8 in 2018 to 51.2 in August – nearing the psychological 50 threshold; and in China, the growth rate of imports, probably one of the best proxies for the evolution of China’s consumption, plunged from 27% in 2018 to 0% today. Where can we see potential improvements to this overall negative macro picture?“Uprising” – Muse, 2009
What’s Next?
The macro picture could improve
First of all, even if these numbers have proven to be reliable gauges of the economic health of these economies, there are other figures showing a different picture. In the case of the US, the CFNAI indicator is still hovering around its expansion period average, the Atlanta Fed GDPNow sees Q3 GDP in the US at around 2% while the NY Fed one sees it slightly below this mark. Our own Growth Nowcaster agrees with US growth settling around this 2% level in Q3, lifted by solid job and housing markets.
More importantly, as the Fed will continue to loosen its monetary policy, the more interest rate-driven parts of the economy (durable goods consumption, housing and investment) will be even more stimulated than they are today. For example, car sales have been muted so far, but with short-term rates heading lower, households could make the decision to change their cars. It should also be noted that personal income growth in the US is more than 3% higher than short-term rates, which is a reasonable incentive for households to increase their short-term debt.
In the case of China, the government and central banks have some leeway to stimulate the economy and have shown over the past 15 years their ability to be wise pilots. The situation that worries us the most is Europe and, more importantly, Germany. However, even here, there are reasons to be hopeful. First, Chinese imports have stabilised over the past couple of months and are no longer collapsing (Europe is China-dependent). Second, the ECB is giving clear signs of being on the dovish side and sustaining credit conditions. If the US growth cycle starts improving, this outside stimulation could feed off these good credit conditions, finally leading European consumers to find the confidence they lack to engage in longer-term commitments. The picture is in no way rosy, but things could turn more positive in a matter of months, mainly because credit could finally deliver on its promises.
The trade war could stabilise, lifting sentiment
A trade war stabilisation would be a second potential trigger to higher markets by year-end. There are reasons to be optimistic beyond the events of the past few days. Firstly, China is now showing muscle and it has done so twice already. Between July 2018 and April 2019, China imported only a third of the oil it had imported from the US in 2017. In addition, the limited currency devaluation is another sign of resistance to the US government’s push. Going forward, two elements are likely to become important and put a halt to this lose-lose situation. Firstly, there is a limit to the devaluations that China can action without it seeing massive outflows in its foreign direct investments – something that the country’s future still depends on. Secondly, the US elections are nearing and Donald Trump cannot afford to end his mandate on a recession (even if his recent attitude is inconsistent with this fact). The year-to-date collapse in global trade is already a threat to his re-election and he has already acknowledged that certain tariffs will hurt the US consumer.
Simultaneously, world trade indices over the past couple months have either recovered or stabilised. The CPB World Trade volume index is currently at its November 2017 level and only 2% lower than its maximum in November 2018. The Baltic Dry Index staged a superb 200% recovery between mid-June and mid-August this year, though it went largely unnoticed. Chinese freight indices also embarked on a similar, though less pronounced, evolution. In short, world trade today is far better off than it was in April and any additional improvement on this front would be a further positive factor, pushing sentiment in the right direction.

Finally, the best ally to markets recently have been central banks. Inflation risk is low as most of the drivers of inflation are currently heading south. Core inflation in the US is at 2.2%, while headline inflation is at 1.8%, reflecting today’s very poor commodity cycle. In the Eurozone, core inflation has had a stable evolution to around 1%. The striking pattern across developed market economies is that this low inflation situation looks like it is structural: wage growth and capacity utilisation rates remain solid but, with slower growth and commodity cycles, inflation remains low. This is a preoccupying situation and the basic mission of most central banks is to align inflation to their long-term targets of around 2%. This is good news globally, with bond and equity investors able to enjoy the comforting support of central banks piloting the credit cycle and helping inflation back toward its long-term target without too much risk of an overheating. The Fed and the ECB have been intensively playing this card this year and in spite of the decelerating macro momentum, equities and bonds rallied. We do not expect a change in their stance: the Fed should keep on cutting rates in the coming quarters and the ECB will do what it can to buy enough time for European governments to decide on spending more. With the recent market correction, valuations look even more attractive when placing them in the context of this supportive monetary policy environment. Aligning these three factors (macro, sentiment and valuation) could lead to a positive Q4 in terms of growth asset performance. This, for the moment, remains an extremely rosy scenario and almost too good to be true. It also relies on an absence of unpredictable tweets. Seasonality is usually not great from mid-August to mid-September, but recent positioning in equities decreased as spreads widened, offering a better risk-reward balance for credit bonds holders. For now, this is more of a “what if” analysis than anything else. But we will remain attentive to these three sign-posts in order to avoid missing the transition from markets uprising to markets rising up.Accommodative monetary policy makes valuations attractive

Uprising

Our medium-term view is currently more constructive, as we are pairing an overweight in growth assets with an overweight in government bonds and an underweight in industrial metals. We are also complementing our exposures with options to protect the portfolio in the case of equity drawdowns. Over the month of August thus far, the Multi Asset Risk Targeted Strategy is down 0.77% versus a 4.31% fall for the MSCI AC World Index, while the Barclays Global Aggregate (USD hedged) is up 1.86%. Year-to-date, the Multi Asset Risk Targeted Strategy has returned 7.59% versus 11.55% for the MSCI AC World index and 8.83% for the Barclays Global Aggregate (USD hedged) index. * The Multi Asset Risk Targeted Strategy performance is shown in USD net of fees for the representative account of the Multi Asset Risk Targeted (Medium) USD Composite and reflects the deduction of advisory fees and brokerage commission and the reinvestment of all dividends and earnings. Past performance is not indicative of future performance. This information is presented as supplemental information only and complements the GIPS compliant presentation provided on the following page.Strategy Behaviour
Performance Review
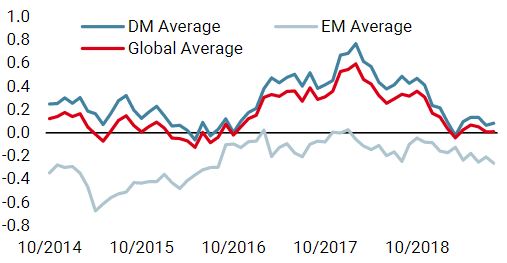
Unigestion Nowcasting
World Growth Nowcaster
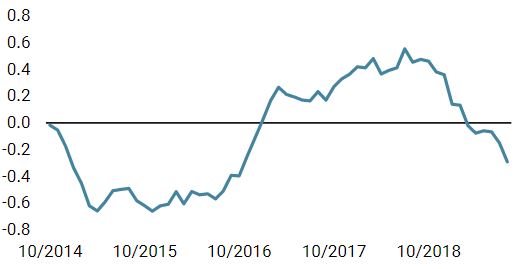
World Inflation Nowcaster
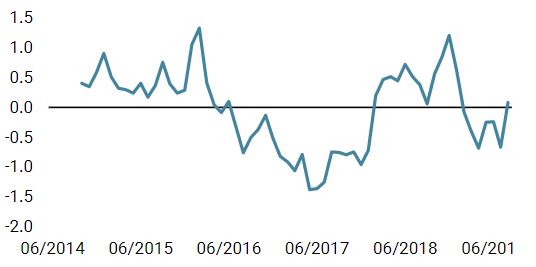
Market Stress Nowcaster
Weekly Change
- Our world Growth Nowcaster dropped marginally last week, driven by lower growth conditions in the developed world.
- Our world Inflation Nowcaster remains low, but stopped decreasing last week, more because of a lack of data rather than because of a stronger signal.
- Market stress decreased last week, as volatility and credit spreads decreased.
Sources: Unigestion. Bloomberg, as of 26 August 2019.
Important Information
Past performance is no guide to the future, the value of investments can fall as well as rise, there is no guarantee that your initial investment will be returned. This document has been prepared for your information only and must not be distributed, published, reproduced or disclosed by recipients to any other person. This is a promotional statement of our investment philosophy and services only in relation to the subject matter of this presentation. It constitutes neither investment advice nor recommendation. This document represents no offer, solicitation or suggestion of suitability to subscribe in the investment vehicles it refers to. Please contact your professional adviser/consultant before making an investment decision. Where possible we aim to disclose the material risks pertinent to this document, and as such these should be noted on the individual document pages. Please contact Unigestion for a complete list of all the applicable risks. Some of the investment strategies described or alluded to herein may be construed as high risk and not readily realisable investments, which may experience substantial and sudden losses including total loss of investment. These are not suitable for all types of investors. To the extent that this report contains statements about the future, such statements are forward-looking and subject to a number of risks and uncertainties, including, but not limited to, the impact of competitive products, market acceptance risks and other risks. As such, forward looking statements should not be relied upon for future returns. Data and graphical information herein are for information only and may have been derived from third party sources. Unigestion takes reasonable steps to verify, but does not guarantee, the accuracy and completeness of this information. As a result, no representation or warranty, expressed or implied, is or will be made by Unigestion in this respect and no responsibility or liability is or will be accepted. All information provided here is subject to change without notice. It should only be considered current as of the date of publication without regard to the date on which you may access the information. Rates of exchange may cause the value of investments to go up or down. An investment with Unigestion, like all investments, contains risks, including total loss for the investor.
This information is issued by Unigestion (UK) Ltd (“Unigestion”), which is authorised and regulated by the UK Financial Conduct Authority (“FCA”). Unigestion is also registered as an investment adviser with the U.S. Securities and Exchange Commission (“SEC”). This information is intended only for professional clients, institutional clients and eligible counterparties, as defined by the FCA, and qualified purchasers as defined by the SEC and has therefore not been adapted to retail clients.
Unigestion Multi Asset Risk-Targeted (USD): 31 December 2014 to 30 June 2019
| Year | Composite Return Gross of Fees |
Composite Net Return | Benchmark Return | Number of Accounts | Internal Dispersion | Composite 3-Yr Std Dev | Benchmark 3-Yr Std Dev | Composite AUM (M) | Firm AUM (M) |
| 2015 | -1.61% | -2.80% | – | 1 | – | – | – | 127.24 | 15,550.31 |
| 2016 | 5.05% | 3.79% | – | 1 | – | – | – | 129.66 | 18,144.46 |
| 2017 | 11.16% | 9.82% | – | 1 | – | – | – | 169.51 | 22,340.80 |
| 2018 | -2.91% | -4.08% | – | 1 | – | – | – | 286.93 | 21,403.49 |
| 20191 | 7.45% | 6.80% | – | 1 | – | – | – | 364.46 | 21,692.55 |
1: This year is incomplete, it stops in June.
Special Disclosure: For presentations prior to 31.03.2018 the strategy was measured against the LIBOR 3M USD + 4%. Beginning April 2018 the firm determined that the benchmark did not accurately reflect the strategy mandate and the benchmark was removed. Definition of the Firm: For the purposes of applying the GIPS Standards, the firm is defined as Unigestion. Unigestion is responsible for managing assets on the behalf of institutional investors. Unigestion invests in several strategies for institutional clients: Equities, Hedge Funds, Private Assets and the solutions designed for the clients of our Cross Asset Solution department. The GIPS firm definition excludes the Fixed Income Strategy Funds, which started in January 2001 and closed in April 2008, and the accounts managed for private clients. Unigestion defines the private clients as High Net Worth Families and Individual investors. Policies: Unigestion policies for valuing portfolios, calculating performance, and preparing compliant presentations are available upon request. Composite Description: The Multi Risk Targeted (Medium) composite was defined on 15 December 2014. It consists of accounts which aim to deliver consistent smooth returns of cash + 5% gross of fees across all market conditions over a 3-year rolling period. It seeks to achieve this by capturing the upside during bull markets while protecting capital during market downturns. Benchmark: Because the composites strategy is absolute return and investments are permitted in all asset classes, no benchmark can reflect this strategy accurately. Fees: Returns are presented gross of management fees, administrative fees but net of all trading costs and withholding taxes. The maximum management fee schedule is 1.2% per annum. Net returns are net of model fees and are derived by deducting the highest applicable fee rate in effect for the respective time period from the gross returns each month. List of Composites: A list of all composite descriptions is available upon request. Minimum Account Size: The minimum account size for this composite is 5’000’000.- USD. Valuation: Valuations are computed in US dollars (USD). Performance results are reported in US dollars (USD). Internal Dispersion & 3YR Standard Deviation: The annual composite dispersion presented is an asset-weighted standard deviation calculated for the accounts in the composite the entire year. When internal dispersion is not presented it is as a result of an insufficient number of portfolios in the composite for the entire year. When the 3 Year Standard Deviation is not presented it is as a result of an insufficient period of time. Compliance Statement Unigestion claims compliance with the Global Investment Performance Standards(GIPS®) and has prepared and presented this report in compliance with the GIPS standards. Unigestion has been independently verified for the periods 1 January 2003 to 31 December 2016. The verification report(s) is/are available upon request. Verification assesses whether (1) the firm has complied with all the composite construction requirements of the GIPS standards on a firm-wide basis and(2) the firms policies and procedures are designed to calculate and present performance in compliance with the GIPS standards. Verification does not ensure the accuracy of any specific composite presentation.