A little over a year ago, we communicated that the possibility of a trade war was the greatest source of uncertainty for the second half of 2018. Today is not very much different. After a sense of optimism during the first quarter of this year, investors have started to face the reality that a US-China trade deal is not as close as some tweets would have them believe. Interestingly, the impact of the previous round of tariffs can now be measured, giving us a better sense of what to expect with this latest round. Moreover, Washington has signalled what the next front on this war could be, with specific technology firms and their products brought into the fray. Yet when we look at market pricing, it seems to us that investors continue to expect a resolution, though perhaps not such a positive one as before. This discounting of the downside scenarios has us feeling like we’re spinning “right round, right round like a record, right round round round.” Over the last few weeks, concerns about global trade have resurfaced, driven by the White House following through on its threat to raise tariffs from 10% to 25% on USD 200bn of Chinese imports. Investors had been lulled into complacency by talk and tweets about progress in US-China trade meetings during the first quarter of this year and got a rude awakening when talks fell apart and the tone shifted toward escalation. It seems to us that the direct negative impact to global growth of the implemented tariffs is somewhat limited, roughly in the range of 0.15-0.20% over the next three years. Importantly, this contraction could be offset by fiscal spending in the US or China. While global inflation is unlikely to move much, the US is particularly exposed. A recent study by the National Bureau of Economic Research (NBER) demonstrated that the 2018 tariffs on US imports were completely passed through to end consumers as higher prices. Another study by a team of economists from Harvard, Chicago, the IMF, and the Federal Reserve, using price data from the Bureau of Labor and statistics on imports from China, demonstrated a sharp, nearly one-to-one rise in prices for goods hit by the 10% or 25% tariff, whereas the border price (ex-tariff) was largely unchanged. Thus, US importers (households or businesses) have almost entirely borne the brunt of higher tariffs, with Chinese exporters not yet engaging in price cuts. The new rounds of tariffs will essentially go into effect on June 1, and we would expect a similar dynamic to hold, with the tariff in effect acting as a tax on US importers. Some of these higher import prices will pass to US consumers as higher end-product prices, while others will be absorbed by importing firms via lower profit margins. Fiscal spending could help to offset the likely demand contraction (e.g., via industry subsidies or another round of tax cuts funded by the tariff revenue), but it is important to keep in mind deadweight losses, in this case caused by tariff-driven shifts in supply chains from a Chinese producer to a less efficient producer. These deadweight losses are not recovered by the government and hence cannot be used to fund fiscal spending. The NBER study determined that the 2018 tariffs cost US households on average USD 414 annually, USD 132 of which is deadweight loss. Building on this work, the IMF determined that the additional 15% on the USD 200bn of imports will cost US households USD 831 annually, USD 620 of which will be a deadweight loss. To put these figures in context, this would mean that about 75% of the lost income households will face from this round of tariffs will not be going to government coffers but is rather welfare destruction due to inefficiencies. Keep in mind that the total tariff bill per household in the US would move up to USD 1,245, above the average tax cut of USD 1,090 that the middle quintile of income earners received from the 2017 tax reform according to the non-partisan Tax Policy Center.“YOU SPIN ME ROUND (LIKE A RECORD)” – DEAD OR ALIVE, 1984
What’s Next?
Reassessing the impact of the US-China trade war
The US is exposed via more channels than just inflation

Our discussion thus far has been about what has currently been implemented, but looking ahead, further escalation looks quite worrying. In the near term, the comment period for the next wave of tariffs – 25% tariffs on nearly all remaining Chinese imports, totalling about USD 300bn – ends on 24 June, shortly before the G20 meeting set for June 28-29. Though this round may be delayed, we see a significant chance of these tariffs being implemented. The White House has also made clear that the trade war will not be just about tariffs. It has now expanded its actions to include: curtailing US exports of sensitive technology to key Chinese firms like Huawei, limiting Chinese input to critical telecommunications systems and scrutinising Chinese investments in US firms. At the same time, Chinese policymakers could limit exports of key input materials needed by US firms, leading to yet another spiral of escalations. Of course, it is very difficult to say where this could end or what the costs could be, but it seems to us that tariffs are unlikely to be the final battle of this war. Last year, we estimated that a significant escalation of the trade war would trim about 9% from global equities, mostly due to an expansion in risk premia. We think that number is still in the right ballpark from where we stand today. Yet the MSCI All Country World Index is down just a little over 4% since its recent peak in early May, suggesting the market still sees a significant chance of a trade deal happening and discounting the likelihood of the final round of tariffs or the battlefront shifting beyond tariffs. We are not so starry-eyed and continue to protect against an equity sell-off via options.But this is the status-quo scenario, not the downside scenario
And yet investors continue to look on the bright side

You Spin Me Round (Like A Record)

Our medium-term view remains cautious, and we are pairing a small overweight in government bonds with an underweight in emerging assets. We are also complementing our equity exposure with options to protect the portfolio in the case of equity drawdowns. Over the month so far, the Multi Asset Risk Targeted Strategy is down 1% versus -4.1% for the MSCI AC World Index, while the Barclays Global Aggregate (USD hedged) is up 0.8%. Year-to-date, the Multi Asset Risk Targeted Strategy has returned 4.3% versus 11.2% for the MSCI AC World index and 3.9% for the Barclays Global Aggregate (USD hedged). * The Multi Asset Risk Targeted Strategy performance is shown in USD net of fees for the representative account of the Multi Asset Risk Targeted (Medium) USD Composite and reflects the deduction of advisory fees and brokerage commission and the reinvestment of all dividends and earnings. Past performance is not indicative of future performance. This information is presented as supplemental information only and complements the GIPS compliant presentation provided on the following page.Strategy Behaviour
Performance Review
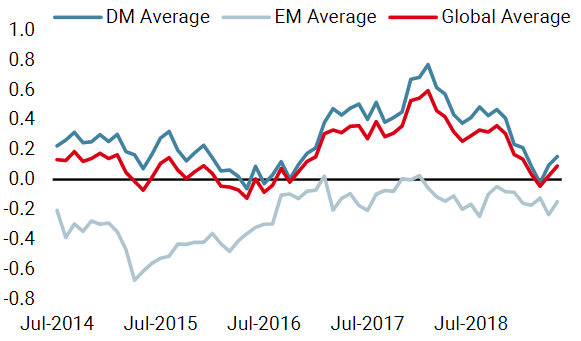
Unigestion Nowcasting
World Growth Nowcaster
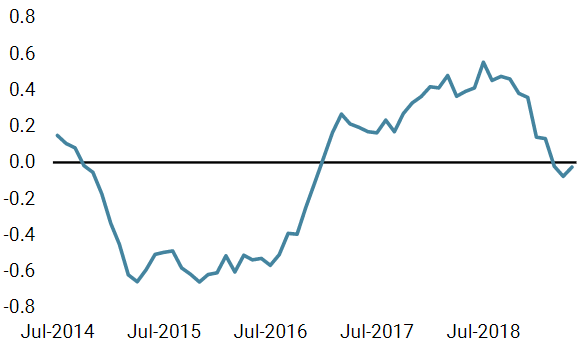
World Inflation Nowcaster
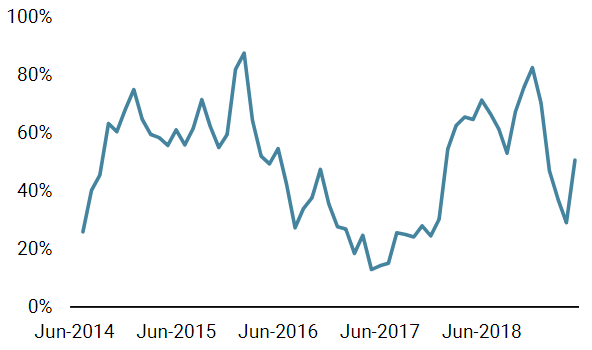
Market Stress Nowcaster
Weekly Change
- Our world Growth Nowcaster increased last week, on the back of stronger macro data in the US, China and South Africa.
- Our world Inflation Nowcaster increased again this week, largely driven by stronger US inflation data.
- Market stress increased over the past week, with credit spreads getting wider and liquidity conditions deteriorating.
Sources: Unigestion, Bloomberg, as of 27 May 2019.
Important Information Past performance is no guide to the future, the value of investments can fall as well as rise, there is no guarantee that your initial investment will be returned. This document has been prepared for your information only and must not be distributed, published, reproduced or disclosed by recipients to any other person. This is a promotional statement of our investment philosophy and services only in relation to the subject matter of this presentation. It constitutes neither investment advice nor recommendation. This document represents no offer, solicitation or suggestion of suitability to subscribe in the investment vehicles it refers to. Please contact your professional adviser/consultant before making an investment decision. Where possible we aim to disclose the material risks pertinent to this document, and as such these should be noted on the individual document pages. Please contact Unigestion for a complete list of all the applicable risks. Some of the investment strategies described or alluded to herein may be construed as high risk and not readily realisable investments, which may experience substantial and sudden losses including total loss of investment. These are not suitable for all types of investors. To the extent that this report contains statements about the future, such statements are forward-looking and subject to a number of risks and uncertainties, including, but not limited to, the impact of competitive products, market acceptance risks and other risks. As such, forward looking statements should not be relied upon for future returns. Data and graphical information herein are for information only and may have been derived from third party sources. Unigestion takes reasonable steps to verify, but does not guarantee, the accuracy and completeness of this information. As a result, no representation or warranty, expressed or implied, is or will be made by Unigestion in this respect and no responsibility or liability is or will be accepted. All information provided here is subject to change without notice. It should only be considered current as of the date of publication without regard to the date on which you may access the information. Rates of exchange may cause the value of investments to go up or down. An investment with Unigestion, like all investments, contains risks, including total loss for the investor. This information is issued by Unigestion (UK) Ltd (“Unigestion”), which is authorised and regulated by the UK Financial Conduct Authority (“FCA”). Unigestion is also registered as an investment adviser with the U.S. Securities and Exchange Commission (“SEC”). This information is intended only for professional clients, institutional clients and eligible counterparties, as defined by the FCA, and qualified purchasers as defined by the SEC and has therefore not been adapted to retail clients. Unigestion Multi Asset Risk-Targeted (USD): 31 December 2014 to 31 December 2018 1: This year is incomplete. Special Disclosure: For presentations prior to 31.03.2018 the strategy was measured against the LIBOR 3M USD + 4%. Beginning April 2018 the firm determined that the benchmark did not accurately reflect the strategy mandate and the benchmark was removed. Definition of the Firm: For the purposes of applying the GIPS Standards, the firm is defined as Unigestion. Unigestion is responsible for managing assets on the behalf of institutional investors. Unigestion invests in several strategies for institutional clients: Equities, Hedge Funds, Private Assets and the solutions designed for the clients of our Cross Asset Solution department. The GIPS firm definition excludes the Fixed Income Strategy Funds, which started in January 2001 and closed in April 2008, and the accounts managed for private clients. Unigestion defines the private clients as High Net Worth Families and Individual investors. Policies: Unigestion policies for valuing portfolios, calculating performance, and preparing compliant presentations are available upon request. Composite Description: The Multi Risk Targeted (Medium) composite was defined on 15 December 2014. It consists of accounts which aim to deliver consistent smooth returns of cash + 5% gross of fees across all market conditions over a 3-year rolling period. It seeks to achieve this by capturing the upside during bull markets while protecting capital during market downturns. Benchmark: Because the composites strategy is absolute return and investments are permitted in all asset classes, no benchmark can reflect this strategy accurately. Fees: Returns are presented gross of management fees, administrative fees but net of all trading costs and withholding taxes. The maximum management fee schedule is 1.2% per annum. Net returns are net of model fees and are derived by deducting the highest applicable fee rate in effect for the respective time period from the gross returns each month. List of Composites: A list of all composite descriptions is available upon request. Minimum Account Size: The minimum account size for this composite is 5’000’000.- USD. Valuation: Valuations are computed in US dollars (USD). Performance results are reported in US dollars (USD). Internal Dispersion & 3YR Standard Deviation: The annual composite dispersion presented is an asset-weighted standard deviation calculated for the accounts in the composite the entire year. When internal dispersion is not presented it is as a result of an insufficient number of portfolios in the composite for the entire year. When the 3 Year Standard Deviation is not presented it is as a result of an insufficient period of time. Compliance Statement Unigestion claims compliance with the Global Investment Performance Standards(GIPS®) and has prepared and presented this report in compliance with the GIPS standards. Unigestion has been independently verified for the periods 1 January 2003 to 31 December 2016. The verification report(s) is/are available upon request. Verification assesses whether (1) the firm has complied with all the composite construction requirements of the GIPS standards on a firm-wide basis and(2) the firms policies and procedures are designed to calculate and present performance in compliance with the GIPS standards. Verification does not ensure the accuracy of any specific composite presentation.
Year
Composite
Return Gross
of FeesComposite Net Return
Benchmark Return
Number of Accounts
Internal Dispersion
Composite 3-Yr Std Dev
Benchmark 3-Yr Std Dev
Composite AUM (M)
Firm
AUM (M)
2015
-1.61%
-2.80%
–
1
–
–
–
127.24
15,550.31
2016
5.05%
3.79%
–
1
–
–
–
129.66
18,144.46
2017
11.16%
9.82%
–
1
–
–
–
169.51
22,340.80
2018
-2.91%
-4.08%
–
1
–
–
–
286.93
21,403.49
20191
5.06%
4.74%
–
1
–
–
–
278.23
23,204.71