As a result of the significant global rise in bonds yields, the Barclays Global Aggregate index delivered a negative performance in February (-1.6%), putting most balanced bond/equity allocations into negative territory for 2021. Does this unusual situation signal a change of tune for the financial markets’ “dancefloor”? We believe that investors underestimate the risk of inflation surprises, both in terms of amplitude and longevity. Given the greater sensitivity of the economy and financial assets to duration risk, a further rise in interest rates would imply a significant rotation between assets and across sectors and factors. While the market is still singing “Let’s Dance”, we prefer to dynamically adjust our rhythm in time to “Thanks for the Dance”.

Thanks for the Dance

What’s Next?
Higher real rates: “Catch Me If You Can”
US rates rose by 34 basis points (bps) in February after a 7 bps increase in December and a 15 bps increase in January. Since their low in July 2020, 10-year rates have risen from 0.53% to 1.41%, an increase of almost 90 bps over the period. This increase was global and affected all bond curves. It even pushed central banks to intervene: either verbally, like the ECB, or by buying bonds, like the RBA.
This rise in rates can be broken down into two stages via an “inflation premium” and “growth premium” analysis. The first phase took place between July and December 2020, and corresponds to a normalisation of inflation expectations following the reduction of the “double dip” tail risk scenario. As such, only the inflation premium increased while the growth premium, represented by the real 10-year rate, remained stable and in negative territory.
The second phase began in January 2021, following the combination of the “fiscal boost” from the new US fiscal plan and the global rise in raw materials prices. In this second phase, the inflation premium remained moderate while the growth premium adjusted significantly. Thus, in February, the inflation breakeven in 10-year US inflation-linked assets stayed relatively stable from 2.11% to 2.15% while the real 10-year rate increased by 34 bps, from -1.04% to -0.7%. This trend continued last week. While this jump in real rates should be seen as a positive sign, reflecting a return to normality for the US and global economy, it poses a risk to the stability of financial markets in the short term if its path is too rapid and disorderly.
How does this increase in US 10-year interest rates compare historically? Looking at the performance of the Barclays US Treasuries index, which is most representative of the bond exposures in US pension funds, since 1973, the rise in rates observed in February on the long side of the curve represents a negative monthly performance of -1.8%, greater than 1 sigma. Such a performance represents less than 6% of monthly returns since 1973. Cumulated over three months, the fall in the index reached -3%, which is comparable to the sharp decline observed in Q4 2016 (-3.8%), the “Taper Tantrum” of 2013 (-2.9%) or the violent adjustment in Q2 2009 (-3%). Thus, it is a rare event that should be taken into consideration when assessing its sustainability and potential impact.
What is the market singing? “Keep on Dancing”
The adjustment in the growth premium embedded in bond yields has had a moderate effect on financial assets overall, at least on the surface. Most equity indices delivered a positive performance in February and have been rising significantly since July despite the rise in bond yields. The main reason for the absence of a lasting correlation shock is that the rise in inflation is perceived as temporary by markets. Thus, the curve of the US inflation breakeven has inverted, reflecting the fact that the rise in raw material prices, as well as the increased activity linked to the reopening of economies in the coming months, will only have an impact over a few months, not years. The two-year inflation breakeven is thus 2.6%, while the famous five-year, five-year forward inflation breakeven rate is at 2.3%. This perception of a shock limited in time is also visible on the forward curve of oil contracts, which is in backwardation. Moreover, contrary to the rate increases observed during the periods mentioned above, the implied volatility of US rates has remained moderate. The MOVE index remains well below the levels seen in 2009/2013 and 2016 (75 vs. 110).
What is the Fed communicating? “Relax”
The lack of market concern about upward bond yield adjustment is supported by strong confidence in the ability of central banks to contain excessive rate hikes. The example of Japan, which has a long history of yield curve control, is often used to project a rosy scenario of controlled and gradual long-term rate hikes. The tools at the Fed’s disposal such as 1) forward guidance on future rate hikes and 2) the implementation of “inflation targeting”, which allows the Fed to tolerate a temporary inflation overshoot, also constitute a stabilising element for market participants. Finally, recent comments by the Fed President (May 2020) on this subject are reassuring: “The sense of it is, that if rates were to move up a lot, for whatever reason, and we wanted to keep monetary policy accommodative we might think about using it. Not on the whole curve, but on some part of the curve. And it’s not a decision that we’ve made, it’s sort of an early stage thing we’re evaluating“. This suggests that the risk of uncontrolled inflation and a potential change in the Fed’s stance remains limited. Thus, the probability of a Fed rate hike in 2022 is almost nil as reflected by the forward rate OIS one-year, one-year at 0.15%. However, history shows that the Fed can quickly reverse the bias of its monetary policy in spite of guidelines and “dots”, as was the case in 2018 (from hawk to dove) or further back in 1994 and 2004.
What are our beliefs? “Can’t Stop”
An historical analysis of the growth and inflation premia contained in the interest rate underlines the extent to which the persistence of negative real rates is an historical anomaly. Since 1998, the date of the first US inflation swaps, the US 10-year real rate has averaged 1.4% and has been persistently negative on only two occasions: between 2012 and 2013, and since March 2020 (i.e. 10% of observations). Since 2010 and the generalisation of QE, the average real rate has been lower but still positive at 0.28%, and its historical frequency higher but still reliable at 25%. Despite the recent increase, the real 10-year US rate is now at -0.75%.
Another element leads us to expect an upward adjustment of growth and inflation premia: the global recovery. The Atlanta Fed’s GDP Nowcast predicts a 10% increase in US GDP in Q1 2021, while the NY Fed’s GDP Nowcast expects growth of 8.2% for the period. The most advanced components of our US Nowcaster confirm this upcoming jump in US growth. Such an economic context does not sit well with negative real rates in the US. Finally, how will the market react when US inflation rises above 3% in Q3, as anticipated by our models based on our Nowcasters’ inflation and historical monthly variations in inflationary components? This risk of sustained high inflation is confirmed by the “price paid” component of the ISM indices, the evolution of the US household savings rate and the evolution of production prices.
Unlike the case of Japan and the BoJ, which have never faced a real growth shock, US real growth will reach record levels in the coming quarters. We therefore think it is possible to see US nominal rates at 2% by June. The relationship between nominal rates and real growth is indeed historically very strong. Since 1963, US real growth has been 10% and nominal rates have averaged 6.3%. These elements fall to 5.9% for activity and 3.2% for rates over the period 2000-2020. What about the future? For the period 2021-2023, the consensus forecast expects US growth of 3.5% on average and inflation of 2.1%, i.e. a real growth of 5.6% with a peak of 7.1% in 2021. In this context, is it reasonable to think that nominal rates will remain below 2% as the forward price curve currently stands? Will the Fed keep its credibility intact if it has to double its balance sheet yet again to implement target yield control and keep long rates low to fight bond vigilance and a “behind the curve” stance?
Allocation implications: “Wake Me Up Before You Go-go”
Since QE, the sensitivity of financial markets to the economy has reached record levels. Never before has government debt been so high. The duration of bond indices has risen from 5.5 to 8.1 since 2000, deteriorating sharply the risk/reward of government bonds. Our calculations thus show that for a sovereign bond index, an increase in rates of around 25 bps would completely cancel out the carry for one year. This “cushion” was 118 bps in 2000.
Equities are also affected by this phenomenon. The rise in equity indices observed over the last 10 years, particularly in the US, has been concentrated on a few sectors with an implicit duration higher than the average due to their growth profile and the implications of a dividend discount factor model. The latest BIS report confirms this point, showing that equity indices are more sensitive to monetary news, particularly during periods of low interest rates. This greater sensitivity to asset duration makes balanced allocations more risky than expected for coming quarters.
As a result, any upward movement in nominal long-term interest rates will have a greater impact than before. We see this increase as a key determinant of a sustainable rotation across assets, factors and sectors. We believe that the faster the rise, the more disordered and stressful this rotation will be. In terms of asset allocation, our “Macro, Market Sentiment, Valuation” framework sees supportive elements for cyclically-driven assets such as industrial and energy-related commodities and developed equities at the expense of income assets such as bonds or defensive assets. Above all, we believe that a rise in interest rates will reduce beta party profits in favour of alpha and relative value. In this context, certain FX should be favoured, such as long NOKSEK or long CADCHF pairs as well as a preference for cyclical equity indices such as Topix or Russell 2000 indices versus secular growth ones represented by the Nasdaq or Hang Seng.
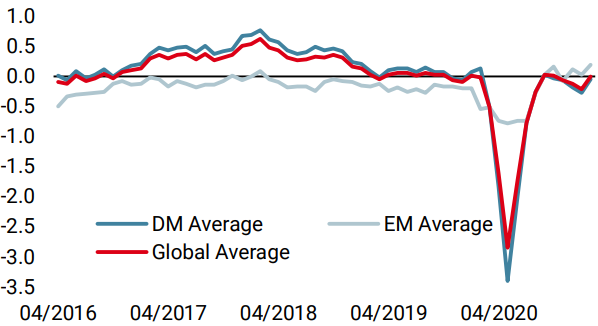
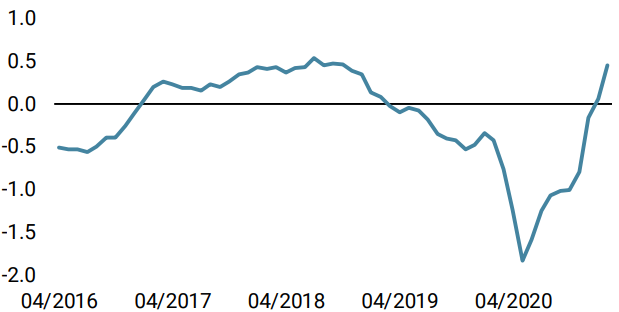
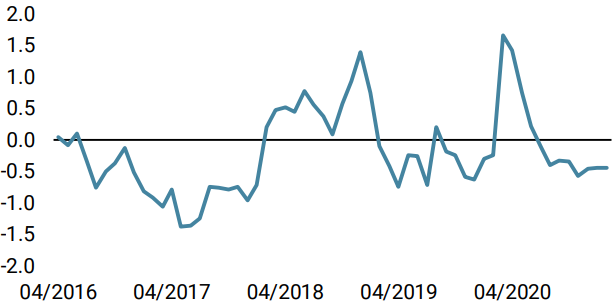
Unigestion Nowcasting
World Growth Nowcaster
World Inflation Nowcaster
Market Stress Nowcaster
Weekly Change
- Last week, our World Growth Nowcaster increased as US data improved significantly. Recession risk is low.
- Our World Inflation Nowcaster increased again, especially on the US front. Inflation risk is very high.
- Our Market Stress Nowcaster increased slightly as its volatility component increased a bit.
Sources: Unigestion. Bloomberg, as of 5 March 2021.
Important Information
This document is provided to you on a confidential basis and must not be distributed, published, reproduced or disclosed, in whole or part, to any other person.
The information and data presented in this document may discuss general market activity or industry trends but is not intended to be relied upon as a forecast, research or investment advice. It is not a financial promotion and represents no offer, solicitation or recommendation of any kind, to invest in the strategies or in the investment vehicles it refers to. Some of the investment strategies described or alluded to herein may be construed as high risk and not readily realisable investments, which may experience substantial and sudden losses including total loss of investment.
The investment views, economic and market opinions or analysis expressed in this document present Unigestion’s judgement as at the date of publication without regard to the date on which you may access the information. There is no guarantee that these views and opinions expressed will be correct nor do they purport to be a complete description of the securities, markets and developments referred to in it. All information provided here is subject to change without notice. To the extent that this report contains statements about the future, such statements are forward-looking and subject to a number of risks and uncertainties, including, but not limited to, the impact of competitive products, market acceptance risks and other risks.
Data and graphical information herein are for information only and may have been derived from third party sources. Although we believe that the information obtained from public and third party sources to be reliable, we have not independently verified it and we therefore cannot guarantee its accuracy or completeness. As a result, no representation or warranty, expressed or implied, is or will be made by Unigestion in this respect and no responsibility or liability is or will be accepted. Unless otherwise stated, source is Unigestion. Past performance is not a guide to future performance. All investments contain risks, including total loss for the investor.
Unigestion SA is authorised and regulated by the Swiss Financial Market Supervisory Authority (FINMA). Unigestion (UK) Ltd. is authorised and regulated by the UK Financial Conduct Authority (FCA) and is registered with the Securities and Exchange Commission (SEC). Unigestion Asset Management (France) S.A. is authorised and regulated by the French “Autorité des Marchés Financiers” (AMF). Unigestion Asset Management (Canada) Inc., with offices in Toronto and Montreal, is registered as a portfolio manager and/or exempt market dealer in nine provinces across Canada and also as an investment fund manager in Ontario and Quebec. Its principal regulator is the Ontario Securities Commission (OSC). Unigestion Asset Management (Copenhagen) is co-regulated by the “Autorité des Marchés Financiers” (AMF) and the “Danish Financial Supervisory Authority” (DFSA). Unigestion Asset Management (Düsseldorf) SA is co-regulated by the “Autorité des Marchés Financiers” (AMF) and the “Bundesanstalt für Finanzdienstleistungsaufsicht” (BAFIN).