How Natural Language Processing and Machine Learning Boost Fund Manager Selection Success
Authors:
Natalia Sigrist
Partner, Private Equity Unigestion
Borja Fernández Tamayo
Associate, Private Equity Unigestion
Reiner Braun
Universität München School of Management
Florencio López-de-Silanes
Université Côte d’Azur SKEMA Business School and NBER
Ludovic Phalippou
University of Oxford, Said Business School
Key Points
- Combining NLP techniques and ML algorithms to extract reliable signals from the investment memoranda of private equity funds helps us evaluate their investment attractiveness without human biases and with a better understanding of the complex relationships between factors influencing investment returns.
- In a backtest, funds selected by the algorithm as having the highest probability of success at the outset of an investment yielded an average TVPI of 2.25x – 13% higher than the average TVPI of the funds that achieved median performance.
- The scores should allow investment teams to better understand the attractiveness of investment opportunities make more informed investment decisions.
Overview
Private equity (PE) has become an important component of investment portfolios across the globe. PE fund manager selection is one of, if not the, most important, yet challenging, decisions that investors in the PE asset class need to take. In this paper, we take forward our pioneering work on machine learning (ML) in private equity to examine the efficacy of combining ML algorithms and Natural Language Processing (NLP) to predict the performance of private equity funds.
The challenge of fund selection
Historically, investors have relied on their experience and, to a certain degree, on their gut feeling to tackle the challenge of fund manager selection within private equity.
At Unigestion, we believe this traditional approach can be enhanced with Artificial Intelligence-based techniques and result in superior returns. This belief is based on the potential of such techniques to remove human biases and AI’s ability to provide better understanding of the complex relationships between the factors influencing investment returns.
In 2019, we pioneered the use of Machine Learning (ML) algorithms to predict the performance of PE funds ex-ante using quantitative features related to investment strategy, market conditions, and the performance track record of PE funds (2019 „Perspectives“/Sigrist, Perfetto).
Continuing with this line of research, we have partnered with the University of Oxford, SKEMA Business School, and the University of Munich to broaden the previous work by examining the efficacy of combining ML algorithms and Natural Processing Language (NLP) techniques to predict the performance of PE funds[1]. The combination of these techniques has proved successful in predicting future stock price movements in public markets (Ke, Kelly, and Xiu, 2019). However, in the context of privately-held illiquid investment vehicles such as private equity funds, its application had been uncertain due to a number of factors:
- The main disclosure document used by private equity fund managers to market their fund offering is the Private Placement Memorandum (PPM). While it describes the investment opportunity, provides backgrounds of the fund management team, and outlines the core terms of the fund, it is not subject to strict regulations. Therefore, fund managers have some flexibility regarding the content and presentation of information to potential investors. Completeness and transparency of the text cannot be guaranteed;
- There is a large time span, usually 10-12 years, between the identification of NLP-based signals extracted from fundraising documents and the ultimate performance of a fund. This increases the importance of post-investment factors which cannot be taken into consideration ex-ante;
- Given the private nature of these documents, the fund universe and the amount of available data to train algorithms are limited to proprietary databases, which results in relatively small samples.
At the same time, academic research has documented systematic differences in the way GPs source, select, invest, monitor, create value, and exit deals (Gompers, Kaplan, and Mukharlyamov, 2016). Moreover, there is evidence that some of these differences have informative power to explain fund performance (Biesinger, Bircan, and Ljungqvist, 2021).
These findings, coupled with the potential of the NLP techniques to identify reliable signals in texts, suggest that algorithmic performance predictions based on the analysis of PPMs can provide reliable insights to investors.
Combining NLP and ML to predict the probability of investment success
In order to extract informative signals from PPMs, we transform the text embedded in the “Investment Strategy” and “Investment Process” sections of PPMs using the Term-Frequency-Inverse Document Frequency vectorizer (TF-IDF)[2]. Then we feed three ML classifiers (Lasso, Random Forest, and Gradient Boosting) with the TF-IDF features to predict the probability that the ultimate fund’s Total Value to Paid-In ratio (TVPI) will exceed the median TVPI of funds raised in the same vintage and pursuing the same investment strategy (LBO or other private equity funds) reported by Preqin[3]. If this probability is higher than 0.5, the fund is labelled as successful.
We assess the performance of three ML classifiers with the ROC (Receiver Operating Characteristics) curve and the corresponding AUC (Area Under the Curve). This latter metric represents the probability that a randomly chosen successful fund (fund TVPI exceeds the median TVPI of its Preqin peers) is attributed a higher probability of being successful than a randomly chosen unsuccessful fund (fund TVPI is below the median TVPI of its Preqin peers). In these terms, an AUC of 0.5 is equivalent to flipping a coin. Thus, the closer the AUC is to 1, the better the model distinguishes between these two categories.
We leverage a dataset from the PPMs of 304 funds, with performance available as of June 2022, that were raised between 2003 and 2013 to train the three algorithms and test them on 72 funds raised between 2014 and 2016, so-called out-of-sample[4][5].
Figure 1 shows the AUC of the three algorithms. Gradient Boosting achieves the highest AUC (0.659) among the three algorithms. Overall, the AUC in the three analyses remains significantly above 0.5
Figure 1: Out-of-Sample AUC for the Three Algorithms
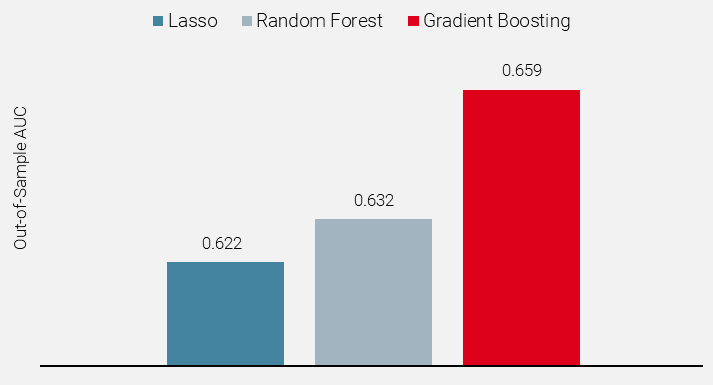
Source: Unigestion, based on Preqin data as of 30 June 2022
In order to mitigate concerns about “look-ahead bias”, we then restricted the training sample to funds raised in 2007 or earlier with performance information available as of December 2013. This reduced the training sample to 122 funds, while the test sample remained unchanged.
Figure 2 shows the ROC curve for the Gradient Boosting trained on the funds raised between 2003 and 2007 with performance information available as of December 2013 and compares it to the straight line, which corresponds to flipping a coin. The AUC resulting from back testing Gradient Boosting is 0.641.
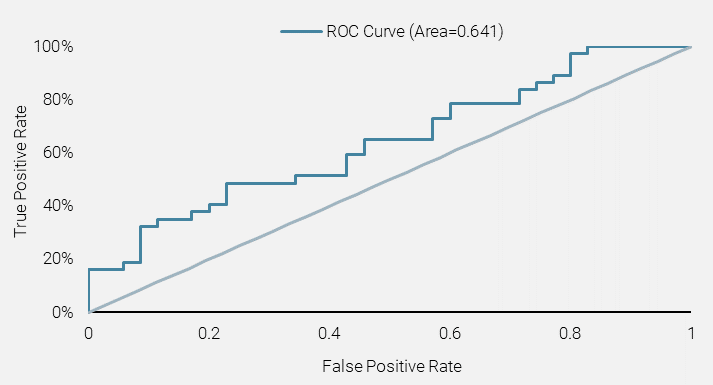
Source: Unigestion, based on Preqin data as of 30 June 2022
Avoiding the availability bias while selecting fund investment opportunities
To compare our approach to fund selection against a simple “follow the crowd” approach, we benchmark the TVPI of the managers selected by the back tested Gradient Boosting classifier against those that are able to fundraise capital more successfully (i.e. perceived to be successful by investors) using the funds raised between 2014, 2015, and 2016. To proxy for fundraising success, we use the number of months needed to close a fund.
Figure 3 plots the size-weighted average TVPI of portfolios composed of the top two to nine funds per year selected by the Gradient Boosting classifier and by the measure of fundraising success. The red line depicts the size-weighted average TVPI of the 72 funds raised between 2014 and 2016. Across all portfolio sizes, size-weighted average TVPI of the Gradient Boosting is higher than the size-weighted average TVPI of the funds with the fastest fundraising speed.
For example, an investor committing capital to the top five funds per year selected by Gradient Boosting classifier would have achieved a 2.25x TVPI, whereas an investor putting capital into the five funds with the fastest fundraising would have generated a 2.09x TVPI. This way the quantitative model can help investors avoid the so-called FoMO (“Fear of missing out”) effect which can cause investors to make suboptimal choices.
Figure 3: Relative Performance of Algorithmically Selected Fund Portfolio TVPIs
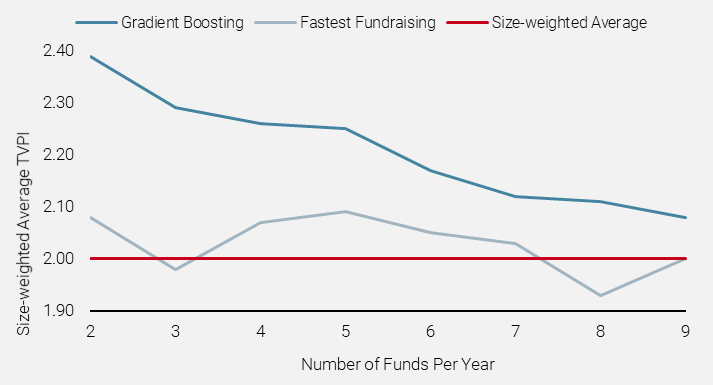
Source: Unigestion, based on Preqin data as of 30 June 2022
Unlocking the “Black Box”
ML algorithms are frequently referred to as „black boxes“ because the source of their predictions is difficult to interpret. However, recent developments in the ML field have proposed solutions to this challenge. We use one of these novel techniques – SHAP values developed by Lundberg and Lee (2017) – to determine which word combinations are more relevant to predicting GP quality.
We find that „operational (and) financial“, „network relationship“ and „relationship (with the) management team“ among other combinations of words, are positively associated with fund success. On the other hand, „investment criteria“ and „company management“ are negatively correlated with fund success. Figure 4 depicts the top-25 features in terms of variable importance in predicting fund success. Features in blue (red) are positively (negatively) correlated with fund success.
Figure 4: Most Relevant Combinations of Words to Make Predictions
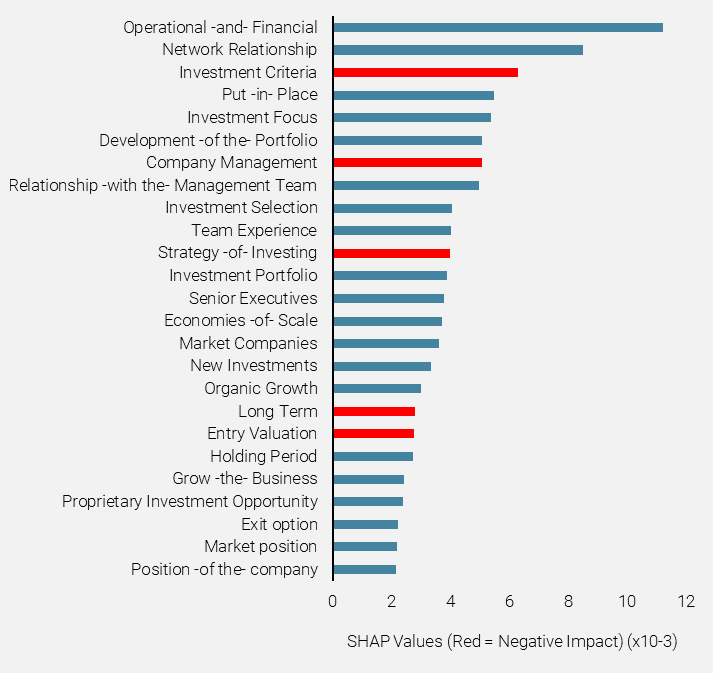
Source: Unigestion, based on Preqin data as of 30 June 2022
We emphasise that ML algorithms use non-linear interactions among multiple word combinations to make predictions. As a result, we cannot state with a high degree of certainty whether a fund will perform well or badly because the description of its investment approach includes a specific combination of words. SHAP value merely helps us better interpret the overall model output. The beauty of ML lies in its ability to make sense of complex, non-linear relationships among various features and identify patterns humans cannot observe.
What next: combining NLP-based features and numerical features?
We believe that recent advancements in big data and AI will help private market investors reduce information asymmetries, democratise PE opportunities and create value through a more transparent and efficient investment evaluation and selection process.
The above results outline the potential benefits of using NLP-based methods in combination with ML algorithms in investment decision-making. While this study only relies on textual data to predict fund performance, Unigestion believes the combination of textual data with other numerical inputs can lead to better predictive capability and, consequently, better returns.
I. References
Biesinger, M., Bircan, C., & Ljungqvist, A. (2021). Value creation in private equity.
Braun, Fernández Tamayo, López-de-Silanes, Phalippou, and Sigrist (2023)
Gompers, Paul, Steven N. Kaplan, and Vladimir Mukharlyamov. „What do private equity firms say they do?.“ Journal of Financial Economics 121.3 (2016): 449-476.
Ke, Z. T., Kelly, B. T., & Xiu, D. (2019). Predicting returns with text data (No. w26186). National Bureau of Economic Research.
Lundberg, S. M., & Lee, S. I. (2017). A unified approach to interpreting model predictions. Advances in neural information processing systems, 30.
[1] See Braun, Fernández Tamayo, López-de-Silanes, Phalippou, and Sigrist (2023) for the academic paper.
[2] TF-IDF vectorizer is a methodology used to represent words into numerical vectors. The TF-IDF of a certain word in a document accounts for the frequency of the word in the document as well as its frequency across all documents. Therefore, TF-IDF vectorizer captures the relative importance of words in a set of documents.
[3] Source: Preqin data as of 30 June 2022.
[4] Unreported results show that the predictive ability of the algorithms improve when we restrict the training sample to funds raised in 2003 onwards, instead of 1999 onwards, given that the vocabulary is more similar across years.
[5] A 80/20 training/test split is the Pareto Principle in Machine Learning. The training sample includes c.81% of the sample (i.e., 304 funds) and the test sample is composed of c.19% of the sample (i.e., 72 funds).
Important information
Past performance is no guide to the future, the value of investments, and the income from them change frequently, may fall as well as rise, there is no guarantee that your initial investment will be returned. This document has been prepared for your information only and must not be distributed, published, reproduced or disclosed by recipients to any other person. It is neither directed to, nor intended for distribution or use by, any person or entity who is a citizen or resident of, or domiciled or located in, any locality, state, country or jurisdiction where such distribution, publication, availability or use would be contrary to law or regulation. This is a promotional statement of our investment philosophy and services only in relation to the subject matter of this presentation. It constitutes neither investment advice nor recommendation. This document represents no offer, solicitation or suggestion of suitability to subscribe in the investment vehicles to which it refers. Any such offer to sell or solicitation of an offer to purchase shall be made only by formal offering documents, which include, among others, a confidential offering memorandum, limited partnership agreement (if applicable), investment management agreement (if applicable), operating agreement (if applicable), and related subscription documents (if applicable). Please contact your professional adviser/consultant before making an investment decision.
Where possible we aim to disclose the material risks pertinent to this document, and as such these should be noted on the individual document pages. The views expressed in this document do not purport to be a complete description of the securities, markets and developments referred to in it. Reference to specific securities should not be considered a recommendation to buy or sell. Investors shall conduct their own analysis of the risks (including any legal, regulatory, tax or other consequences) associated with an investment and should seek independent professional advice. Some of the investment strategies described or alluded to herein may be construed as high risk and not readily realisable investments, which may experience substantial and sudden losses including total loss of investment. These are not suitable for all types of investors.
To the extent that this report contains statements about the future, such statements are forward-looking and subject to a number of risks and uncertainties, including, but not limited to, the impact of competitive products, market acceptance risks and other risks. Actual results could differ materially from those in the forward-looking statements. As such, forward looking statements should not be relied upon for future returns. Targeted returns reflect subjective determinations by Unigestion based on a variety of factors, including, among others, internal modeling, investment strategy, prior performance of similar products (if any), volatility measures, risk tolerance and market conditions. Targeted returns are not intended to be actual performance and should not be relied upon as an indication of actual or future performance.
Data and graphical information herein are for information only and may have been derived from third party sources. Unigestion takes reasonable steps to verify, but does not guarantee, the accuracy and completeness of this information. As a result, no representation or warranty, expressed or implied, is or will be made by Unigestion in this respect and no responsibility or liability is or will be accepted. All information provided here is subject to change without notice. It should only be considered current as of the date of publication without regard to the date on which you may access the information. Rates of exchange may cause the value of investments to go up or down. An investment with Unigestion, like all investments, contains risks, including total loss for the investor.
Backtested or simulated performance: Backtested or simulated performance is not an indicator of future actual results. The results reflect performance of a strategy not currently offered to any investor and do not represent returns that any investor actually attained. Backtested results are calculated by the retroactive application of a model constructed on the basis of historical data and based on assumptions integral to the model which may or may not be testable and are subject to losses.
Changes in these assumptions may have a material impact on the backtested returns presented. Certain assumptions have been made for modeling purposes and are unlikely to be realized. No representations and warranties are made as to the reasonableness of the assumptions. This information is provided for illustrative purposes only. Backtested performance is developed with the benefit of hindsight and has inherent limitations. Specifically, backtested results do not reflect actual trading or the effect of material economic and market factors on the decision-making process. Since trades have not actually been executed, results may have under-or over-compensated for the impact, if any, of certain market factors, such as lack of liquidity, and may not reflect the impact that certain economic or market factors may have had on the decision-making process. Further, backtesting allows the security selection methodology to be adjusted until past returns are maximized. Actual performance may differ significantly from backtested performance.
Unigestion (UK) Ltd. is authorised and regulated by the UK Financial Conduct Authority (FCA). It is also registered with the Securities and Exchange Commission (SEC). Unigestion SA is authorised and regulated by the Swiss Financial Market Supervisory Authority (FINMA). Unigestion Asset Management (France) S.A. is authorised and regulated by the French Autorité des Marchés Financiers (AMF). Unigestion Asset Management (Canada) Inc., with offices in Toronto and Montreal, is regulated in Canada by the securities regulatory authorities in Ontario, Quebec, Alberta, Manitoba, Saskatchewan, Nova Scotia, New Brunswick and British Columbia. Its principal regulator is the Ontario Securities Commission.
Document issued June 2023.
Authors:
Natalia Sigrist
Partner, Private Equity Unigestion
Borja Fernández Tamayo
Associate, Private Equity Unigestion
Reiner Braun
Universität München School of Management
Florencio López-de-Silanes
Université Côte d’Azur SKEMA Business School and NBER
Ludovic Phalippou
University of Oxford, Said Business School